ICPUSDT The overall trend of BINANCE:ICPUSDT is bearish, as the price is below the 200 EMA and the EMAs are sloping downward. Currently, the price is near the support level of 3.300 USD, and if this level is broken, a further decline toward 2.865 USD is possible.
Supports:
3.300 USD 🛑
2.865 USD 🛑
2.300 USD 🛑
Resistances:
3.700 USD 🔼
4.356 USD 🔼
5.500 USD 🔼
Icpusdtidea

ICP/USDT at Key Support Level: Major Bounce or Further Decline?On the Weekly (1W) timeframe, ICP/USDT remains in a long-term bearish structure, characterized by a clear sequence of lower highs and lower lows after failing to sustain the double-digit price zone. Price is currently retesting a historical major demand zone at 3.23 – 2.70, which previously acted as the base for a strong bullish impulse.
This zone is extremely critical, as it represents a key weekly support and a decision area that will determine whether ICP enters a long-term accumulation phase or continues its bearish trend.
---
Key Levels
Major Weekly Demand / Support:
3.23 – 2.70 (yellow box)
Nearest Resistance:
3.90 – 4.60
Mid-Term Resistance:
6.85
Major Supply Zones:
10.95 – 14.55 – 18.80
All-Time High Reference:
38.02
---
Pattern & Structure Explanation
1. Descending Market Structure (Bearish Trend)
Price continues to form lower highs from the 18–20 region, confirming strong seller dominance.
2. Potential Base Formation / Double Bottom (Conditional)
Repeated reactions around 3.23 – 2.70 suggest a possible long-term base, but confirmation is required through a structural breakout.
3. Long Lower Wick Rejection on Weekly Support
Strong lower wicks indicate buying interest and demand absorption, often seen during early accumulation phases.
---
Bullish Scenario
The bullish scenario becomes valid only if:
Price holds above the 3.23 – 2.70 demand zone
A strong weekly close above 3.90 – 4.60 occurs
Bullish Targets (Step by Step):
4.60 → initial recovery confirmation
6.85 → structural resistance
10.95 → major supply zone
14.55 – 18.80 → potential distribution area
This scenario reflects a long-term accumulation and recovery phase rather than a short-term breakout.
---
Bearish Scenario
Bearish continuation is likely if:
Price breaks and closes below 2.70 on a weekly basis
No strong bullish reaction appears inside the demand zone
Bearish Implications:
Failure of the historical demand zone
Increased downside momentum
Potential move into lower price discovery zones
A breakdown below this area would signal structural support invalidation and full seller control.
---
Conclusion
The 3.23 – 2.70 area is a make-or-break zone for ICP.
As long as price holds above this level, long-term accumulation remains possible. A confirmed breakdown, however, would open the door for further bearish continuation.
This is a decision zone, not a FOMO area.
#ICPUSDT #ICP #CryptoAnalysis #WeeklyChart #DemandZone #SupportResistance #BearishTrend #BullishReversal #LongTermSetup

#ICP/USDT The price is moving in a descending channel#ICP
The price is moving within a descending channel on the hourly timeframe. It has reached the lower boundary and is heading towards a breakout, with a retest of the upper boundary expected.
The Relative Strength Index (RSI) is showing a downward trend, approaching the lower boundary, and an upward bounce is anticipated.
There is a key support zone in green at 3.16, and the price has bounced from this level several times. Another bounce is expected.
The indicator is showing a trend towards consolidation above the 100-period moving average, which we are approaching, supporting the upward move.
Entry Price: 3.32
First Target: 3.42
Second Target: 3.54
Third Target: 3.70
Stop Loss: Below the green support zone.
Remember this simple thing: Money management.
For any questions, please leave a comment.
Thank you.

ICP/USDT – This Accumulation Breakout! Get Ready to FLY!ICP has finished its accumulation phase and is now reclaiming a major structural level after a prolonged downtrend. This is not a random move — this is a clear shift in positioning.
Price is holding above the reclaimed zone, signaling acceptance and intent to expand higher. As long as this level holds, upside continuation remains the dominant scenario.
This is where early positioning matters — not after expansion starts.
Entry: 3.78 - 3.3
Stop Loss: 3.05
Target 1: 5.70
Target 2: 7.24
Final Target: 9.37
Bias: Bullish continuation
Invalidation: Daily close back below 3.05

ICP/USDT at Make-or-Break Zone - Reversal or Further Sell-Off?ICP/USDT on the Weekly (1W) timeframe is still moving within a long-term downtrend structure after failing to hold above the $20 area. Price has now moved lower and is currently testing a very strong historical demand zone at $3.215 – $2.200 (yellow box).
This zone previously acted as a major accumulation base before the strong bullish impulse in early 2024. Price reaction in this area will be a key determinant for the medium- to long-term trend direction.
---
Structure & Chart Pattern
Primary Trend: Bearish (Lower High & Lower Low still valid)
Current Phase: Major Demand Zone Test / Accumulation Area
Market Structure:
Breakdown from the previous consolidation structure
Price has returned to the lowest historical support area
Volatility Spike:
Presence of an extreme long lower wick → strong rejection from lower prices & potential smart money buying
---
Key Levels
Major Demand Zone:
🟨 $3.215 – $2.200 (critical make-or-break zone)
Step-by-Step Resistance Levels:
$4.580
$6.850
$10.950
$14.550
Major Supply / Higher Timeframe Resistance:
$18.830 – $20.985
---
Bullish Scenario
The bullish scenario becomes valid if and only if:
Price holds above the $3.215 – $2.200 demand zone
A weekly higher low or bullish weekly close is formed
Followed by a break and close above $4.580
Bullish Targets (Step-by-Step):
1. $4.580 (structure retest)
2. $6.850 (mid resistance)
3. $10.950 (major breakout confirmation)
4. $14.550 – $18.830 (bullish continuation zone)
📌 Note:
As long as price holds above the demand zone, ICP has the potential to form a long-term accumulation base for a major reversal.
---
Bearish Scenario
The bearish scenario will play out if:
Price records a strong weekly close below $2.200
The major demand zone fails to hold
Bearish Implications:
Breakdown of historical support
Increased risk of extended panic selling
Price may enter lower price discovery
Bearish structure becomes stronger and fully validated
📌 $2.200 is the final psychological and technical boundary.
---
Conclusion
ICP is currently at a critical long-term decision point.
The $3.215 – $2.200 zone represents a major decision area:
Holding the zone → potential reversal & accumulation
Breaking the zone → extreme bearish continuation
Aggressive positioning is not recommended until a clear weekly close confirmation is observed.
---
#ICP #ICPUSDT #Altcoin #CryptoAnalysis #AltcoinAnalysis #WeeklyChart #MarketStructure
#DemandZone #SupportResistance #Downtrend #PotentialReversal
#SmartMoney

#ICP/USDT The price is moving in a descending channel#ICP
The price is moving in a descending channel on the 1-hour timeframe. It has reached the lower boundary and is heading towards breaking above it, with a retest of the upper boundary expected.
We have a downtrend on the RSI indicator, which has reached near the lower boundary, and an upward rebound is expected.
There is a key support zone in green at 2.80. The price has bounced from this zone multiple times and is expected to bounce again.
We have a trend towards consolidation above the 100-period moving average, as we are moving close to it, which supports the upward movement.
Entry price: 2.88
First target: 2.92
Second target: 2.98
Third target: 3.06
Don't forget a simple principle: money management.
Place your stop-loss below the support zone in green.
For any questions, please leave a comment.
Thank you.

ICP — Golden Pocket Retest: Reversal or Continuation Down?After a long period of accumulation followed by an extreme capitulation phase, ICP is finally showing signs of life again. The recent sharp rally managed to break through several mid-term supply levels, but now the price is retesting the most critical zone on the chart — the Fibonacci Golden Pocket (0.5–0.618) range between $5.26–$5.98.
This yellow box is not just another technical bounce zone — it’s the decisive point for ICP’s mid-term direction:
will ICP continue its recovery toward the former distribution area at $9.20 to $14.70,
or will it fall back into the depths below $2.00?
---
Structure & Pattern
Phase 1: Sideways Accumulation (Early 2025)
The price moved sideways for months — a strong sign of silent accumulation by larger players.
Phase 2: Capitulation & Sharp Recovery
A deep breakdown followed by a vertical spike toward $15.58 shows a massive liquidity sweep — stop-losses were cleared out, and the market reacted with a relief rally.
Phase 3: Golden Pocket Retest (Now)
The price is retracing in a controlled manner back into the $5–$6 zone, now serving as a key confluence of horizontal structure and Fibonacci support.
---
Bullish Scenario (Potential Reversal)
If the price can hold the $5–$6 zone and form a strong 2D candle closing above $6.50–$7.20, a new Higher Low structure will be confirmed — signaling the possibility of the next bullish leg.
Confirmation: Break & Retest above $7.20
Targets:
Target 1 → $9.20 (minor supply zone)
Target 2 → $14.70 (major resistance & previous high)
Momentum Clues: Increasing volume on green candles and a developing bullish RSI divergence.
This could mark the beginning of a mid-term reversal for ICP, with potential upside exceeding +140% from the current price (~$6.07).
---
Bearish Scenario (Rejection Case)
However, if the Golden Pocket fails to hold and a 2D close below $5.00 occurs, the entire rally may turn out to be nothing more than a dead cat bounce.
In this case, ICP risks continuing its decline toward:
First support: $3.00
Major support: $1.80 (historical low and liquidity base)
A confirmed breakdown below $5.00 would indicate that the market structure remains fully under sellers’ control.
---
Conclusion
The $5.0–$6.0 range is the most decisive level for the coming months.
If it holds and forms a higher low, ICP may enter a new bullish cycle — but if it breaks down, a new distribution phase could begin.
📊 The golden pocket will decide the next chapter: is this the start of ICP’s rebirth, or just another bounce before another collapse?
---
Trading Plan
Aggressive Entry: Buy between 5.3–6.0, SL < 4.8
Conservative Entry: Wait for a Break & Retest above 7.20
Take Profit Targets: 9.20 → 14.70
Bullish Invalidation: 2D Close below 5.0
---
#ICP #ICPUSDT #CryptoAnalysis #GoldenPocket #Fibonacci #PriceAction #CryptoReversal #AltcoinSeason #TechnicalAnalysis #CryptoBreakout #MarketStructure

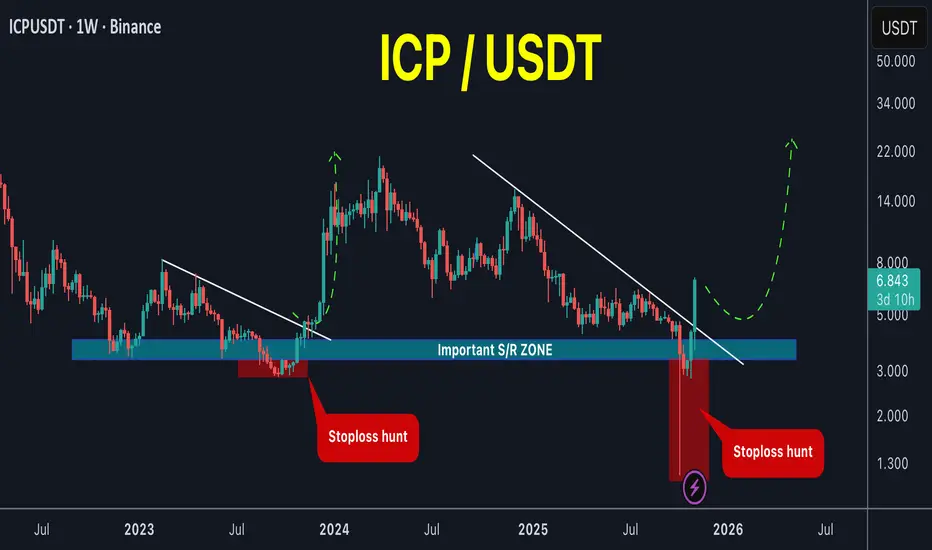
ICP wakes up from the dead!#ICP / USDT
After being useless for several months this coin made a similar movements like the one in late 2023
Price dropped below the most important S/R zone in chart taking the liquidity and after that massive volume started to enter the coin
Such movement in late 2023 ends up in X5 increase in its price in next months (after restoring the S/R)… price can make the similar movement here … ICP is waking up from the dead !
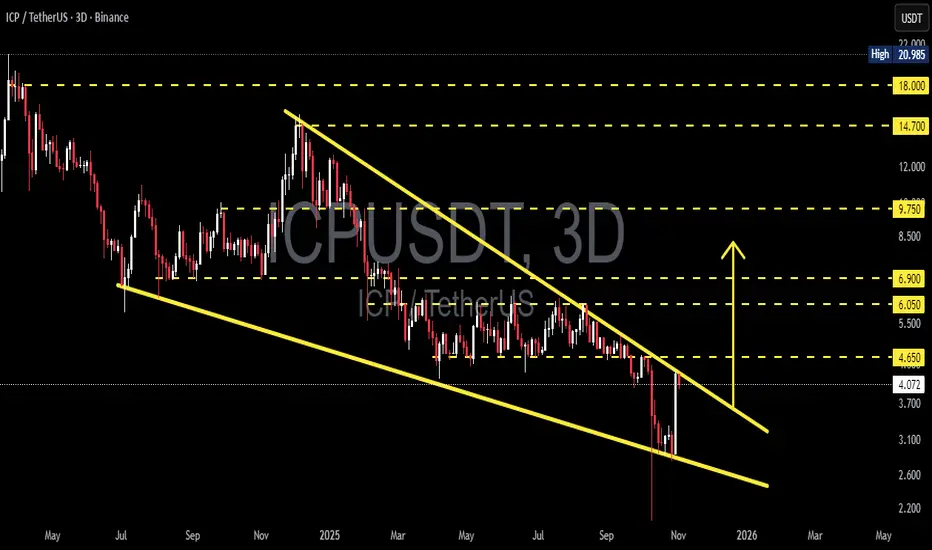
ICPUSDT – Major Reversal Setup Forming! Ready for Breakout Move?The ICP/USDT chart is currently displaying a highly critical structure as price continues to compress within a Falling Wedge pattern that has been developing since early 2025.
This formation is often seen as a bullish reversal signal — typically marking the end of a prolonged downtrend and the start of an accumulation or reversal phase.
At the current price level around $4.09, selling pressure has started to weaken, while buying pressure is gradually building up. Price is reacting positively from the lower wedge boundary and is now challenging the upper trendline resistance.
A confirmed breakout above this zone, especially with strong volume, could spark a major bullish momentum — opening the door for a move toward the next resistance targets at $4.65, $6.05, and $6.90.
However, if the price faces rejection once again from the upper wedge boundary, consolidation or another retest of the $3.10–$2.60 support zone remains possible.
This area marks a decisive moment for ICP’s mid-term direction.
---
Pattern Description
A clear Falling Wedge (Bullish Reversal Pattern) is visible through two downward-sloping and converging trendlines.
Key characteristics: lower lows are slowing down, highs continue to descend, and trading volume decreases over time.
Technical implication: selling pressure is fading, and accumulation is likely occurring before a potential reversal.
---
Bullish Scenario
A confirmed bullish breakout would occur once the price closes decisively above the upper wedge line and the $4.65 resistance on the 3-day timeframe, accompanied by a surge in trading volume.
If validated, upside targets could include:
Target 1: $6.05 (initial resistance and profit-taking area)
Target 2: $6.90 (mid-range wedge resistance)
Target 3: $9.75 (major resistance zone and possible momentum expansion)**
Breakouts from large falling wedges on higher timeframes often trigger strong mid- to long-term reversals, particularly when supported by high volume.
---
Bearish Scenario
If the breakout attempt fails and price gets rejected around the $4.65–$4.80 region, selling pressure could drag ICP back down toward the $3.10 – $2.60 support zone.
A breakdown below this area would invalidate the bullish setup and likely resume the macro bearish trend.
The $3.10 level is the key structural support — losing it would confirm renewed weakness.
---
Overall Outlook
ICP is currently at a make-or-break level, where a confirmed breakout could shift market sentiment from bearish to neutral–bullish.
The technical structure favors a potential trend reversal, but confirmation is crucial before positioning aggressively.
False breakouts remain possible, so risk management and patience are essential.
Psychologically, reclaiming $4.65 would be the first sign of a sentiment shift, potentially leading to renewed investor confidence in ICP’s mid-term recovery.
---
Summary
Pattern: Falling Wedge (Bullish Reversal Pattern)
Status: Approaching breakout area
Bullish Trigger Zone: Above $4.65
Bullish Targets: $6.05 → $6.90 → $9.75
Critical Support Zone: $3.10 – $2.60
Dominant Bias: Neutral turning bullish upon breakout confirmation
---
#ICP #ICPUSDT #ICPTether #CryptoAnalysis #TechnicalAnalysis #FallingWedge #ReversalPattern #BreakoutSetup #SwingTrade #CryptoChart #AltcoinWatch #MarketStructure
My point of view for ICPDear Follower
I got a multi request to analyze ICP
I see ICP most likely will hit $45 as a final target
I recommend liquidate 50% of your fund at that price then start use a trilling stop under each last new bottom for the rest of the fund
Good luck everyone

ICPUSDT — Retesting Demand Zone: Capitulation or Major Reversal?Weekly Overview
Internet Computer (ICP) is now entering a critical test phase at its long-standing historical demand zone between 2.80 and 4.53 USDT — an area that has repeatedly acted as the last line of defense for buyers since mid-2022.
This zone is not just another technical level. It represents a multi-year accumulation range where institutional money has historically shown interest, triggering two major reversals in the past (early 2023 and early 2024).
Now, the market is testing it for the third time, and the outcome of this retest may decide ICP’s direction for the next several months — or even years.
---
Structure and Pattern Context
Since its peak in 2021, ICP has been in a long-term structural downtrend, forming a sequence of consistent lower highs.
However, it’s also built a horizontal accumulation base below 5 USDT.
The 2.80–4.53 zone acts as a compressed demand layer, where selling pressure weakens every time this range is revisited.
On the weekly timeframe, recent candles show:
Smaller body sizes,
Long lower wicks,
And declining bearish volume — clear signs of seller exhaustion.
In short, the market stands at a crossroads between “the final breakdown” and “the birth of a long-term reversal.”
---
Bullish Scenario — Potential Reversal Phase
If this demand zone holds once again, ICP could enter a medium-term reversal cycle.
Here’s what would confirm a bullish structure shift:
1. Bullish Reversal Candle — a weekly engulfing, hammer, or morning star pattern appearing inside 2.80–4.53.
2. Volume Confirmation — a noticeable increase in bullish volume, signaling smart money accumulation.
3. Structure Break — a successful weekly close above 5.98 USDT, forming a new higher high.
If these confirmations occur, ICP could initiate a gradual expansion phase toward key resistance targets:
Target 1: 5.98 USDT – structure validation
Target 2: 6.90 USDT – breakout confirmation
Target 3: 9.53 USDT – major swing resistance
Mid-term target: 15.28–18.73 USDT if momentum persists
Each step upward will depend on overall crypto sentiment and volume strength across the market.
---
Bearish Scenario — Breakdown & Capitulation Risk
If bearish pressure continues and ICP closes a weekly candle below 2.80, the accumulation base built over the last two years would become invalidated.
Such a breakdown could trigger final capitulation, characterized by panic selling and heavy volume.
Below 2.80, there’s no major historical support, meaning the price could enter a free-fall zone toward 2.00 or lower before stabilizing.
Ironically, such capitulation events often mark the true bottom of a cycle — a classic pattern seen before every major crypto bull run.
---
Structural Perspective — End of the Downtrend?
Some longer-term signals suggest ICP may be approaching trend exhaustion:
Weekly RSI has remained in oversold territory for a prolonged time, while price fails to make new lows — indicating bullish divergence.
Major distribution phases occurred between 2022–2023, implying most selling pressure is likely done.
Price action resembles a late-stage accumulation phase, where smart money prepares for long-term positions (12–24 months ahead).
If this demand holds, the 2.80–4.53 range could become ICP’s legendary bottom, much like ETH’s 2020 base or ADA’s 2020–2021 accumulation.
---
Conclusion
ICP stands at a make-or-break point — the most decisive level it has seen in two years.
Holding 2.80–4.53 → opens the door for a potential major reversal.
Breaking below 2.80 → signals a final capitulation phase before a new cycle emerges.
Until proven otherwise, the reaction and weekly close inside this demand zone remain the key factor to watch.
As long as 2.80 holds, the bullish probability still exists.
#ICP #ICPUSDT #InternetComputer #Crypto #TechnicalAnalysis #PriceAction #DemandZone #SwingTrade #CryptoMarket #WeeklyChart #ReversalSetup #CryptoTA #Accumulation
ICPUSD – Trading the Range with PrecisionSince December last year, ICP has been in a persistent downtrend, sliding from 15 USD to below 5 USD. Sellers have clearly dominated the longer-term picture.
However, after establishing April’s low, the market transitioned into a well-defined sideways range between 4.5 and 6.2 USD. This type of consolidation after a heavy decline often signals a pause – and can present trading opportunities within the boundaries.
Right now, ICPUSD is once again testing the bottom of this range near 4.5. From a tactical perspective, this creates a favorable setup: by entering long positions at the range low, we can aim for the upper boundary with a 1:3.5 risk-to-reward ratio.
Trading Plan:
• ✅ Favor long positions near 4.5 USD
• 🛑 Place a tight stop-loss just below range support
• 🎯 First target: 6.0 – 6.2 USD, the upper range resistance
Conclusion: Until ICPUSD breaks decisively below support, the range remains intact. I favor buying dips with disciplined risk management, targeting the 6 USD area for a clean swing trade setup. 🚀

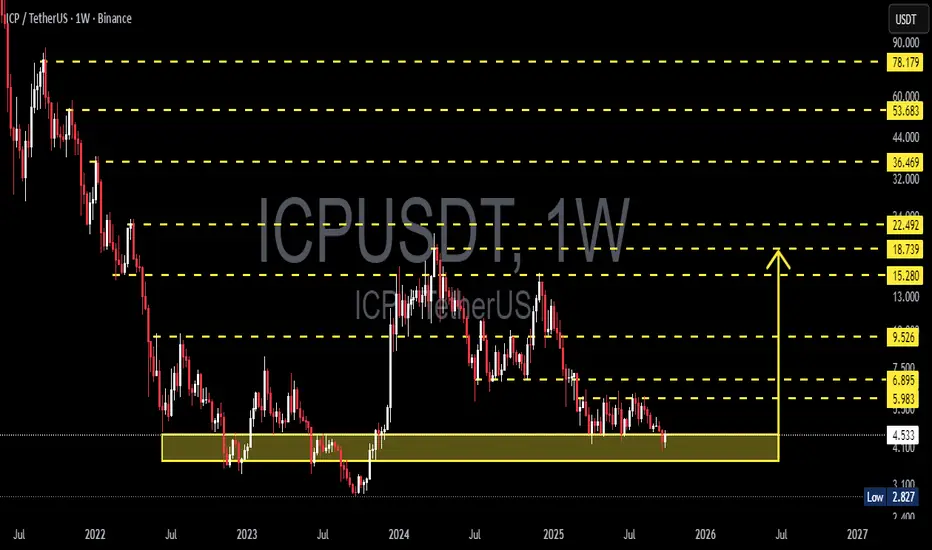
ICP/USDT — Major Demand Zone Retest: Rebound or Breakdown Ahead?At the moment, ICP is standing at a very critical crossroads. The weekly chart shows the price retesting the historical demand zone around $4.10 – $4.79. This area has repeatedly acted as a strong accumulation base in the past, triggering significant rallies. However, the more often this zone gets tested without a breakout to the upside, the higher the risk of a breakdown.
---
🔎 Key Technical Structure
1. Long-Term Trend: ICP remains in a broad downtrend since launch, with failed mid-term rallies along the way.
2. Demand Zone $4.1 – $4.8: A psychological and historical support area, holding the price since 2022.
3. Layered Resistances: Key levels to watch are $5.98, $6.90, $9.53, followed by $15.28, $18.74, and $22.49. Breaking through these would confirm a larger bullish reversal.
4. Final Support Below: If breakdown occurs, the next major level sits at $2.827 — a historical low.
---
📈 Bullish Scenario
Validation: A strong weekly bullish close within or above $4.1–$4.8, supported by rising volume, would signal potential accumulation.
Short-Term Target: $5.98 – $6.90 → reclaiming this range could push ICP toward $9.53.
Mid-Term Target: If momentum continues, ICP could revisit $15.28 – $18.74, and even $22.49.
Potential Pattern: A double bottom / W pattern would form if price closes above the $6.9 neckline.
---
📉 Bearish Scenario
Breakdown Confirmation: A weekly close below $4.10 = strong bearish continuation signal.
Downside Target: Price may slide toward $2.827 (historical low).
Seller Dominance: A breakdown with rising sell volume would confirm extended bearish control.
Risk Factor: Losing this demand zone would likely extend ICP’s bear cycle significantly.
---
📊 Price Action & Patterns
Sideways Range in Demand Zone: Currently, price is moving sideways within demand → this is a classic setup for accumulation or distribution.
Breakout Above: Signals accumulation → start of a potential uptrend.
Breakdown Below: Signals distribution → likely deeper decline.
---
⚖️ Conclusion
ICP is at a make-or-break zone:
Holding above $4.1–$4.8 could spark a strong reversal rally back toward $6.9 – $9.5, with higher targets possible.
A breakdown below $4.1 would expose ICP to a retest of the $2.8 low, keeping the long-term bearish structure intact.
📌 For traders, this is the time to wait for weekly candle confirmation & volume before committing.
📌 For long-term investors, this zone offers a high-risk but high-reward accumulation area — strict stop losses are essential.
---
#ICP #ICPUSDT #CryptoAnalysis #WeeklyChart #SupportResistance #TechnicalAnalysis #SwingTrading #Altcoins #CryptoStrategy

Bullish Setup: ICP Eyes 70% Gain if Resistance BreaksAfter the strong drop that started in December last year — a move of almost 70%, from 15.5 down to around 4 — ICP entered a 4-month consolidation/accumulation phase.
The range is well defined:
• Support: around 4.5
• Resistance: slightly above 6
With Total3 showing a bullish outlook, there’s a high probability that ICP will finally break above 6 and accelerate towards the 10 USD key zone.
That would mean roughly a 70% upside, and with a 1:3 risk-to-reward ratio, this setup deserves your attention.
📌 Plan : Watch for a confirmed breakout above 6 and manage risk according to your trading rules.
🚀

ICP Closing in on Major Resistance – Eyes on Retest ZoneIf $ICP/USDT breaks above the marked resistance and successfully retests the zone, we could see a strong move to the upside.
It’s shaping up well — keep it on your radar.
DYOR, NFA

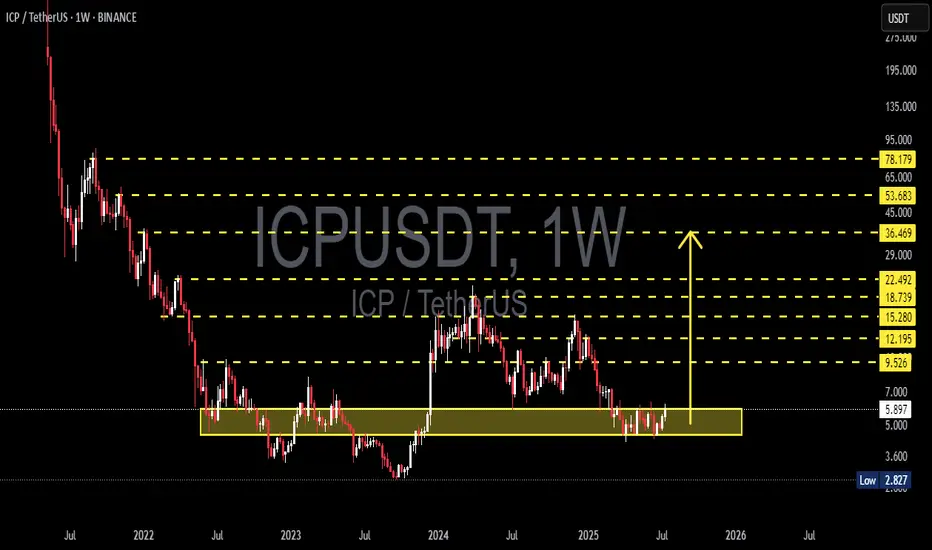
ICP/USDT Weekly Analysis: Multi-Year Accumulation Base🔍 Macro Outlook & Context:
ICP has been in a prolonged downtrend since its initial listing, dropping over 95% from its all-time high. However, since late 2022, ICP has been forming a strong and well-defined accumulation base between the $3.00 – $6.00 range.
Currently, price action and structure indicate that a potential breakout from this multi-year base is imminent. The setup is beginning to mirror a Wyckoff Accumulation Phase, where smart money accumulates quietly before launching into the next markup phase.
📐 Technical Structure & Pattern Breakdown:
✅ Accumulation Zone
Over 80 weeks of consolidation within a tight horizontal range.
This forms a strong foundation for a powerful breakout move if confirmed.
✅ Multiple Bottom Formation
Repeated failures to break below $3.50 suggest growing bullish pressure and seller exhaustion.
✅ Bullish Compression
Higher lows forming inside the range.
Resistance at $6.00 is being tested more frequently, indicating a breakout buildup.
✅ Volume Profile
Declining volume during sideways action = typical of supply exhaustion.
Surge in volume during breakout would confirm entry into markup phase.
🚀 Bullish Scenario (Primary Setup):
If price breaks and closes above $6.00 on the weekly timeframe:
Key Resistance Targets:
$9.52 → $12.19 → $15.28 → $18.73 → $22.49
Extended Bull Market Targets:
$29 → $36 → $45+
Potential ROI from base zone: +200% to +600%
Bullish Confirmation Signals:
Strong weekly candle close above $6.00
Volume breakout
RSI crossing 50 and MACD bullish crossover
🐻 Bearish Scenario (Alternative):
If the breakout fails and rejection occurs at $6.00:
Possible retracement back to lower support zones:
$4.50 → $3.00
A breakdown below $3.00 would invalidate the bullish structure and open risk for new lows.
Bearish Red Flags:
Long upper wick near resistance without volume
RSI drops back under 40
Breakdown of $3.50–$4.00 support zone
📊 Trading Strategy & Risk Management:
Entry Type Price Range
Breakout Entry $6.20–$6.50
Conservative SL $5.20
Aggressive SL $4.70
TP Range $9.5 to $22.4
Long-Term TP Up to $45+
Use scaled take-profits to secure gains gradually and reduce risk.
🧠 Market Sentiment & Psychology:
Sentiment is slowly shifting from fear to anticipation. Long-term accumulators and institutional players often target setups like this — low prices with solid structure and untapped upside. If breakout confirms, ICP could become one of the top-performing altcoins of the next cycle.
> “Accumulation is where smart money buys. Breakout is where the public chases.”
📌 Final Thoughts:
ICP/USDT is at its most critical point in over two years. A confirmed breakout from this long-standing base could be the launchpad for a multi-stage rally. This is a setup worth watching closely — or acting on with tight risk control.
#ICPUSDT #CryptoBreakout #AltcoinAnalysis #TechnicalAnalysis #WyckoffAccumulation #LongTermSetup #CryptoReversal #BullishCrypto #ICPAnalysis #AltcoinSeason #BreakoutTrade #Cryptocurrency

ICPUSDT 1W AnalysisICP ~ 1W Analysis
#ICP If you still have confidence in this coin, maybe you can consider this support to start buying back from here, with a short-term target of at least 15%++

#ICP/USDT#ICP
The price is moving within a descending channel on the 1-hour frame, adhering well to it, and is heading towards a strong breakout and retest.
We are experiencing a rebound from the lower boundary of the descending channel, which is support at 5.85.
We are experiencing a downtrend on the RSI indicator that is about to be broken and retested, supporting the upward trend.
We are heading towards stability above the 100 Moving Average.
Entry price: 6.04
First target: 6.13
Second target: 6.28
Third target: 6.50

ICPUSDT 1D AnalysisICP ~ 1D Analysis
#ICP Buy gradually from here if you still have confidence in this coin with a short term target of at least 10%+ from here.

ICPUSDT 1D AnalysisICP ~ 1D Analysis
#ICP Buy gradually after successfully breaking through this resistance line, with a short-term target of at least 10% gain.

Internet Computer (ICP) WILL MELT FACES SOON !!!On weekly time frame Internet Computer (ICP) formed bullish Shark Pattern & currently ICP is hovering over it's Potential Reversal Zone. Soon we expect strong move in ICP targeting 21$ & 38$ price levels.

ICPUSDT 1WICP ~ 1W
#ICP If you still have Conviction on this coin,. Buy in stages from here with a minimum target of 20%++
