EURUSD - Stuck in Consolidation With Downside Bias[EURUSD has been trading inside a clear consolidation zone after an extended move higher, respecting both the upper and lower boundaries of the channel structure. Price action remains trapped within this range, with liquidity already taken from the upside during the recent sweep.
Consolidation Dynamics
The pair is currently caught in a sideways structure, compressing between resistance above and support below. We already had a perfect retest inside the fair value gap, and the reaction suggests that momentum is leaning toward the downside. Until price decisively breaks the channel, traders should treat this as a range-bound environment with strong respect for key levels.
Bearish Scenarios
Given that the liquidity grab on the upside of the range has already occurred, the likelihood of a downward move has increased. From here, price could drop directly from the current level to retest the channel line and the demand zone below. This would confirm the idea that buyers are struggling to push beyond the consolidation ceiling.
Alternative Bullish Path
It is still possible that price makes one more push higher into the red supply zone before reversing. If this happens, the move would likely serve as a final inducement before sellers step in, driving price back down into the bottom side of the channel where support and liquidity rest.
Price Targets and Expectations
In both scenarios, the lower boundary of the channel remains the key target area to watch. A clean retest of this level would align with previous reactions and could offer another potential base for continuation higher in the broader trend. Until then, the immediate expectation favors a move toward the downside.
Conclusion
EURUSD is consolidating with signs of weakness after the sweep of the highs, making a retracement toward the lower channel line the most probable outcome. Whether price drops directly from here or first taps into the red supply zone, the downside appears to be the more likely path in the short term.
Disclosure: I am part of Trade Nation's Influencer program and receive a monthly fee for using their TradingView charts in my analysis.
___________________________________
Thanks for your support!
If you found this idea helpful or learned something new, drop a like 👍 and leave a comment, I’d love to hear your thoughts! 🚀
Ict

BTC/USD UpdateNext move on the way focus on proper risk management & stay disciplined. Wishing you successful trades.
Key Reason:
1. 2H fresh OB + FVG still in pending.
2: Price break the consolidation towards downside.
3. Bearish pressure also strong.
4. possible downside move expected.
This is not financial advice take it with your own risk. Once price tap our zone switch into lower time frame for confirmation. Let's see how it will work.

EURUSD - Bullish outlook heading into next week!Introduction
The EURUSD experienced a strong surge last Friday, largely driven by Jerome Powell’s speech, which added significant momentum to the market. This impulsive move to the upside successfully filled both the bearish 4-hour and 1-hour Fair Value Gaps (FVGs). The candle that formed was notably strong and bullish, and because of its size and strength, it is highly probable that we will see at least a 50% retracement of this candle before price continues to push higher. Such a retracement would allow the market to gather liquidity and prepare for another bullish leg.
Liquidity Sweep
Before this sharp rally, the EURUSD executed a liquidity sweep at the recent lows, clearing out stop losses and inducing sellers into the market. This is a classic move often seen before a strong reversal to the upside. Following this sweep, price accelerated with an aggressive bullish candle. My expectation now is for the market to retrace into this candle, ideally retracing deeply enough to provide a high-probability entry for continuation to the upside. This liquidity sweep sets the stage for a bullish scenario, as it suggests that smart money has already accumulated positions at discounted levels.
Resistance
As price surged higher, it tapped into a key area of resistance, which aligns with both the 1-hour and 4-hour FVGs. This confluence of timeframes strengthens the validity of the resistance zone and explains why price has reacted from this level. I anticipate that breaking through this resistance will require additional momentum, which may not occur immediately. Instead, we could see a short-term pullback or cooldown that allows the market to gather strength before attempting to push through this supply zone. This resistance area will therefore act as a decisive battleground for buyers and sellers.
Bullish Support
The strong bullish candle formed during the rally now serves as a new area of support. I expect price to respect the 50% retracement level of this candle, which lies around 1.166. This midpoint often acts as a significant level in technical analysis, and holding above it would confirm bullish continuation. As long as price remains above this zone, the momentum remains to the upside, and the probability of another move higher increases. This makes the retracement into this level a potential buying opportunity.
Inversion
Another important factor to consider is the inversion of the 4-hour FVG. On the previous drop, the EURUSD created a bearish 4-hour FVG, which initially acted as resistance. However, with the latest bullish impulse, this same zone has now flipped into an inversion FVG, transforming from a bearish area into a bullish support. This inversion highlights a significant shift in market structure and suggests that bulls are taking control of the price action. This level will be crucial to watch, as holding above it strengthens the case for further upside.
Final Thoughts
In summary, the EURUSD is showing strong bullish potential following the liquidity sweep and the aggressive rally sparked by Powell’s speech. While the market has reached a significant resistance area marked by the 1-hour and 4-hour FVGs, a retracement into the 50% level of the bullish candle would be healthy and provide a potential entry point for buyers. With the inversion of the previous bearish FVG into bullish support, the technical picture favors the upside as long as key support levels are respected. The coming sessions will reveal whether the market has the strength to break through resistance and continue its upward trajectory.

GBP/CHF UpdateNext move on the way focus on proper risk management & stay disciplined. Wishing you successful trades..!
Key Reason:
1. Higher time frame structure was bullish.
2. Price break minor resistance zone.
3. Strong bullish pressure.
4. Fresh demand zone. Possible upside move expected.
Let's see how it will work.
This is not a financial advice. Lower time frame confirmation very important.

XAU/USD Update 2Next move on the way focus on proper risk management & stay disciplined. Wishing you successful trades..!!
Key Reason:
1. Minor Structure was bullish.
2. Price move impulsively towards upside and hunt weak high liquidity.
3. Fresh minor BB also in pending. Let's see how it will work.
This is not a financial advice. Confirmation very important. Possible upside move towards 3400.

XAU/USD Update 1Next move on the way focus on proper risk management & stay disciplined. Wishing you successful trades..!
Confluences & Key Reason:
1. Gold has tested the resistance level, where selling pressure is expected , from this zone a possible down side move towards 3357 - 3344.
2. Also 1H SIBI still in pending. Let's see how it will work.
This is not a financial advice. This setup is a little bit risky, due to recent volatility. On higher time frame the structure was bullish.

EUR/CHF UpdateNext move on the way focus on proper risk management & stay disciplined. Wishing you successful trades.
Key Reason:
1. Impulse buying move.
2. Consolidation break downside.
3. Fresh order flow pending.
4. Fresh SSL will taken out before moving upside.
This is not a financial advice. confirmation very important. Let's see how it will work.

GBP/JPY UpdateNext move on the way focus on proper risk management & stay disciplined. Wishing you successful trades...!!
Key Reason:
1.Drop base drop structure.
2.Price taken out buy side inducement.
3.Minor MSS formed.
4.Fib. customized level.
Wait for retracement and than switch into lower time frame for confirmation. Let's see how it will work. This is not a financial advice take it with your own risk.

USD/CAD: The Perfect Storm for a Bullish BreakoutUSD/CAD is consolidating above 1.3850 after a strong bullish impulse. The technical structure shows:
A breakout from the summer bullish channel projecting towards 1.3950–1.4050, a key weekly resistance zone.
RSI remains neutral but strengthening, with no signs of immediate overextension.
Institutional demand around 1.3700 firmly rejected the downside, signaling strong long accumulation.
📌 Key levels: Support at 1.3750 / 1.3700 – Resistance at 1.3950 / 1.4050.
Commitments of Traders (COT)
USD Index: Non-commercial longs increasing (+1,330) with a slight reduction in shorts. Moderately bullish bias for USD.
CAD Futures: Significant increase in non-commercial shorts (+7,966) while longs decline (-2,691). Institutions are clearly selling CAD.
📌 This reinforces the bullish bias on USD/CAD, with speculative positioning strongly in favor of the US Dollar.
Seasonality (August–September)
Historically, August tends to be neutral/slightly bearish for USD/CAD, but September shows a strong bullish pattern, with consistent positive averages over the last 10–20 years.
📌 This supports a continuation of the bullish trend in the coming weeks, especially towards the 1.40+ area.
Retail Sentiment
78% of retail traders are short on USD/CAD, with an average entry price at 1.3780.
Only 22% are positioned long.
📌 Classic contrarian signal: excessive retail bearishness increases the probability of further upside.
✅ Trading Outlook
The overall picture shows alignment across technicals, COT, seasonality, and sentiment. USD/CAD maintains a bullish bias:
Primary scenario: Extension towards 1.3950 and then 1.4050, a major weekly supply zone.
Alternative scenario: Controlled pullback to 1.3800–1.3750 before resuming higher.
Invalidation: Daily close below 1.3700 would open space towards 1.3550.
📌 Bias: Long USD/CAD towards 1.3950–1.4050.

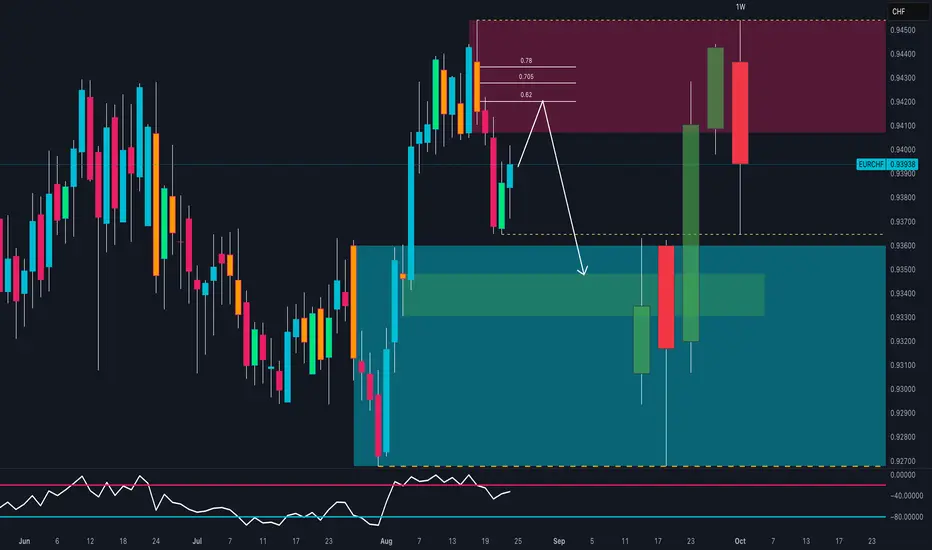
EUR/CHF: The Trap Is Set!EUR/CHF Full Analysis
1. Seasonality
EUR: Historically weak in August–September. The 20y and 15y datasets confirm a negative seasonal bias in September.
CHF: Stronger tendency in August–September, historically supported as a safe-haven currency, with September statistically positive.
👉 Seasonal bias: short EUR/CHF (weak EUR vs strong CHF).
2. Retail Sentiment
55% of retail traders are long EUR/CHF, while 45% are short.
👉 Slight long retail positioning = contrarian bearish signal.
3. COT Report (19 August 2025)
Euro: Non-commercial net long at 252k vs 133k short (+6.4k new longs, +3.1k new shorts). Still bullish momentum, but slowing down as commercials are selling.
CHF: Non-commercial net short (6k longs vs 33k shorts). Strong bearish imbalance, but commercials are long CHF (hedging), reinforcing CHF’s safe-haven status in case of risk-off correction.
👉 COT shows overweight Euro longs and heavy CHF shorts, raising risk of a future reversal in favor of CHF.
4. Technicals
Structure: Clear rejection from weekly supply zone 0.9435–0.9450 with a bearish engulfing.
Daily RSI cooling after strong impulse → room for further downside.
Possible pullback toward 0.9415–0.9425 (Fib 0.62–0.705) before continuation lower.
Technical targets: 0.9330–0.9315 (daily demand zone), extended to 0.9260.
Invalidation: Weekly close above 0.9450.
📌 Conclusion:
Seasonality, retail sentiment, and price action align for a bearish EUR/CHF bias. The COT highlights an overcrowded long Euro vs short CHF positioning, opening space for a structural rebound of the Swiss Franc. Technicals confirm: wait for a pullback to 0.9420 to short, targeting 0.9330/0.9260.
Gold (XAUUSD) – Weekly Outlook 25th - 30th Aug🚀 Hey Traders—happy new week! ✨
Powell’s Friday speech gave gold a fresh momentum push, but price remains trapped inside a wide Daily range. With no high-impact news on Monday, we’re likely looking at range-bound action until Tuesday’s USD data starts driving direction.
A few of you have asked me to do daily posts—truth is, I’m a swing trader both in markets and in life 😅 so I stick to weekly outlooks. That said, swings aren’t static. Plans adjust as micro-economic data, global politics, and of course the biggest catalysts—POTUS & the Fed—shift the narrative.. Lets dive down to the action plan :
🔸 Macro & News Context
This week is USD-driven with heavy catalysts:
Tue 26th → Core Durable Goods, CB Confidence
Thu 28th → Jobless Claims, GDP Price Index
Fri 29th → Core PCE (Fed’s key inflation gauge) + Waller speech
⚡ Mid-week (Wed) → low data → expect technical price action before volatility into Thu–Fri.
🔸 Weekly Structure
Trend: Bullish on HTF (above EMA21/EMA50)
Range: 3300–3350 = premium consolidation
Liquidity:
Buy-side → above 3350–3439
Sell-side → below 3260–3280
Key Zones
Supply: 3350–3439 (weekly wick supply)
Demand: 3320–3300, deeper 3260–3205
Upside Targets: 3520–3530 (1.272 Fibo), 3635–3650 (1.618 Fibo)
🔸 Scenarios
🟢 Bullish Case
Break & close above 3439 → upside expansion to 3520–3530.
Weak USD data (soft GDP / low PCE) = momentum fuel.
🔴 Bearish Case
Rejection at 3350–3439 + strong US data → pullback into 3300, deeper to 3260–3205.
🔸 Daily (D1) Bias
Price ~3372, ranging 3320–3439.
Support: 3320–3340 demand (line in sand for bulls).
Supply steps: 3380–3410 → 3439 → 3470–3485 → 3500.
Above 3500 = fib extensions 3520–3530, 3635–3650.
🔸 H4 Bias
Range: 3320 demand ↔ 3450 supply.
Break above 3450 → path to 3470–3500 / 3520–3540.
Break below 3320 → downside to 3300 → 3240.
🔸 H1 Intraday Map
Decision Zone: 3370–3330 FVG.
Primary Buy: 3340–3325 demand → targets 3370, 3395–3405.
Primary Sell: 3395–3405 supply → rejection back to 3340–3325.
Break of 3325 or 3405 → defines day momentum.
🎯 Conclusion
This week is range-to-breakout:
Above 3439 → bullish expansion into 3520–3530.
Below 3320 → deeper demand retest 3260–3240.
Until then → expect intraday liquidity sweeps between 3320–3439.
Patience > chasing. Wait for M15/M30 confirmations (BOS, inducement sweeps, FVG reclaims) inside these zones.
Disclaimer: For educational context only.

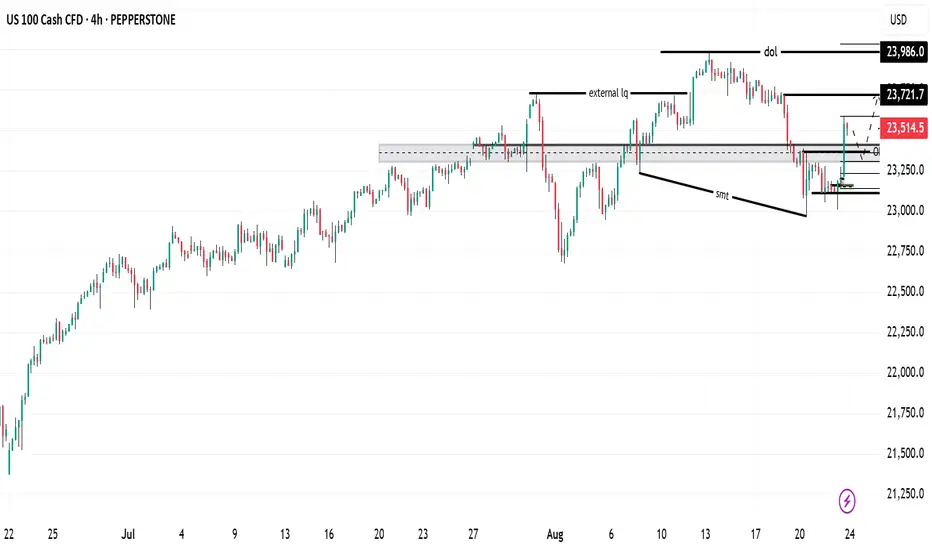
nas100 on fire📊 NASDAQ 100
The market has recently reacted from the weekly pd arrays (internal lq) now market will hunt buy sides liquidity (external lq) and bellow my expectition using a differnt concepts po3, weekly profile, pd arrays matrix ,weekly and daily bias... new weekly opening gap will be a good zone for buys oppotunities .... follow me to get analysis day by day
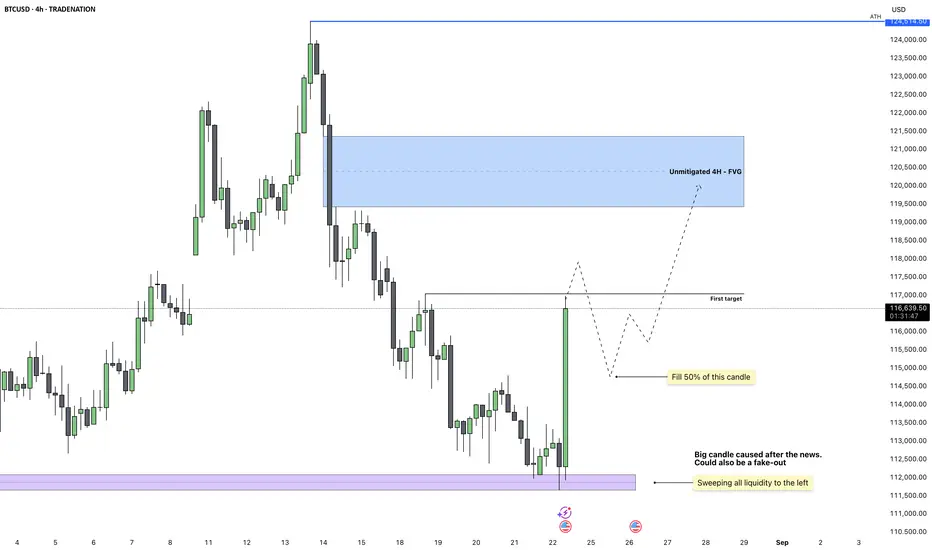
Bitcoin - A Deep Sweep Setting Up the Next ExpansionBitcoin just swept the monthly low of August as well as the previous day’s low. This was a clear liquidity grab that lined up with today’s bullish momentum in the market. The strong reaction from this zone shows that buyers were waiting for these liquidity levels to get cleared before stepping in.
Liquidity Sweep and Reaction
The sweep was significant because it cleared out resting sell-side liquidity to the left. This kind of move usually sets the stage for a reversal, and the large impulse candle confirms strong demand stepping in. While some might see this as just a reaction to external events, the technical picture supports continuation higher.
Immediate Target
The first target is sitting around 117,000. This level lines up with short-term inefficiencies and is a logical magnet for price in the coming sessions. I expect this liquidity pool to be swept before any meaningful retracement.
Retracement Expectation
After hitting the first target, I anticipate a move back down to fill around 50% of the large green impulse candle. Big candles like this often retrace partially before continuing their main direction. That retracement will provide a cleaner structure and a chance for re-entries on lower timeframes.
Higher-Timeframe Objective
Once the retracement plays out, the bigger objective sits higher at the unmitigated 4H fair value gap around 120,500. This area remains untouched and is likely to act as a price magnet as the market seeks balance.
Conclusion
The sweep of key lows combined with the strong impulsive move is a bullish development. I expect price to first tag 117,000, then retrace into the large candle before resuming higher towards the 4H FVG.
Disclosure: I am part of Trade Nation's Influencer program and receive a monthly fee for using their TradingView charts in my analysis.
___________________________________
Thanks for your support!
If you found this idea helpful or learned something new, drop a like 👍 and leave a comment, I’d love to hear your thoughts! 🚀
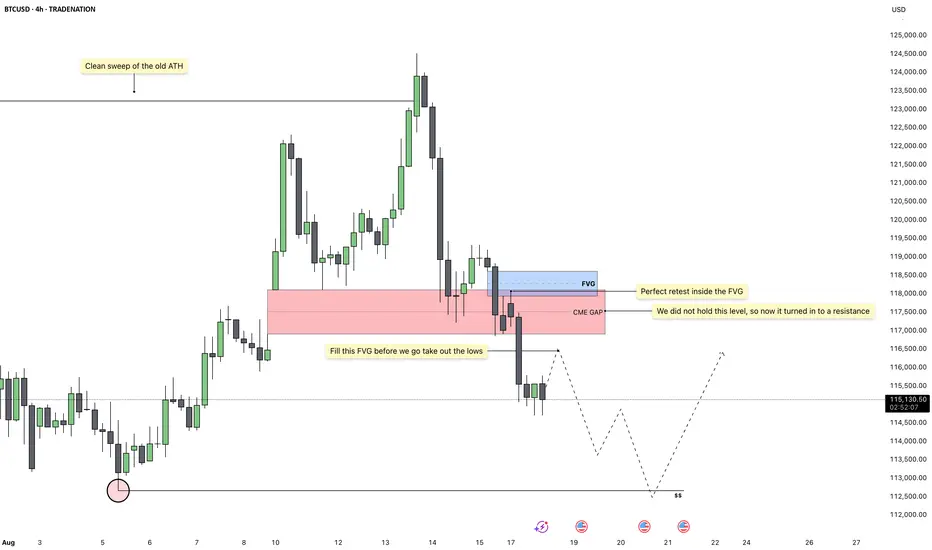
Bitcoin - Can the bulls defend this support?Introduction
After reaching its all-time high, Bitcoin has faced strong rejection, falling from $124.5k down to $113k with notable bearish volume behind the move. On this downward path, several four-hour bearish Fair Value Gaps (FVGs) were left open, signaling areas of inefficiency that the market may look to revisit. At present, Bitcoin is testing a critical support zone formed by overlapping daily and four-hour FVGs. This support level is of particular importance because holding it could provide the foundation for renewed bullish momentum and a potential recovery in price action.
Bullish scenario
For the bullish case to unfold, Bitcoin must successfully maintain support in the $111.2k to $112.7k range, which represents the current four-hour FVG. This zone serves as a pivotal point where buyers need to defend price in order to keep upward potential intact. If the market stabilizes here, the next logical target will be the four-hour bearish FVG just above. In order to confirm strength, Bitcoin would need to close a clear four-hour candle above this resistance, effectively flipping it into support. Should that occur, it opens the door for price to climb toward the $120k region, a level that would reintroduce confidence among bulls and suggest that the broader trend could still have room for continuation.
Bearish scenario
On the other hand, the bearish scenario becomes more likely if Bitcoin fails to defend the $111.2k to $112.7k four-hour FVG and instead flips this zone into resistance. While a breakdown below this area would be concerning, there is still the possibility of a short-term bounce. In such a case, price could retrace back upward toward the bearish four-hour FVG at $114.7k before facing another critical test. If Bitcoin rejects strongly from that zone and subsequently breaks below $111.2k, the market could experience further downside pressure, potentially setting up a deeper correction. This would reinforce the dominance of the ongoing downtrend that has followed the rejection at the all-time high.
Final thoughts
Bitcoin remains in a pronounced downtrend after its sweep of the previous all-time high, yet it currently sits at a strong support level that offers a chance for recovery. The market’s reaction to this support area will play a decisive role in determining whether a rebound toward $120k is achievable or whether a deeper decline is imminent. The four-hour FVG around $114.7k stands out as a key battleground between bulls and bears. If buyers can reclaim and hold this level, momentum could shift back in their favor, but if sellers defend it and force price lower, the bearish trend is likely to persist.
-------------------------
Disclosure: I am part of Trade Nation's Influencer program and receive a monthly fee for using their TradingView charts in my analysis.
Thanks for your support. If you enjoyed this analysis, make sure to follow me so you don't miss the next one. And if you found it helpful, feel free to drop a like 👍 and leave a comment 💬, I’d love to hear your thoughts!

BTC CME / FVG levelsHi,
Here are some 4 hour FVG / CME levels I found on BTC, just to have an overview over the levels in case of bull, in case of bear, etc..
Price don't have to respect these levels, but usually does, in accordance with ICT market maker / smart money algorithm theory.
Have a great day, and good luck trading!

ETH, BTC, DXY & USDT.D cross market breakdownEverything explained in the video. Please let me know if there was anything I may have missed!

eurgbp fvg to fvg buyEURGBP pulled back to its FVG after breaking the swing high at 0.8650. From here, it will rise to the FVG above.

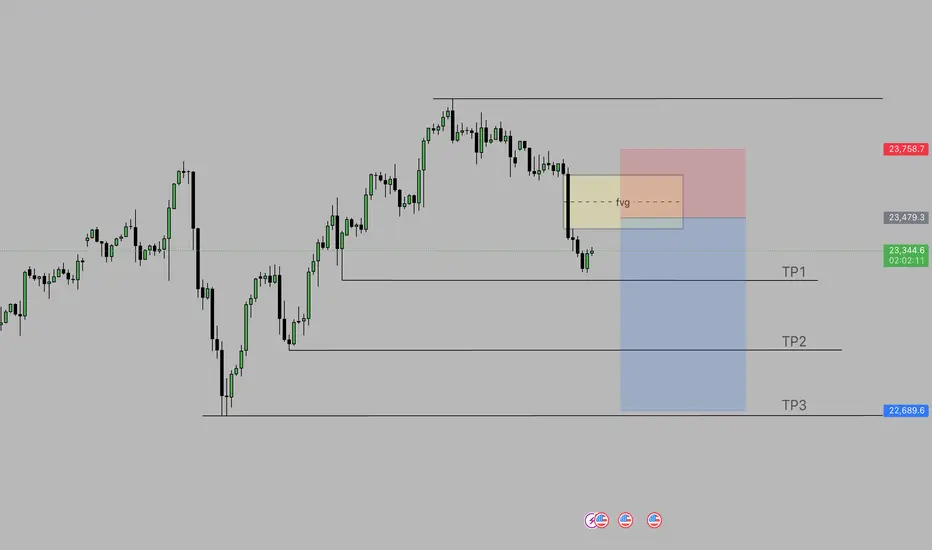
US100 SELLAfter us100 rises to its fvg in 4h, it will take the gap here and fall back to its targets below.
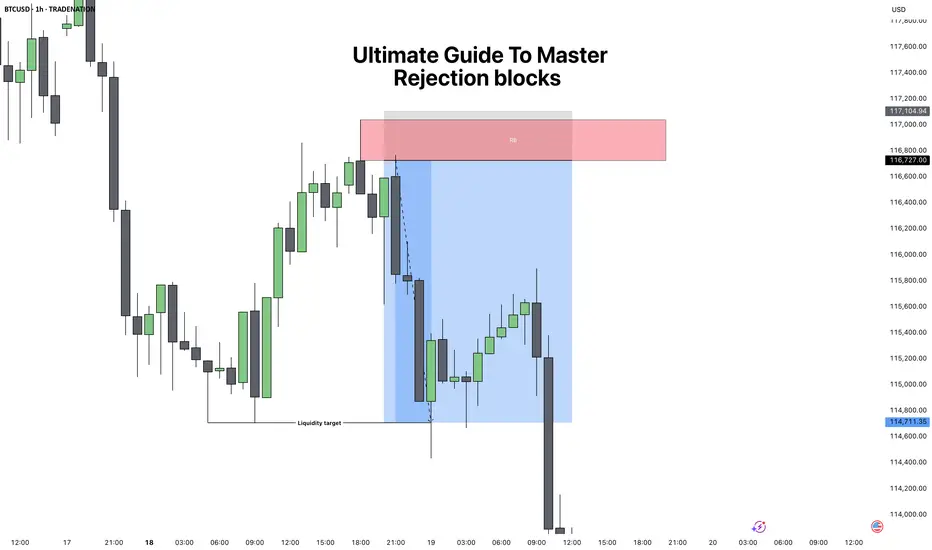
Ultimate Guide to Master: Rejection BlocksRejection Blocks (ICT Concept) – Complete Guide
1. What is a Rejection Block?
A rejection block is a special type of price level that forms when the market attempts to push through but gets denied and reverses. Unlike a traditional order block, which represents accumulation or distribution by institutions, a rejection block shows a failed attempt to continue in one direction. It is a footprint of rejection and often becomes a strong reaction zone in the future.
There are two types:
Bullish Rejection Block:
Forms from a bearish candle whose low is taken out, but price fails to continue lower and closes back above. The low of that candle becomes the key level.
Bearish Rejection Block:
Forms from a bullish candle whose high is breached, but price fails to continue higher and closes back inside. The high of that candle becomes the key level.
These levels can act as hidden support or resistance and often serve as high-probability entry points when combined with market structure.
2. How to Spot a Valid Rejection Block
To correctly identify rejection blocks, you need to look for:
1. Clear Attempt Beyond a Candle
Price must trade beyond the high or low of a prior candle, suggesting continuation.
2. Failure and Return
After breaching the level, price fails and closes back inside the candle’s body.
3. Liquidity Context
A rejection block is more powerful if the wick that caused it swept liquidity (equal highs/lows or a previous key level).
4. Higher Timeframe Confluence
The best rejection blocks line up with higher timeframe bias (for example, spotting a bearish rejection block inside a 4H premium zone during a downtrend).
3. How to Trade Rejection Blocks
Trading them involves waiting for price to come back to the rejection block level and using it as an entry or reaction zone.
Bullish Setup:
When price trades below a bearish candle, fails, and closes higher, mark the low of that candle. On a retracement, price often retests that level as support.
Bearish Setup:
When price trades above a bullish candle, fails, and closes lower, mark the high of that candle. On a retracement, price often retests that level as resistance.
Entry Technique:
You can enter "blindly" when you're understanding the confluences. But to begin with do this Instead, when price returns to the rejection block, drop to a lower timeframe and look for confirmation such as:
* Fair Value Gap (FVG) entries.
* Market Structure Shift (MSS).
* Liquidity sweeps into the level.
Stop Loss Placement:
Always place stops beyond the rejection candle itself (above the high for bearish RB, below the low for bullish RB).
4. Practical Examples and Market Context
Rejection blocks work best when they appear in the following situations:
Liquidity Sweeps:
After equal highs or equal lows are taken out, a rejection block often marks the failure point.
Inside Premium/Discount Zones:
In a bearish bias, look for bearish RBs in premium pricing. In a bullish bias, look for bullish RBs in discount pricing.
During Consolidation Breakouts:
If the market fakes a breakout and closes back inside, the rejection block often becomes the level to fade the fake move.
For example, if BTC takes out a prior daily high, prints a rejection block, and then closes back inside, the odds of reversal are high, especially if price was already in premium territory.
5. Combining Rejection Blocks with ICT Concepts
To increase accuracy, always combine RBs with ICT’s other tools:
Fair Value Gaps:
If a rejection block aligns with an FVG, it adds strength to the level.
Market Structure Shifts:
A rejection block is more powerful if followed by displacement and an MSS.
CISD Pattern:
A rejection block often forms right after the “Stop Hunt” part of the CISD sequence, serving as a clean entry.
Liquidity Pools:
Look for RBs near equal highs/lows, old highs/lows, or session liquidity (London/New York).
Conclusion
Rejection blocks are subtle but highly effective levels that show where the market tried to extend but failed, leaving behind a hidden form of support or resistance. By themselves they are useful, but when combined with ICT concepts like liquidity sweeps, MSS, and FVGs, they become powerful entry tools. The key is to always wait for price to return and confirm the level before entering, and to only trade them in alignment with higher timeframe bias.
Disclosure: I am part of Trade Nation's Influencer program and receive a monthly fee for using their TradingView charts in my analysis.
___________________________________
Thanks for your support!
If you found this idea helpful or learned something new, drop a like 👍 and leave a comment, I’d love to hear your thoughts! 🚀
EURUSD - Will the parallel channel hold?Introduction
The EURUSD is currently trading within a well-defined bullish parallel channel. While this channel suggests an overall upward trajectory, there is an important imbalance in how price has interacted with its boundaries. The upper side of the channel has relatively few touchpoints compared to the lower side, which has already been tested multiple times. This creates an interesting dynamic where both bullish and bearish scenarios remain in play. The pair is also trading within two significant 4-hour fair value gaps (FVGs), and the critical question now is which side will give way first, determining the next directional move.
The Parallel Channel
Within this parallel channel, price action has been leaning more heavily toward the downside, as shown by the fact that the lower boundary has been tested four times already. The upper boundary, however, has only registered a single touch, making it less validated. This imbalance implies that there is notable pressure on the downside, but at the same time, the presence of a bullish 4-hour fair value gap near the lower boundary cannot be ignored. This gap provides a potential level of support that could initiate a reversal back toward the upper side of the channel.
Potential Bullish Bounce from Support
The alignment of the lower trendline of the channel with the 4-hour bullish fair value gap creates a strong technical confluence. This support zone, located around the 1.166 – 1.165 area, could act as a springboard for buyers. If price respects this level, a bullish bounce could occur, pushing EURUSD back toward the upper region of the channel. In this scenario, the market would likely target the remaining inefficiencies left by the bearish 1-hour and 4-hour fair value gaps above, potentially leading to a liquidity grab in that zone.
Bearish Breakdown Scenario
On the other hand, if EURUSD fails to hold the support at the bullish 4-hour FVG, a bearish breakdown becomes increasingly likely. In that case, both the channel structure and the previously supportive FVG would flip into resistance, reinforcing bearish momentum. Should this play out, the pair could decline toward the next major 4-hour FVG around the 1.156 level in the near future. This would represent a meaningful breakdown of the current bullish structure, opening the door for further downside.
Conclusion
The EURUSD sits at a decisive point within its bullish channel. The key lies in whether the support confluence of the 4-hour bullish FVG and the lower trendline will hold. If it does, the pair has room to climb higher and fill inefficiencies above. If it breaks, however, a move down toward 1.156 seems likely. Traders should closely monitor these zones, as the resolution of this consolidation will determine whether EURUSD extends its bullish momentum or shifts into a deeper retracement.
-------------------------
Disclosure: I am part of Trade Nation's Influencer program and receive a monthly fee for using their TradingView charts in my analysis.
Thanks for your support. If you enjoyed this analysis, make sure to follow me so you don't miss the next one. And if you found it helpful, feel free to drop a like 👍 and leave a comment 💬, I’d love to hear your thoughts!

Bitcoin - Bears in Control, Lows AheadBitcoin has recently completed a clean sweep of the previous all time high, which has now given us strong bearish confirmation signals. After the sweep, the market rejected higher levels and failed to sustain bullish momentum, showing clear signs of distribution at the top. This shift in behavior suggests that buyers have lost control and sellers are now taking over.
Fair Value Gap Setup
Currently, price is sitting just below a fair value gap, which remains unfilled. These imbalances often attract price back before continuing in the prevailing direction, and in this case, that direction is down. A small retracement into the fair value gap above would be the ideal setup for a continuation lower.
Bearish Confirmation
The rejection after sweeping the highs and the subsequent breakdown beneath key support levels has created a bearish structure on the higher timeframe. The failed hold inside the fair value gap turned it into resistance, strengthening the case for lower prices. Each retest has been met with selling pressure, confirming that liquidity is now being delivered to the downside.
Liquidity Targets
Once the fair value gap above is filled, the next logical draw on liquidity sits below the current range. That means the lows are now exposed, and the cleanest target to expect price to reach is at 112k. The path of least resistance remains to the downside, as uncollected sell-side liquidity continues to build up beneath the market.
Trading Outlook
As long as Bitcoin continues to respect the newly formed resistance from the fair value gap, the bearish outlook remains intact. A retracement into the gap would likely offer the best entry for shorts, with the expectation that price will then seek out the lows. Only a convincing reclaim above the imbalance would threaten this bearish scenario.
Conclusion
The clean sweep of the old all time high has shifted market sentiment, and the subsequent bearish confirmations support the idea that the next major move is lower. I expect a slight retrace into the fair value gap before price makes its way down to the 112k liquidity pool.
Disclosure: I am part of Trade Nation's Influencer program and receive a monthly fee for using their TradingView charts in my analysis.
___________________________________
Thanks for your support!
If you found this idea helpful or learned something new, drop a like 👍 and leave a comment, I’d love to hear your thoughts! 🚀
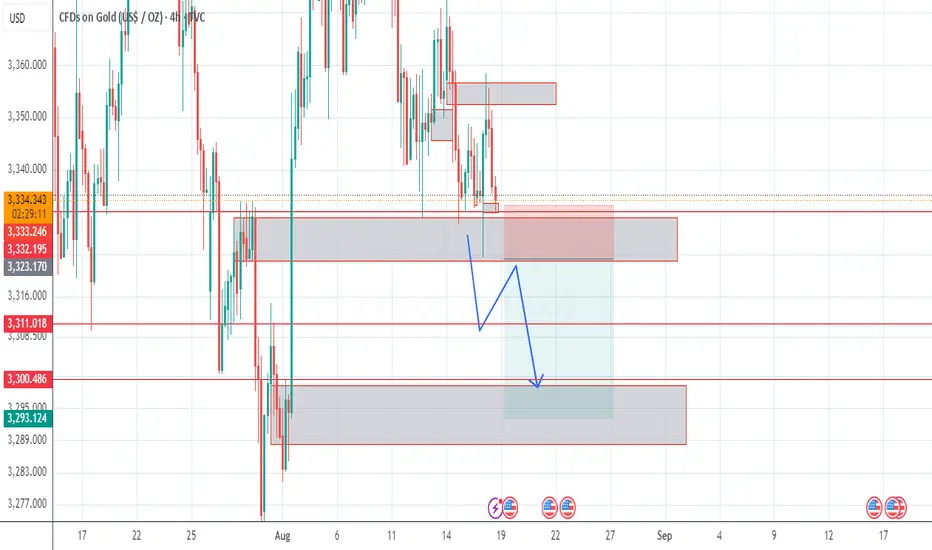
GOLD SHORT SETUP ON H4 TFThis is an ICT based setup. Will be waiting for price to break the H4 breaker block and retest it then we can enter.
ENTRY: 3,322
TP1: 3,311
TP2: 3,300
SL: 3,329
Fueled to go north OANDA:XAUUSD Everyone who day trade based on my experience I could see that the market order flow is shifted to bullish order flow and the market hustled enough stop losses below from the traders who entered buy trades early. Use the supply zone conversion/transition to demand zones easily and take trades to North till the next liquidity pool.
