EURUSD sellEur vs Us dollar we expecting a pull back to Daily Resistance trendline and as we are putting our idea EUR vs US dollar having a bull run over to its trendline we are expecting a rejection from there and a Drop to its Support under lying Suppot level remember its a Bearish trend and following its technical data
Ictconcepts

WEEKLY FOREX FORECAST OCT. 14 - 18th: GOLD | XAUUSD Gold is still bullish, and BUYS are still the best bet. There is the potential for an overdue retracement, but I suspect it will be limited. The formation of a +FVG will support higher prices, and we may get that on Monday's close.
Patience....
Check the comments section below for updates regarding this analysis throughout the week.
Enjoy!
May profits be upon you.
Leave any questions or comments in the comment section.
I appreciate any feedback from my viewers!
Like and/or subscribe if you want more accurate analysis.
Thank you so much!
Disclaimer:
I do not provide personal investment advice and I am not a qualified licensed investment advisor.
All information found here, including any ideas, opinions, views, predictions, forecasts, commentaries, suggestions, expressed or implied herein, are for informational, entertainment or educational purposes only and should not be construed as personal investment advice. While the information provided is believed to be accurate, it may include errors or inaccuracies.
I will not and cannot be held liable for any actions you take as a result of anything you read here.
Conduct your own due diligence, or consult a licensed financial advisor or broker before making any and all investment decisions. Any investments, trades, speculations, or decisions made on the basis of any information found on this channel, expressed or implied herein, are committed at your own risk, financial or otherwise.

GOLD is Setting Up For LONGS! Prepare to BUY!Price is pulling back to the Daily +FVG, which is nested in the Weekly +FVG, which is intersected by the Swing High. Three strong confluences for a high probability LONG.
Be patient, look for price to contact the POI, and then let your valid buy setup form.
Let the rest unfold.
Enjoy!
May profits be upon you.
Leave any questions or comments in the comment section.
I appreciate any feedback from my viewers!
Like and/or subscribe if you want more accurate analysis.
Thank you so much!
Disclaimer:
I do not provide personal investment advice and I am not a qualified licensed investment advisor.
All information found here, including any ideas, opinions, views, predictions, forecasts, commentaries, suggestions, expressed or implied herein, are for informational, entertainment or educational purposes only and should not be construed as personal investment advice. While the information provided is believed to be accurate, it may include errors or inaccuracies.
I will not and cannot be held liable for any actions you take as a result of anything you read here.
Conduct your own due diligence, or consult a licensed financial advisor or broker before making any and all investment decisions. Any investments, trades, speculations, or decisions made on the basis of any information found on this channel, expressed or implied herein, are committed at your own risk, financial or otherwise.

Trading GBPUSD | Judas Swing Strategy 15/10/2024Last week proved challenging for the Judas Swing strategy, with three consecutive losses and no wins, which heightened our anticipation for this week. Will we be able to break this losing streak? We'll soon find out. We typically arrive at our trading desks five minutes before the session starts to delineate our zones and settle into the trading rhythm.
After delineating our zones, the next step is to wait for a sweep of a high or low of the trading zone, which will assist us in establishing our bias for the trading session. Forty-five minutes later, price swept the liquidity at the high, indicating that we should look for selling opportunities during this trading session.
A few minutes after the high was swept, we observed a Break of Structure (BOS) on the sell side, which was encouraging as we avoid entering trades without analysis, even with a sell bias established for the session. Upon identifying the BOS, the next step is to find a Fair Value Gap (FVG) within the price leg that broke structure.
The final step in the entry checklist is to wait for price to pull back into the Fair Value Gap (FVG) and to execute the trade only after the candle that enters the FVG has closed. Shortly after, a candle entered the FVG, indicating that we could execute our trade following the close of the candle.
It's crucial to understand that by risking only 1% of our trading account for a potential 2% return, we minimize emotional attachment to the trades since we're only risking what we can afford to lose, and we stand to gain more than we risk. After executing the trade, we experienced a significant drawdown, which is a critical point for those who risk more than they can afford to lose.
After a patient wait, the trade has turned around and begun to move in our favor, which is thrilling. However, we must still keep our composure as the objective has not yet been achieved
According to our data, we can anticipate being in a position for an average of 11 hours, so the duration of this trade meeting our objective is not a concern; we simply need to remain patient for it to occur. After 15 hours and 20 minutes, our patience was rewarded when our take profit (TP) target was reached, resulting in a 2% gain on a trade where we risked 1%.

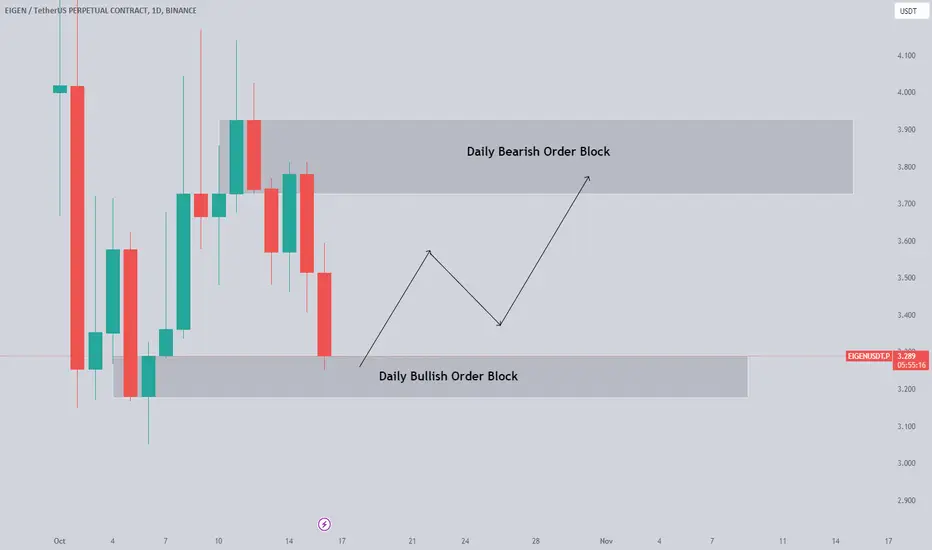
WILL EIGEN REACH $4 BEFORE END OF OCTOBER? The probability of reaching $4 is very possible. Here are my confluences:
- Weekly Low at $3.29 which had liquidity resting just got raided.
- Q4 has seasonally been great for Cryptocurrencies over the years so I expect a great end to Q4 for EIGENUSDT.
- Price is currently testing the Daily Bullish Order Block which is within the Range Discount Array.
- There is more Liquidity resting above current price rather than below current market price.
- Targeting price to reach $3.72 , $3.91 and $4 for this Long entry.
Trading is risky so always use proper risk management. Happy Trading Pals
Nasdaq Sell Idea Looking for a potential sell with a shift in market structure on the lower 1 minute timeframe.

I'm going short on AUDCAD1-MSS was formed on 4h
2-Market came back straight to the 0.78 Fib Level created a new internal MSS.
3-Leaving behind a BB, an OB and a FVG.
4-I could wait for extra evidence on 15 min but...

BTC long setup occurred after leaving 1D Fair Value Gap (FVG)BTC created a bullish FVG on daily chart and tested it on the weekend. And now it wants to go higher. There is another FVG on the 4 hour chart and my setup is like on the chart. I never enter a trade which has a potential less than 2R so my entry has been adjusted to create 2R profit. I am aware that it can go there without filling my limit order and I am totally OK with that.
BINANCE:BTCUSDT.P


Bitcoin viewcrypto always pull some goofy moves to us, and we either open our eyes to these candles or our a$ to the market :skull:
I don't post much cuz i'm research on my new model, hope this cup and handle(:skull) model can help you guys form your bias about btcusd(t)
peace

Impact On The ScreenWhat type of feel do you get from this, does it seem like this week had low impact moves and was typa slow. Imagen this was on a 1min Chart, what would be our next move, timing and positioning, we would think that because it tapped into the gap on the left and is now showing some potential bearish moves, the equal lows might serve as liquidity and have us ram through them as we sell. Furthermore realizing that ohh we tapped into a FVG and this is actually still on a buy mood, would mess up everything, we still have some learning to do.

Journal Journal Journal!The reason why we are still not rich is because we are driven but not serious, we are passionate but not focused. Knowing what you want and knowing what the market does are two different things, have an intention, My side when I don't know what to make of the chart, I fold my arms and open my music pad. For this chart I fold my arms and wait for the two points Identified to be tapped

DXY analysis based on ICT concepts and candle scienceHello, greatest community Since this is my first post, I sincerely hope you find it useful.
I am going to start with a top-down analysis.
First, based on the monthly chart.
Currently, we are in the monthly SIBI, a reversal area.
What are we supposed to look for next?
A drop in momentum to the annual bisi target during the following months
Weekly Chart
It's Friday, the last day of the week. What can I see in this area right now?
1. It looks like we are about to create a weekly fair value gap, which we will trade from the following week in order to reach the next weekly SIBI shown on the chart.
2. On the other hand, we might make a BAG and search for the entry on the daily chart.
NB: I will post more information this weekend if I find someone who is interested.

Oil sellWe can see oil have had a rally upwards now as we can see it has reached over its H4 resistance level we will wait for price action candle and then we will ne shorting oil from our Resistance level to support level

LOOKING FOWARD FOR THIS M15 SETUP 1.Price already enter a very strong demand zone I think here sellers will find all the buyers they have been looking for (LOL) remember if you are selling 100 iPhones you will need 100 buyers it's that simple.
2. Price have wiped out lot of liquidity, so why will price keep going down to sweep that low in H4 I think there's no need for that therefore from this point we should see the start of a complex pullback to a supply zone in H4.
3. This figure you see here in M15 that will be my confirmation to start buying, Fibonacci is showing our M15 trading range (last high, last low) if this doesn't happen it means is going deeper into our H4 demand zone, that's why I always opt for confirmation in lower time frame before executing any orders.
WILL KEEP YOU GUYS UPDATED!!

Trading EURUSD | Judas Swing Strategy 08/10/2024Traders become enthusiastic with the start of a new week, as it presents an opportunity to capitalize on the market's offerings, and we were hopeful of entering into profitable trades this week. We arrived at our desks at 08:25 EST, energized and prepared to trade. With five minutes remaining before our trading session begins, we prepared by delineating our trading zones.
After defining our zones, we wait for price to sweep the high or low of the trading zone, as this will help us establish a bias for the trading session. After five minutes, a sweep of the trading zone's low occurred, indicating that we should look for buying opportunities during this trading session.
Shortly after the low sweep, we observed a Break of Structure (BOS) to the buy side, leaving behind a Fair Value Gap (FVG). This means that all that remains before we can initiate a trade is to wait for the price to retrace back into the FVG.
Once the next candle enters the Fair Value Gap (FVG), we can initiate the trade after the candle closes. We should verify that the entry price and low of the price leg that broke structure is at least 10 pips. If it's not, we'll set our stop loss at 10 pips and place our Take Profit (TP) at twice that amount.
To minimize emotional attachment to trades, we risk only 1% of our trading account and target a return of twice that amount if the trade moves in our favor. After a short while, we reviewed our position and discovered we were in a drawdown, which was acceptable to us since we had only risked what we were prepared to lose.
Subsequently, we received an alert indicating that our position had reached our stop loss. It's crucial to understand that incurring losses is a normal part of trading, particularly when you have data supporting your strategy's long-term profitability. The best course of action is to learn from these losses to improve your trading skills.

Expansion ArriviedThe expansion phase we have been waiting for has arrived. Now we are going to see if the left highs broken will be just left without influencing the huge FVG on the right, or if they will at some point they will be $ For now, this is massively BULLISH "Remember trend is our...?"

Buying XAUUSD to take out Buyside LiquidityIn a buy trade on the 5 mins timeframe. Looking to take out equal highs from the Asian range.

Fair Value GapThe liquidity resting on the lows gave the FVG power, this is what i believe ICT calls the liquidity magnet.But the high that we have as a target will then be where our eyes be.

WEEKLY FOREX FORECAST SEPT 7-11th: GOLD | XAUUSDGOLD | XAUUSD is in consolidation currently. I am waiting for it to touch down at the Weekly +FVG and move higher. I'm interested more in long setups versus shorts. Patience usually pays, so I wait and watch for valid setups to form this week.
Check the comments section below for updates regarding this analysis throughout the week.
Enjoy!
May profits be upon you.
Leave any questions or comments in the comment section.
I appreciate any feedback from my viewers!
Like and/or subscribe if you want more accurate analysis.
Thank you so much!
Disclaimer:
I do not provide personal investment advice and I am not a qualified licensed investment advisor.
All information found here, including any ideas, opinions, views, predictions, forecasts, commentaries, suggestions, expressed or implied herein, are for informational, entertainment or educational purposes only and should not be construed as personal investment advice. While the information provided is believed to be accurate, it may include errors or inaccuracies.
I will not and cannot be held liable for any actions you take as a result of anything you read here.
Conduct your own due diligence, or consult a licensed financial advisor or broker before making any and all investment decisions. Any investments, trades, speculations, or decisions made on the basis of any information found on this channel, expressed or implied herein, are committed at your own risk, financial or otherwise.

US WTI CRUDE OIL... Looking to BUY IT!US OIL
Price has pulled back into the Weekly and Daily +FVG. There is a good chance 73-72.00 will hold support, sending prices higher.
My eyes on the lookout for valid buy setups.
Check the comments section below for updates regarding this analysis throughout the week.
Enjoy!
May profits be upon you.
Leave any questions or comments in the comment section.
I appreciate any feedback from my viewers!
Like and/or subscribe if you want more accurate analysis.
Thank you so much!
Disclaimer:
I do not provide personal investment advice and I am not a qualified licensed investment advisor.
All information found here, including any ideas, opinions, views, predictions, forecasts, commentaries, suggestions, expressed or implied herein, are for informational, entertainment or educational purposes only and should not be construed as personal investment advice. While the information provided is believed to be accurate, it may include errors or inaccuracies.
I will not and cannot be held liable for any actions you take as a result of anything you read here.
Conduct your own due diligence, or consult a licensed financial advisor or broker before making any and all investment decisions. Any investments, trades, speculations, or decisions made on the basis of any information found on this channel, expressed or implied herein, are committed at your own risk, financial or otherwise.

$NVDA Short OpportunitiyReasons I am bearish on NASDAQ:NVDA
4-hour trendline resistance
4-hour bearish order block
Entry: 131.98
Take Profit: 100.27 (scale profits on the way down)
Stop Loss: 140.80

Bitcoin’s Next Move: Bullish Momentum Building Toward 67,000 USDThe price has reacted to a higher-timeframe Order Block after completing a PO3 cycle, and has also completed an MMSM cycle. Currently, it's forming an MMBM. The target is set for prices above 67,000 USD.
