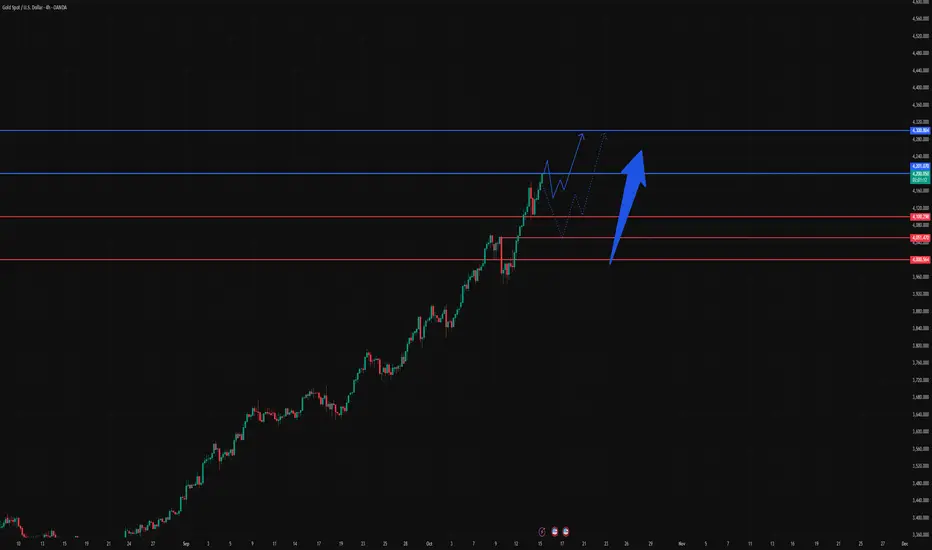
All Time High in the crosshair...again1. Weekly Lows hit;
2. Repricing below Weekly Open and Monthly Open;
3. Large Displacement on the upside confirming reversal;
4. Monday's high, Daily FVG and ultimately ATH relative equal highs in the crosshair for the upcoming days/weeks (that is bullish bias until proven otherwise);
Ictconcepts

Gold Bulls in Control — Eyes on $4,200 Breakout📰 Key Fundamental Drivers
Gold remains elevated above $4,100/oz, consolidating after recent surges.
Safe-haven demand is strong, supported by persistent U.S.-China tensions and global economic uncertainty.
Market expectations for Fed cuts remain robust, with ~99% chance priced in for October and ~94% for December.
Institutional flows (ETF & central banks) continue to add structural support.
Some caution from Fed officials about inflation and pacing of cuts could moderate upside in the near term.
📈 Technical & Price Structure
Support zones to watch: ~$4,100 → ~$4,050 → ~$4,000
Resistance / upside targets: $4,200 → $4,300 → $4,400+
Gold is in a strong uptrend, but short-term momentum is overextended. A pullback or consolidation is healthy and expected.
If price holds above support, the upside bias remains intact. A break below $4,000 would be an early warning.
🎯 Bias & Trade Strategy
Bias: Bullish overall, with caution in the short term.
Trade ideas:
Buy on pullbacks into support zones (e.g. $4,050–$4,100) with tight stops.
Breakout longs if price decisively clears $4,200.
Scalp / reaction shorts near resistance zones if rejection patterns appear.
Pay attention to upcoming U.S. data, Fed commentary, and any sudden USD strength as risk factors.
⚠️ Risk Note
Risk only 1–2% per trade
Confirm setups with volume/candle patterns
Avoid over-leveraging — gold volatility remains high
📌 For educational purposes only – Trade Smart. Athens
Gold Next Week levels📊 GOLD (XAUUSD) Price Update
Looking at the current price action, Gold is showing bullish momentum, but we’re now approaching two major resistance zones around 4055 and 4029. ⚠️
💡 Trading Plan for GOLD:
✅ If price holds above 4000, and based on the CBDR range, we could see a push toward 4200 this week.
❌ But if price breaks below 3976 and sustains, lower levels may open up — turning this into a bearish week.
📈 I’m personally bullish on Gold for now, and will be trading within the dealing range and CBDR zones for confirmation.
What’s your take? 👇
Drop your thoughts in the comments — let’s see how the market plays out! ⚡

us100 turtle soupUS100 has received good liquidity on the hourly chart. If it becomes clear that it's a turtle soup at the opening, it might make sense to buy as I've shown on the chart.

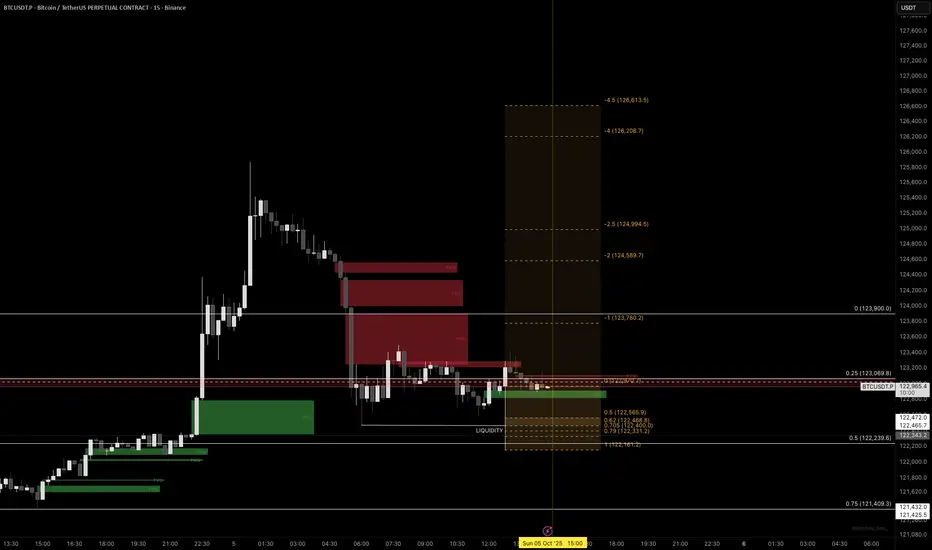
BTC LEVEL FOR UPCOMING WEEKLooking at Bitcoin’s price action, a sustained breakout above 126,000 could pave the way toward the 120,000 region in the coming week. Conversely, a sustained breakdown below 110,000 would likely expose the 100,000 level as the next area of interest. The key question remains: where will the market makers steer the price next?
The broader trend continues to lean bearish, though a partial liquidation candle fill of at least 50% may be required before a meaningful reversal to the upside can materialize.

BTC USD reversal BTC showing sign of reversal entry TS on a higher time frame , but and wil be a risky trade so entering on a lower quantity

Gold reversal on Higher time frame with TS GOLD showing sign of reversal from a key level above 0.5 + displacement + Mss on a Higher time frame on a key level of 0.5 weekly dealing range. Let's see how the price deliver
BTC Upside target move possible for monday closeLook for a buy position in BTCUSD from 0.5 level or 122565 level after 3 PM EST New York time
TP-1 123,780
TP-2 124,589
TP-3 126 208
THIS IS NOT A TRADE ADVISE. JUST FOR LEARNING PURPOSES
Future of #GOLD #XAUUSDSurprises from #Gold #Levels and #Positional #Targets.
Based on Analysis from yearly chart and #Fibonocci retracement and #extension
& Based on Elliot wave theory, Gold didn't give a retracement at 1.618 levels, which means, Gold broke and holding above 2950., which means the next possible stop is at 2.618 Fib extension and #elliot wave #analysis 3rd wave. Until it reaches this levels the momentum will continue and will reach quickly !
So the ultimate possible target will be #4617.
The Intermediate monthly resistances will be 4041 / 4277 / 4617.
Riding the 3rd wave, which is an Impulse wave will give quick positional targets.
Need not believe this analysis blindly. Do your own analysis and wait and watch the wonders.
Analysis shared for Educational purpose only. Do your own analysis, to be successful on a longer run !!!
#technical #analysis #wonders. There is no holy grail.

eurusd ict short setupIt looks like it will drop to 1,163 after eurUSD withdraws from its 4-hour fvg

October 05, Forex Outlook: Key Moves to Watch This Week!Welcome back, traders!
In today’s video, we’ll be conducting a Forex Weekly Outlook, analyzing multiple currency pairs from a top-down perspective—starting from the higher timeframes and working our way down to the lower timeframes.
Our focus will be on identifying high-probability price action scenarios using clear market structure, institutional order flow, and key confirmation levels. This detailed breakdown is designed to give you a strategic edge and help you navigate this week’s trading opportunities with confidence.
📊 What to Expect in This Video:
1. Higher timeframe trend analysis
2. Key zones of interest and potential setups
3. High-precision confirmations on lower timeframes
4. Institutional insight into where price is likely to go next
Stay tuned, take notes, and be sure to like, comment, and subscribe so you don’t miss future trading insights!
Have a great week ahead, God bless you!
The Architect 🏛️📉

EURCHF Bullish Wait for a bullish confirmation around the FVG zone (0.9335–0.9340) or the OB This could include:
A bullish candle formation like a bullish engulfing candle or a pin bar.
A break of structure: Look for a shift from lower lows and lower highs to higher highs and higher lows, which signals the market is starting to form an uptrend.
Order block confirmation: If the price moves into the yellow order block (OB) and reacts with bullish price action, that can be another signal to go long.

Bearish Movement Coming UpPotential move to the downside, waiting for price to make it up to at least 50% of the operative range, aligning with an Bearish OB.

Trading GBPUSD EURUSD | Judas Swing Strategy 29/09/2025This week, the Judas Swing strategy delivered another set of textbook lessons on patience, execution, and discipline. We had two clear setups unfold on FX:GBPUSD and FX:EURUSD and both gave us valuable insight into how the market manipulates liquidity before revealing its true direction.
On Monday FX:GBPUSD initially consolidated during the Judas Swing period, giving us the perfect framework to anticipate manipulation. As the session started, we saw liquidity taken above the high of the Judas Swing zone.
From there, we immediately shifted our focus to potential selling opportunities. Once structure broke to the downside, all eyes were on the retrace into the imbalance left behind. We knew from experience that patience is key here, sometimes price runs away without giving the pullback, and forcing an entry in those situations usually leads to regret.
This time, we got the perfect retrace. Once price tapped back into the FVG and the candle closed, our short was executed with a clean 1% risk. The market briefly hovered near our entry, but the setup held strong. Soon after price dropped decisively, reaching our target and securing a solid 2% gain.
On Tuesday FX:EURUSD gave us a slightly different picture but the same Judas Swing principles applied. Price first ran the zone lows, grabbing liquidity before reversing sharply. Once we spotted that break of structure to the upside, our game plan was straightforward: wait for the retrace into imbalance, and execute.
The market made it easy this time, with zero to no drawdown, price quickly reversed in our favor, running straight to our target for another +2R trade.
Both FX:GBPUSD and FX:EURUSD reminded us why the Judas Swing strategy works, the markets lure traders into chasing breakouts before reversing into the true move of the day. By waiting for the sweep, confirmation, and retrace, we put ourselves on the right side of the move with defined risk. Two trades, two wins, and another week of staying disciplined to the plan. Consistency doesn’t come from predicting every market move, it comes from following a strategy that stacks the odds in your favor.

$BTC BULL RUN RALLY & Showing a WOLF PATTERN 2025Road to Bull Run 2025, price Growing upward movement starting at $108K — $115K — $122K — 128K — $136K Who Entry at $111K and using $100K stoploss.
Bitcoin trades near $116,200, rebounding from $109,000. A close above $117,500 may boost buying, while rejection could trigger profit-taking. Key support is at $113,000. Traders are anticipating a 99% chance of a 25 basis points rate cut at the next Federal Open Market Committee meeting, which is viewed as favorable for Bitcoin. Bitcoin surged past $116,000, rising nearly 3% in a single day, following the U.S. government shutdown.
Key facts: Bitcoin trades near $116,200, rebounding from $109,000. A close above $117,500 may boost buying, while rejection could trigger profit-taking. Key support is at $113,000.
#Write2Earn #BinanceSquareFamily #Binance #BTC☀ #SUBROOFFICIAL
Disclaimer: This article is for informational purposes only and does not constitute financial advice. Always conduct your own research before making any investment decisions. Digital asset prices are subject to high market risk and price volatility. The value of your investment may go down or up, and you may not get back the amount invested. You are solely responsible for your investment decisions and Binance is not available for any losses you may incur. Past performance is not a reliable predictor of future performance. You should only invest in products you are familiar with and where you understand the risks. You should carefully consider your investment experience, financial situation, investment objectives and risk tolerance and consult an independent financial adviser prior to making any investment.

September 28, Forex Outlook: What Can Traders Expect This Week?Welcome back, traders!
In today’s video, we’ll be conducting a Forex Weekly Outlook, analyzing multiple currency pairs from a top-down perspective—starting from the higher timeframes and working our way down to the lower timeframes.
Our focus will be on identifying high-probability price action scenarios using clear market structure, institutional order flow, and key confirmation levels. This detailed breakdown is designed to give you a strategic edge and help you navigate this week’s trading opportunities with confidence.
📊 What to Expect in This Video:
1. Higher timeframe trend analysis
2. Key zones of interest and potential setups
3. High-precision confirmations on lower timeframes
4. Institutional insight into where price is likely to go next
Stay tuned, take notes, and be sure to like, comment, and subscribe so you don’t miss future trading insights!
Have a great week ahead, God bless you!
The Architect 🏛️📉

Trading EURUSD | Judas Swing Strategy 15/09/2025The Judas Swing strategy is all about discipline, patience, and trusting the process, and this FX:EURUSD setup from Monday’s session was a perfect reminder of why sticking to the rules matters more than chasing results.
As the Judas Swing session started, FX:EURUSD gave us the first clue we look for: a liquidity sweep above the zones high. Breakout buyers jumped in, only to find themselves trapped as price quickly reversed. This was our signal to get ready. But, as always, one signal isn’t enough. We needed the next confirmation: a break of structure to the downside. Once that shift in order flow printed, the setup was officially on our radar.
Next came the waiting game. The strategy demands patience until price retraces back into a Fair Value Gap (FVG) created on the price leg that broke structure. It didn’t take long FX:EURUSD pulled back neatly, tapped into the FVG, and our entry candle closed. That was the green light.
Risk per trade: 1%
Target: 2%
Risk-to-Reward: 1:2
Checklist complete. Trade executed.
Unlike some trades where price rockets instantly, this one tested our patience. FX:EURUSD moved in our favor but reversed and even pulled against us. Momentum returned, but instead of pushing toward our 2% target, price lost steam mid-way and reversed. The result: a 1% loss
The important lesson here is that a losing trade executed according to plan is still a successful trade. We didn’t chase the liquidity sweep. We didn’t anticipate the break of structure. We didn’t force an early entry. Every box was ticked, and the trade simply didn’t play out. That’s trading. The Judas Swing isn’t about winning every setup, it’s about trusting the process over the long run. By managing risk and staying consistent, we position ourselves for sustainable growth, even when individual trades don’t hit target.

Gold (XAUUSD) 6H – Bullish Order Flow With Key Liquidity TargetsOn the 6H timeframe, Gold shows a clear bullish order flow. Price recently tapped into the daily bullish FVG and reacted strongly to the upside, which supports my bullish bias.
From here, I expect the first target to be the buy-side liquidity around 3657. If momentum continues, the next objective could be a revisit to the all-time high.
⚠️ However, if price closes below 3612, this would shift the bias short-term bearish, with potential downside toward 3592.
Overall, I remain bullish for now, as long as price respects the key support levels.
💌It is my honor to share your comments with me💌
🔎 DYOR
💡Wait for the update!

Using imbalanced candle ranges will change your analysis foreverIn this video you will learn how imbalanced candle ranges affect price. When an imbalanced range prints, mark them out and start observing how they affect price 💎

Possible movelets see wht CPI has in store for us tmr this could be a possible move until tht low then well just wait and see


If you like ICT & TJR you must love this.Hey guys, been like almost 3 years since I dove into this algo trading course, and just a month ago I finally got my ICT & Tjr MT5 EA all done. Anyone wanna try or chat about it, just DM me.
It's def not a magic money maker lmao xD expect about 40% max drawdown if you're aiming for 200% returns. For passing funded accounts, it'd prob take a month or so sticking to that 5% daily DD. But you could speed it up with some manual tweaks though , like taking profits early or cutting losses early .
I'm running it on a $50 deposit from last Friday, and it's up to $717 now. But yeah, I've been hopping in manually a bunch to tweak stuff.
If you're down, I can hook you up with the EA for free you only got to run it on demo for a month, give me real feedback, and help collect some data. After fixes from that, might give it free in exchange for solid reviews and feedbacks to prepare it up for 2026 launch.
Btw, not selling this thing rn and won't fill i got everything set up.
