ICX/USDT — Descending Triangle, Breakout or Breakdown?Overview
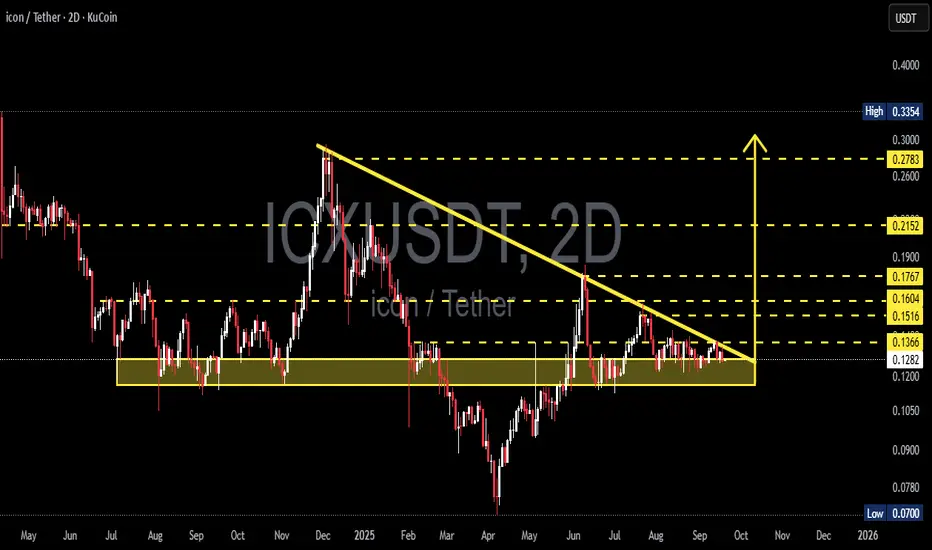
ICX is currently at a critical stage. Price has been consolidating for months within the strong demand zone at 0.11–0.13, while being consistently pressured by a descending trendline from late 2024 highs. This structure has formed a Descending Triangle / Compression pattern, where volatility is contracting, signaling that a major move is imminent.
The setup is classic: the longer the squeeze, the stronger the breakout when it comes. The question is — will ICX break to the upside or collapse below support?
---
Key Levels
Demand zone (major support): 0.11 – 0.13
Immediate resistance (trendline + horizontal): 0.1366
Upside resistance targets: 0.1516 → 0.1604 → 0.1767 → 0.2152 → 0.2783 → 0.3354
Breakdown targets: 0.09 → 0.07
---
Pattern Explanation
Descending Triangle: consistent lower highs (selling pressure) while buyers defend a flat support zone.
Statistically, this pattern leans bearish, but when it forms near a strong demand zone after a prolonged downtrend, it can also serve as a base for reversal.
ICX is now at the apex of the triangle → volatility has compressed and a breakout/breakdown is highly likely soon.
---
Bullish Scenario
Trigger: a 2D close above the descending trendline with rising volume.
Additional confirmation: successful retest of the breakout zone around 0.1366.
Upside targets:
TP1: 0.1516
TP2: 0.1604 – 0.1767
TP3: 0.2152
Extended: 0.2783 → 0.3354
Stop Loss: below demand zone (~0.105)
---
Bearish Scenario
Trigger: a 2D close below 0.11–0.105 with strong selling volume.
Downside targets:
Initial: 0.09
Extended: 0.07 (major chart low)
Stop Loss for shorts: reclaim above 0.13–0.1366
---
Sentiment & Momentum
Volume: currently declining, showing the market is waiting for a trigger before the next big move.
Momentum: RSI & MACD remain neutral, supporting the potential for a strong move once breakout occurs.
Market structure:
If support breaks → fast drop toward 0.09–0.07
If support holds → strong base for mid-term reversal
---
Conclusion
ICX is at a make-or-break point:
Bullish case: breakout above trendline could ignite a rally toward 0.15–0.21 and beyond.
Bearish case: breakdown below support opens the path to 0.09 or even 0.07.
Wait for 2D close with volume confirmation before entering. Manage risk properly — this is not the place to trade without discipline.
Not financial advice — purely technical analysis. DYOR & use risk management.
---
ICX/USDT is forming a Descending Triangle at the 0.11–0.13 demand zone.
Volatility is tightening → expect a major breakout or breakdown soon.
✅ Bullish: 2D close > trendline → targets 0.1516 / 0.1767 / 0.2152
❌ Bearish: 2D close < 0.105 → targets 0.09 / 0.07
Watch volume + 2D close for confirmation.
Trading without risk management = suicide.
---
#ICX #ICON #ICXUSDT #CryptoAnalysis #TechnicalAnalysis #DescendingTriangle #SupportResistance #Breakout
ICXUSDTPERP
ICXUSDT 1DICX ~ 1D Analysis
#ICX Buy after successfully penetrating this resistant line with a short -term target of at least 15%+ from here.

ICXUSDT 1WICX Update ~ 1W
#ICX So far it still maintains its bullish structure. Buy gradually within this support block,. with a minimum target of 20%+

ICXUSDT: Reversal PossibleICXUSDT Technical analysis update
ICX price has dropped 96% from its March 2021 peak and has now reached the December 2019 support level, which could be considered strong support. A potential reversal from this level is possible.
Regrads
hexa

ICXUSDTICX ~ 1W
#ICX This is the lowest price so far. Make purchases in stages. Minimum target 20%++

Icx/Usdt Breakout Alert
🚀 ICX/USDT Breakout Confirmed!🚀
I'm anticipating a price surge in the upcoming days, with an expected bullish movement of 40-80% soon. 📈 Let's see! 🤞
Disclaimer:This is not financial advice. Do your own research! 🧐
ICX deviation?ICXusdt looks good here to be longed.
Looks like a clean deviation holding here can send big.
LL Longed 0.2150.
Tight stops. If doesn't hold 0.2100 or looks really bad.
Targeting higher.
Note: Not a financial Advice.

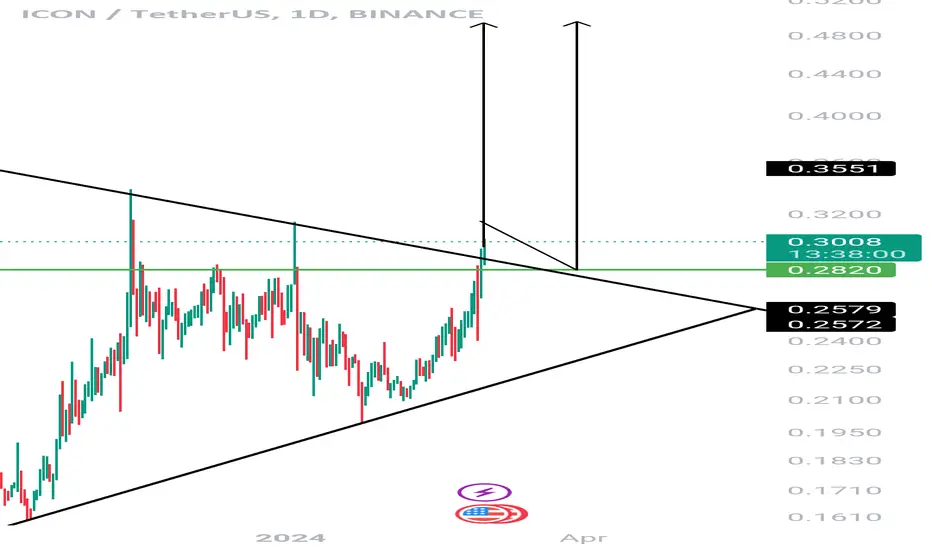
Today we review ICX. Will it reach the Fibonacci level of 0.618?Hello everyone! Today let's take a look at the cryptocurrency ICON.
At the beginning of April, the asset had a rapid growth, resulting in a 130% increase in price, breaking the strong Fibonacci level of 0.236 and further 0.382. However, the asset failed to consolidate above the latter and began to correct.
Currently, the asset is approaching the Fibonacci level of 0.238, where the uptrend line is also located.
Therefore, it is possible to look for an entry point to a position in the range of $0.28-0.29.
The targets are the next Fibonacci levels at $0.46-$0.97 (+57%, +230% profit).
This is not a financial recommendation, and everything you do is done at your own risk.

ICON ICX price rising and knows no grief) Who is pushing it up?The fact that the trading volumes of the ICONUSDT pair have grown significantly since the beginning of the year clearly indicates the increased interest of "big money" in the project.
What's going on there? Share your thoughts in the comments.
In our opinion, the main price intrigue on the ICONUSDT chart will take place in the region of $0.42-0.43
In this price zone, it will be clearly visible whether buyers will be able to break through and continue the growth of the ICON price above $0.60 in a short time.
Or is it possible that a correction to $0.28 is needed to continue the "healthy price growth" and only then will the price rise to $0.60 and higher
_____________________
Did you like our analysis? Leave a comment, like, and follow to get more

icxusdt may b form a bullish butterfly pattern on daily time . icxusdt may b form a bullish butterfly pattern on daily time . RR 1:25
just for learning purpose not a financial advice

ICX 30 MIN lONG SCALPIcx is ready to go Higher
Take Profit 1 0.74423
Take Profit 2 0.74750
Take Profit 3 0.7509
Take Profit 4 0.76205
Take profit 5 0.77015
Stop Loss- 0.7150
Leverage- 20x

ICXUSDT, Exactly drop to activate our buy zoneHello guys
ICX is one the amazing project in last years but in these days its not working very well
According to the chart and previous analysis, after the price supported in the area that was had 2 support zone one of the trendline and one of them was static the market started upwards movement to the key point level and because of the loss of power to break this important level we shown on chart that the price is ready to dump and exactly this event happend and now the price is in our buy zone area.
We expect the price can rise and move upwards toward the target after have some consolidation in here and take time in this zone.
At first take signal then take in long position for future and if you wanna trade in spot you can buy one step of your money in here.
If you have any question send us messages in private
Good Luck
Abtin
Previous analysis :

ICXUSDT, We need more drop to reach to buy zone areaHello evreybody
According to the chart and previous analysis, We shown on chart that the price is need to drop more because of the movement that couldnt break the key point level and drop price started from there level.
If the price drop more and come to our buy zone area we can buy one step and wait until to reach to the target that we will update it in future
We should be patient just watch
Good Luck
Abtin

ICSUSDTPREP 4H LONG SETUPFinally ICX breakout from the bullish flag and it will go high. Buy it and hold for some days.
BUY SETUP:
BELOW 2.09
SELL SETUP:
TARGET 1: 2.15
TARGET 2: 2.25
TARGET 3: 2.4
STOP LOSS: 2.00
GET READY GUYS...YOU WILL GOOD PROFIT.
LIKE IT WILL BE MUCH APPRECIATED...

ICXUSDT , The price is squeezingHello everybody
According to this analysis , you can see the price is squeezing and its ready to jump to new target over 3$
But we have a resistance area that shown on chart
We think the price should one more time again come to impact to the trend line area then it can be ready to jump
We can wait until the price come to our buy zone area or if it can close the daily candle above of the minor resistance we can buy some of it
Dont forget use stop loss and attention to money management
Be with us and sleep comfortably
Good Luck
Abtin

ICXUSDTPERP and Technical AnalysisICXUSDTPERP zone support and resistance , double bottom which shows the trend is upward but trade safe and wisely. Always keep an eye on BTC dominance and BTC move, market depends upon it.
ICX technicaal analysis and long and short trading.

ICXUSDT (1h Chart) Head and Shoulder PatternICX/USDT(1h Chart) Technical analysis Update
ICX/USDT(1h Chart) Currently trading at $1.19
Buy level : Above $1.17
Stop loss: Below $1.11
TP1: $1.24
TP2: $1.29
TP3: $1.36
Max Leverage 3x
Always keep Stop loss
Follow Our Tradingview Account for More Technical Analysis Updates, | Like, Share and Comment Your thoughts.

#ICXUSDTfirst target is blow key lvl, then u can wait to break out
Do not forget the capital manager

ICXUSDT Waiting for the breakoutICXUSDT (1H CHART) Technical Analysis Update
Waiting for the resistance breakout
ICX/USDT currently trading at $1.83
Buy-level: Above $1.90 (only buy if 1h candle closes above 1.90$)
Stop loss: Below $1.60
Target 1: $2.00
Target 2: $2.27
Target 3: $2.42
Target 4: $2.80
Max Leverage: 2X
ALWAYS KEEP STOP LOSS...
Follow Our Tradingview Account for More Technical Analysis Updates, | Like, Share and Comment Your thoughts.

ICXUSDT EnjoyThis is not financial advice
ICX successfully breakout the downtrend
ICX have everything to PUMP hard, just check

🆓ICON/USDT Analysis (23/2) #ICX $ICXICX has decreased over 40% from the peak and we can see a strong buying force at 1.5$ zone yesterday and the selling force today was stopped around 1.5$. So we could expect a recovery on ICX soon to 2.2$ zone.
If ICX conquers this 2.2$ zone successfully, it could pump strongly to 3$ or even 4.5$ zone.
The March would be a great month of ICX
📅NEWS
👉Mar 31 : Balanced DeFi Launch
📈BUY
-Buy: 1.4-1.5$. SL B
-Buy: 2.15-2.25$ if A. SL B
📉SELL
-Sell: 2.15-2.25$. SL A
-Sell: 2.95-3.05$. SL A
-Sell: 4.4-4.6$. SL A
♻️BACK-UP
-Sell: 1.4-1.5$ if B. SL A
-Buy: 0.95-1$. SL B
-Buy: 0.80-0.85$. SL B
❓Details
Condition A : "If 12H candle closes ABOVE this zone"
Condition B : "If 12H candle closes BELOW this zone"

✳️ICON/USDT Analysis (23/12) #ICX $ICXICX is still having difficulty breaking up at higher price levels because of its selling force is still strong.
0.35$ zone is still a reliable support zone so we could buy if ICX approaches this zone.
I think, ICX will initiate an uptrend in early January to 0.5$ and 0.65$ or even 1$ zones in early February.
📈BUY- LONG
-Buy: 0.34-0.36$.SL if B
-Buy: 0.49-0.51$ if A.SL if B
📉SELL-SHORT
-Sell: 0.64-0.66$.SL if A
-Sell: 0.95-1$.SL if A
♻️BACK-UP
-Sell: 0.34-0.36$ if B.SL if A
-Buy: 0.19-0.21$.SL if B
❓Details
Condition A : "If 1D candle closes ABOVE this zone"
Condition B : "If 1D candle closes BELOW this zone"
