Planning a long swing based on these confluencesHi Traders!
In my opinion, GJ continues to be bullish. I posted a mind on Oct. 31st about how I thought GJ was in a retracement phase, and it seems to be trying to reverse out of that retracement.
A few confluences that stand out to me are- an attempt to make a Invert. Head and Shoulder, and a bullish 4HR CHOCH. Now, I'm looking to take a long swing, but in order for me to do that I need my confluences to be lined up to make the best logical decision.
My desired entry targets would be at 202 or 201.500. 201.500 would bring price to a 4HR OB/consolidation area that price broke out of on Friday, Nov. 7th.
However, if price doesn't make it to my desired areas, I may wait for a break above 203.200 with a strong candle close (Higher TF). That could confirm the bullish 4HR CHOCH.
I like to give GJ room to move, so if 203.200 is the case, my SL would potentially be just below 202/last higher low. This is all depending on how GJ moves. TP swing target 207-207.500 with taking profits in between.
Leave a comment, and let me know your thoughts!
*DISCLAIMER: I am not a financial advisor. The ideas and trades I take on my page are for educational and entertainment purposes only. I'm just showing you guys how I trade. Remember, trading of any kind involves risk. Your investments are solely your responsibility and not mine.*
IDEA

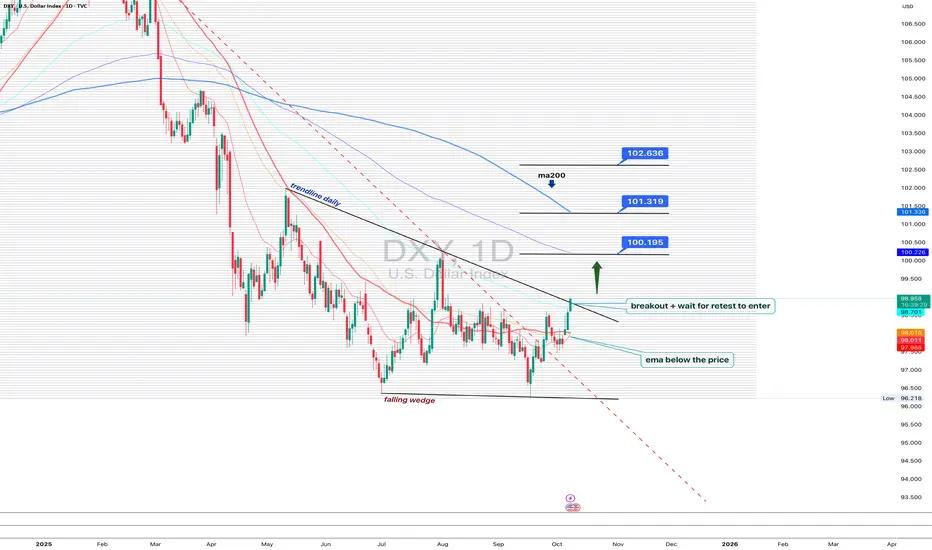
DXY 1D - dollar waking up, but patience is keyOn the daily chart, the US Dollar Index is showing the first signs of recovery: a falling wedge breakout and trendline breach hint that bulls are slowly reclaiming control. Price has moved above the EMA, a short-term bullish signal.
Still, MA200 remains above, reminding us that the broader trend is not yet flipped. The ideal play here - wait for a retest of the breakout trendline to confirm buyers’ strength before jumping in.
If price holds above 99.70, the next upside targets sit around 100.19, 101.31, and 102.63.
But keep in mind - DXY loves to test patience. False breakouts are its favorite sport.
Right now, the dollar looks ready to wake up, but maybe hit the snooze button one last time before the real move begins.
GRAB 1D - picking phones off the market floor again?GRAB pulled back exactly into the 4.90–5.10 buy-zone, where the wedge retest aligns with the MA200 - a major technical cluster that previously launched strong impulses. Oscillators show deep oversold conditions, candles print buyer tails, and the first resistance sits at 5.35, matching the 0.618 retracement. A breakout above 5.35 opens the path toward 8.65 (1.618), and a move above 6.80 could initiate a larger rally toward 11.92 based on the 2.618 extension.
Company: Grab Holdings is Southeast Asia’s largest super-app platform, combining ride-hailing, food delivery, fintech, payments, and micro-lending across Singapore, Malaysia, Indonesia, Thailand, and Vietnam.
Fundamentally , as of November 19, GRAB continues to strengthen: gross profit and GMV grow, operational efficiency improves, and both ride-hailing and delivery segments have reached sustainable profitability. Fintech is expanding at double-digit rates, margins improve as subsidies are reduced, and operating losses continue to shrink. Cash flow strengthens, the path to full profitability is visible, and the overall digital-services boom across Southeast Asia remains a long-term driver for growth. Competition cooled, monetization improved - exactly то environment the company needed.
Technically , the bullish scenario holds as long as price stays above 4.90–5.10. A breakout above 5.35 activates the 8.65 target, and the major upside - 11.92 - becomes realistic once price gets above 6.80. A drop below 4.80 complicates the picture, but current structure still looks like a controlled reset rather than a trend break.
Grab acting like usual: discounts first, acceleration later - Southeast Asia likes this script.

BITCOIN | LONG BIAS | POTENTIAL REVERSAL AND KEY LEVELS TO WATCHTraders,
Bitcoin is now sitting inside a large falling wedge structure on the daily chart. Wedges of this type often form during trend exhaustion and can precede significant reversals when the lower boundary is reached. This pattern sets the stage for everything that follows in this analysis.
Below is the full breakdown of why I believe Bitcoin is positioned for a potential reaction and where the most important levels are located.
Recap of the Previous Bitcoin Analysis
In the previous IG:BITCOIN analysis
I mentioned two scenarios. Scenario one outlined the following sequence:
• Price pushes into 107k to 108k
• That move sweeps the weak high and taps the AVWAP anchor
• If spot CVD slows or perps shift into net selling, a rejection becomes likely
• That rejection sends price back toward the mid range and possibly into 101k to 102k
• Continuation into the higher timeframe LVN at 98k becomes possible
Every single step unfolded almost perfectly.
Current State of Bitcoin
Bitcoin is now sitting directly on the lower band of the AVWAP anchored from 7 April 2025.
What this means
AVWAP stands for Anchored Volume Weighted Average Price. It calculates the average position of market participants beginning from the chosen anchor point. The April low marked a major shift in trend structure. When price reaches the lower band of an AVWAP anchored to such a significant low, it often acts as dynamic support. This is because it reflects the average entry of early cycle buyers.
If price holds and begins reclaiming from this area, it signals that the strongest hands are defending their positions. If it fails, the market risks a deeper flush into lower demand clusters.
Value Zone Analysis with Fixed Range Volume Profile
To determine whether Bitcoin is inside a significant value region, we use a Fixed Range Volume Profile (FRVP). The range is anchored from the April low to the October high.
Zooming into the profile on the left, price has now re-entered the core value area of this entire swing. The red horizontal line marks the Point of Control, which is the level with the highest traded volume in the entire range. The current low sits almost exactly on this level.
Pixel perfect confluence.
Why this matters
When price returns to the value area after a distribution phase, two possible outcomes appear:
1. Reversal
Buyers defend value and price rotates back toward high volume nodes above.
2. Continuation breakdown
Price accepts below value, meaning even previous buyers are unwilling to re accumulate here. This opens the door to the next low volume pocket and lower demand zones.
Right now, the reaction at this level is critical because we have perfect alignment between the lower AVWAP band and the FRVP Point of Control.
Mathematical Levels and Fibonacci Structure
Now we collect the mathematical evidence. We are sitting at a core AVWAP level and a core FRVP level. Now we check if the market is stretched mathematically.
Bitcoin at the 1.618 Extension
On the four hour spot chart, I apply a Trend Based Fibonacci Extension from A to B and project it from C.
The placement rule
Ask yourself:
What was the last meaningful swing high that ended the previous trend and started the current reversal?
That swing becomes A to B. The first corrective lower high after that becomes C.
Using this structure, Bitcoin has now extended perfectly into the 1.618 level. The 1.618 Fibonacci extension is historically associated with exhaustion. Sharp downlegs often pause, take liquidity, or reverse at this point.
TOTAL at the 2.0 Extension
To confirm that this move is not isolated to Bitcoin, we check the CRYPTOCAP:TOTAL crypto market.
TOTAL reflects the entire crypto market and shows equilibrium conditions.
When Bitcoin and TOTAL stretch at the same time, reaction probability increases.
Start with a retracement from A to B:
Price nearly hit the fifty percent mark but not entirely. Then reverse the tool from B to A. Doing so reveals the extension levels below. Price is now sitting exactly at the 2.0 extension.
Why the 50 percent connects to the 2.0
If a move retraces halfway, the remaining distance becomes the basis of the flipped extension. Doubling that distance gives the 2.0 level.
Because TOTAL did not fully reach the fifty percent retracement, there is a small missing portion. To visualise this, I draw a box between the actual retracement and the fifty percent level. Then I duplicate the box under the 2.0 extension.
The duplicated box lands perfectly on the current low, showing mathematical symmetry.
Additional Mathematical Check
I also check the structure that began after the 10 October crash.
By extending from B to A, the downside projections appear. Price tagged the 1.618 level perfectly.
Full symmetry
Bitcoin at the 1.618
TOTAL at the 2.0
Internal structure at the 1.618
When all three align, the move has reached market wide symmetry. These zones commonly produce strong reactions or reversals.
Summary so far
We now have confluence in four categories:
• AVWAP support
• FRVP Point of Control support
• Fibonacci extensions on BTC and TOTAL
• Mathematical symmetry across multiple swings
Next, we check the internal fuel of the move: order flow.
Order Flow Analysis
Spot CVD Divergence
On both the one hour and thirty minute charts, Spot CVD continues making lower lows while price holds steady. This means aggressive sellers are pushing market sell but price refuses to break down. This can only occur when passive limit buyers absorb the flow.
This is hidden absorption.
Coin Margined Futures CVD
Coin margined CVD shows the same pattern: lower lows while price stays flat.
This indicates aggressive shorting with no continuation.
Why coin margined matters
Coin margined futures use BTC as collateral. When price declines, the collateral loses value. When price rises, shorts lose even more because both their collateral and their position move against them. Coin margined shorts get squeezed harder and faster.
Open Interest
• Stablecoin margined OI: holding steady. Traders continue to open or maintain positions during sell pressure.
• Coin margined OI: compressed during the dump and is now flat. This means shorts are sitting in the market and can be forced out.
Summary
Price stable
CVD falling
OI steady
This is absorption combined with short build-up.
This often leads to a sharp reversal when price begins to lift.
Volume Analysis
Chart:
Accumulation and Distribution (A D Indicator)
The A D indicator shows whether volume flows into candles or out of them.
On the one hour chart, the A/D is trending up while price stays flat. This means buyers are stepping in during down-wicks and absorbing sell pressure. Price is not showing this strength yet, which is typical for accumulation phases.
On Balance Volume (OBV)
OBV measures directional volume flow.
On the last wick down, OBV actually moved up.
This means buyers absorbed the move rather than sellers pushing price down.
This is the classic bullish volume divergence after a liquidity sweep. Both Spot and Perps Confirm
These divergences appear on both spot and perpetual futures. Spot confirmation is the strongest form of validation because it represents real buying without leverage distortion.
The combination of A/D rising, OBV diverging, Spot CVD falling, and Futures CVD falling strongly supports that the sell pressure is being absorbed.
What Happens Next
Based on everything above, I expect Bitcoin to start by taking the weak local high at 99,862. Weak highs form when the wick structure is sloppy and no real sellers defended the level. On fine tick data, this high looks even weaker.
Taking that high breaks the current local structure and potentially triggers a short squeeze. If Bitcoin begins closing four hour candles above 106,200, the next important level is 108,500.
Main Thesis
Bitcoin pushes into the first target zone and performs a Swing Failure Pattern around 115,700. With strong momentum, the move could extend into the 17,300 to 18,000 region.
Invalidation and Downside
If Bitcoin loses support and spends meaningful time below 93,000, the next major support is 84,617. This is the next Point of Control from the AVWAP auction and an extremely important level to watch.
All relevant levels are marked on the charts.
Trade safe and manage risk.
From the depths of the sands,
ThetaNomad
-------------------
If you like my analysis, give it a like and leave a comment so more people can see real analysis without the noise.

DYDX/USDT – Working within the horizontal channel. Continuation.dYdX - is DeFi’s pro trading platform and a pioneer in decentralized finance, known for being the first to offer decentralized margin trading and derivatives, as well as inventing flash loans and DEX aggregators in 2018. Built on a custom Layer-1 blockchain using the Cosmos SDK, dYdX provides a professional-grade, decentralized trading experience with high leverage, deep liquidity, and low fees. Governed by the community through the DYDX token, dYdX is focused on delivering a transparent and user-driven financial system.
CoinMarketCap : #107
I've been working within this channel for about 2.5 years.
From my previous trading idea, two marked zones were reached:
1.6447 (+80%)
2.5007 (+176%)
The maximum squeeze reached +185.5%.
I'm continuing to work within the channel.
Last time, liquidity was accumulated below the support of the inner channel.
Now, liquidity is being gathered below the support of the outer channel—as always.
I've marked potential final liquidity grabs on the chart, as well as resistance zones where the price is likely to react.
The profit is significant, and if you work with compound interest, well… I'll just keep quiet—not everyone understands this and keeps waiting for the final rally.
A reminder:
Right now, fear dominates across all coins. This is the phase where nobody wants to buy or where many have already run out of funds. Why? Because, as always, most people buy at the top.
Take all of this into account in your trading strategy.

Bitcoin TA and ALT coin TAHi guys,
I hope you enjoyed the video! Its going to be a very existing next 3 months!

ASPN - cup, handle, and maybe the moonAspen Aerogels (ASPN) shows a textbook “cup and handle” pattern on the daily chart. The stock broke above the MA50 and MA200, forming a golden cross - a clear signal of trend reversal. The buy zone sits around 7.4–7.8 , where price has twice found support. Holding above 8.0 keeps the door open toward 11.3, 13.7, and possibly 16.0 - key supply levels from previous distribution.
On the fundamental side , ASPN benefits from strong interest in energy-efficient materials and aerogels used in green construction and EV insulation. With US policy support for clean tech, the company may catch a new growth wave.
Tactically , as long as price stays above 7.8 , the setup remains bullish. Break above 9.0 confirms further upside, while a drop below 7.0 cancels the pattern.
Every cup looks perfect until someone shakes the table - let’s see if this one stays steady.

FLNC 1D – The power comeback!On the daily chart, Fluence Energy (FLNC) shows a clean cup and handle formation followed by a golden cross (MA50 crossing above MA200) - a textbook bullish reversal setup.
Price broke out of the structure and is now pulling back into the buy zone ($14.57–$16.80) - a confluence of Fibonacci support and previous resistance.
✅ Golden cross confirms trend reversal
✅ Rising volume supports the move
✅ MAs below price - bulls are in control
The first target sits near $27.43, while the second projection extends to $40.28 if momentum continues.
Fundamentally, Fluence remains a leader in energy storage and grid technology - a hot spot for global investment as the renewable sector accelerates.
Let’s just say - this chart looks fully charged ⚡️

TGT 1D - hitting the target?On the daily chart, Target Corporation (TGT) has finally broken out of its long downtrend and closed above the consolidation box. The setup suggests a potential bullish reversal with targets at $123 and $146.8.
Technically , the structure looks solid: a possible retest of the breakout zone could offer a great mid-term entry. Volume supports the move, and RSI is recovering from oversold levels.
On the fundamental side, Target is regaining investor confidence. The company is expanding its digital sales, strengthening brand partnerships, and improving supply-chain efficiency. Rising margins and better inventory management hint that profits may start to recover - just in time for the holiday season.
Tactical plan: as long as price holds above $94, bulls have control. The next target? Well… Target itself.

GBPJPY IDEA FOR 28, OCT 2025Overall, bearish momentum is evident. Sessional Bias is also bearish, but we expect a price retracement back up during LND. If the current structure holds, we prepare for more bearish lags and movements.
As usual, my calls or analysis are based on what we see, the current Bias, and from a probability standpoint, meaning that this projection may be or may not be validated, so tread carefully. As usual, this is not financial advice; trade responsibly.

LC 1W: When the Market Spreads Its WingsOn the weekly chart of LendingClub (LC) , a “golden cross” has formed - the MA50 crossing above the MA200 from below, confirming a medium-term trend shift in favor of buyers. The current price of 15.30 is trading within the 0.705–0.79 Fibonacci zone (14.54–15.32), which now acts as a key support after the breakout. Structurally, the asset is moving within a broadening ascending channel, suggesting potential for increased volatility and range expansion.
Technically, the market shows strength: the upward impulse was accompanied by an abnormal spike in volume, both MA50 and MA200 are positioned below the price, and the nearest resistance is at 17.26 (1.0 Fibonacci level). A breakout above this area opens the way to the 1.618 extension at 22.95–23.02. The scenario is invalidated if the price closes below 12.65, which would pull it back into the previous descending structure.
Fundamentally, LendingClub benefits from easing tensions in the US debt market and moderate growth in consumer lending. Positive earnings momentum and the resilience of its business model add further confidence to the bulls.
Tactical plan: as long as the price holds above 14.54–15.32, the medium-term growth scenario remains valid, targeting 17.26 and 23.02. The optimal entry would come after confirming the support hold and spotting a local reversal candlestick pattern on the daily timeframe.
As they say, a golden cross isn’t just an indicator - it’s a first-class ticket to the trend league. Just make sure you don’t miss the flight.

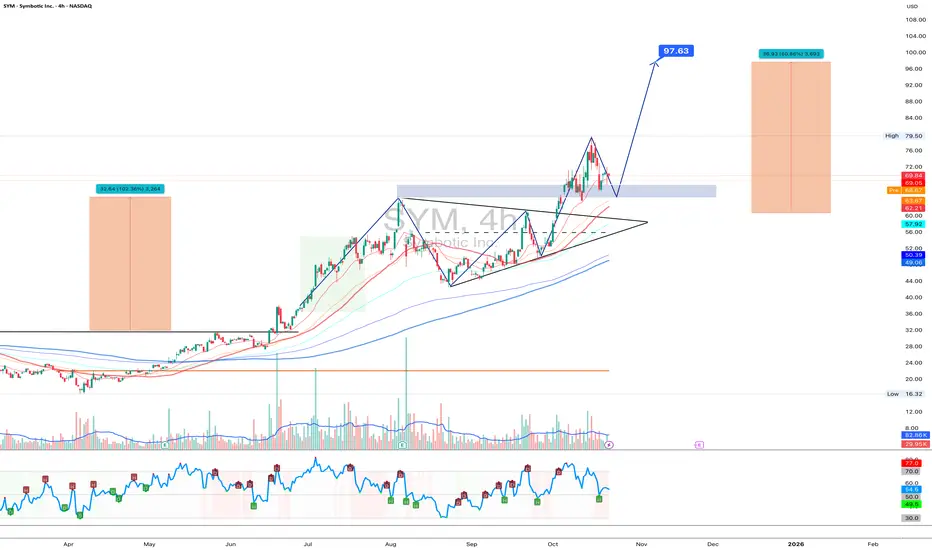
SYM 1D - AI with a real upgrade?Symbotic Inc. shows a clean setup: after a strong rally and breakout from a triangle, the stock is now retesting the $68–70 support zone. The 50-day moving average aligns perfectly here, strengthening the buyers’ defense.
If this level holds, the bullish structure stays intact. The first target sits around $79.50, and the second - at $97.63, matching the prior measured move. A dip below $68 could trigger a deeper pullback toward $62 before buyers regroup.
On the fundamental side, Symbotic keeps expanding its robotic warehouse automation systems - a sector still booming thanks to the AI wave. After a 100%+ rally this year, the stock deserves a coffee break before the next sprint.
Tactical plan: watch $69 carefully - if buyers defend, the uptrend continues; if not, give the robots a reboot and wait for the next entry.
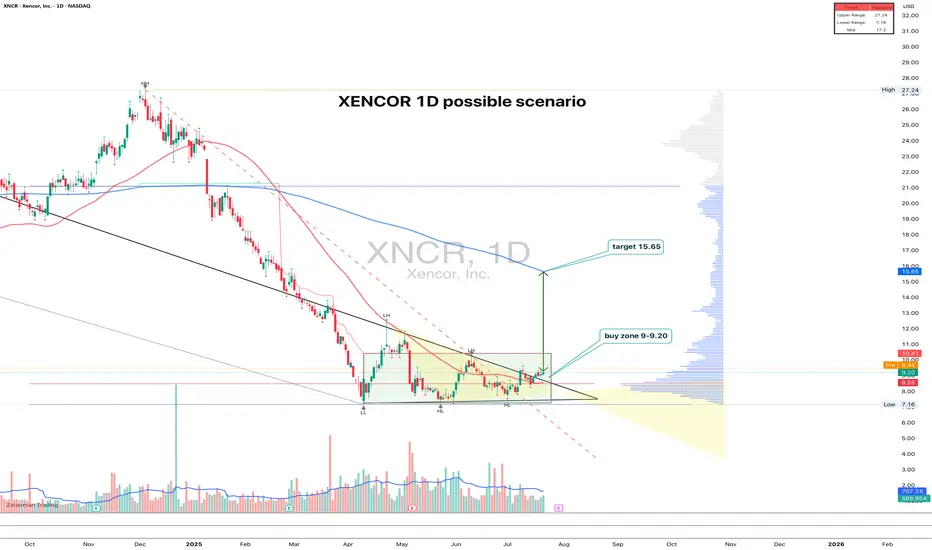
XNCR 1D time to growth?XNCR: the uptrend hasn't started yet - but someone's quietly accumulating
XNCR spent nearly 4 months building a base and finally broke out of consolidation with a clear upward move. The pattern looks like a range with a narrowing triangle at the bottom — the breakout came with rising volume. Entry makes sense in the 9.00–9.20 zone on a retest. Volume profile and Fib levels confirm the importance of this area, plus there’s a clean support shelf at 9.00. The target is 15.65, which aligns with the height of the structure. The 200-day MA is still above price, but a push beyond 11.00 could open the door to acceleration.
Fundamentally, Xencor is a biotech company focused on monoclonal antibodies. After a tough 2023–2024 and cost reductions, the market is beginning to price in signs of recovery. Key partnerships remain intact, the pipeline is alive, and recent data for XmAb7195 was well received at industry events. Valuation remains low, and biotech ETF flows are slowly picking up.
Still a relatively low-volume name, but the structure is clean, the setup is readable, and fundamentals are turning. With a tight stop below 8.50, the risk-reward looks solid.
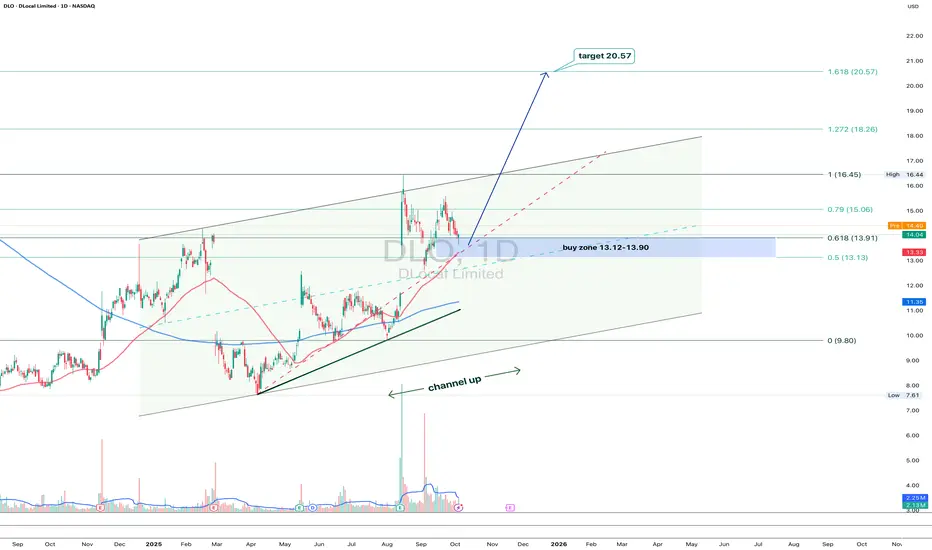
DLO 1D: steady within the channel, eyes on $20+On the daily chart, DLocal keeps trading inside a clean upward channel. After a strong leg up, price is pulling back toward the 13.12–13.90 buy zone - a confluence of the 0.5–0.618 Fibonacci retracement and the channel’s lower boundary.
As long as both MA50 and MA200 stay below price, buyers remain in control. Volume expansion supports the idea of another bullish swing ahead.
First resistance is near $16.45, with the broader target sitting at $20.57 - the 1.618 Fibonacci extension.
From a fundamental standpoint, DLocal keeps strengthening its presence in emerging markets. The fintech theme is still alive, and this setup looks like a calm pullback before another push higher.
In short - wait for confirmation around support, then let the trend do the heavy lifting. Just remember: even the cleanest channels have bumps along the road
USDJPY D1 TRADE IDEA FRAMEWORK, FOR 20TH OCT, 2025.The UJ market is overall on an uptrend and currently in and out of range, which seems the price is trying to retrace downwards a bit to fill the Gap Area indicated below.
Now let's talk a little bit about Market Gaps...
One of the regular behaviour of the markets that happens is that usually after a sessional jump(GAPS) most times which is created after the weekend of a past trading week, the markets usually most times make a Gap because of the lack of trading activity over the weekend that create a void in prices, so in other for the market to create a balance before the market continues in its determined direction? It usually, as always, comes back to fill the Gaps of inactivity before it resumes on a balanced trajectory.
This is why, in most cases, holding trades over the weekend isn't advisable to avoid overnight fees, swaps, and drawdowns in capital or profits when holding a position, especially when under-capitalized, because these kinds of Gaps or Jumps in price happen due to fresh information that comes into the market before a new session begins.

Bitcoin end of the year sell off!I hope you guys enjoyed the video! if you have any questions or comments; feel free to comment down below

GOLD 30M - time to cool off after the rally?After a sharp rally, gold seems ready for a breather. The chart shows a break of the short-term trendline followed by a retest from below. The price is now hovering near $4250, testing the 0.618 Fibonacci level - a classic resistance area where sellers often step in.
If the pullback continues, the next downside targets lie near $4185 and $4064. However, as long as the $4200 support holds, bulls still have a chance to regain control.
Fundamentally , gold remains supported by global uncertainty and dovish central banks, but technically, a healthy correction was long overdue.
Tactical plan: watch $4260 closely. If sellers hold, the drop could extend. If buyers reclaim the level - bears will have to retreat.
Remember: don’t try to catch falling gold - it cuts both ways.

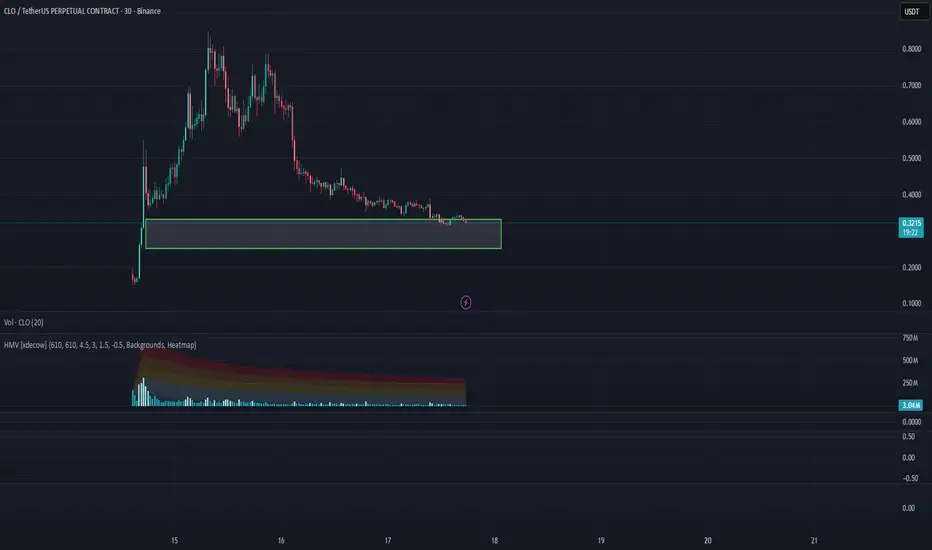
CLO/USDT Analysis. Long Setup
The asset has reached a strong volume support zone at $0.33–$0.25.
If we see strong buying activity — confirmed by a volume spike, local trend reversal, or delta-based absorption — we can consider a long setup with up to 100% growth potential.
This publication does not constitute financial advice.
AUDCHF 1D - wedge falls, price risesOn the daily chart AUDCHF shows a classic falling wedge, already broken to the upside with a retest of the 0.5250 entry zone. Price is consolidating above this level, giving bulls a chance to build momentum. The nearest targets are 0.5295, followed by 0.5374 and 0.5448. Moving averages are flattening, while RSI, recovering from seller pressure, supports a potential upward trend.
Fundamentally , the pair reflects the tug-of-war between risk appetite and safe-haven demand. The Aussie gets moderate support from commodity strength, while the franc remains a defensive play. If global risk appetite stays firm, capital is more likely to flow out of CHF into higher-yielding currencies like AUD.
Tactical plan: consider longs around 0.5250, with targets at 0.5295, 0.5374, and 0.5448. If bulls hold above the breakout zone, the structure may turn into a solid bullish leg.
The only question is: will the franc stay defensive while the Aussie fires up the barbecue?

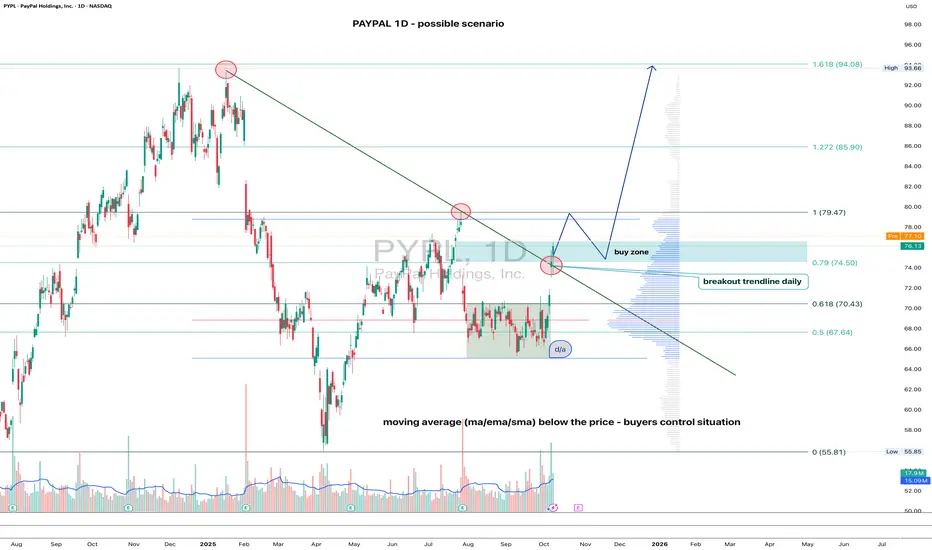
PAYPAL(PYPL) 1D - gaining traction On the daily chart, the price has confidently broken through the descending trendline — the first strong sign of a bullish shift.
All key moving averages (MA, EMA, SMA) sit below the price, showing that buyers are clearly in control.
Buy zone: 74.50.
A retest in this area (74.5–76) looks likely before another push higher.
First resistance: 79.47.
This level might trigger a short-term pullback, but a breakout above it opens the way toward targets at 85.90 and 94.00.
In short - the structure looks healthy, the breakout is done, and PayPal may be just warming up for a bigger move. Stay sharp - dips could be opportunities, not danger.
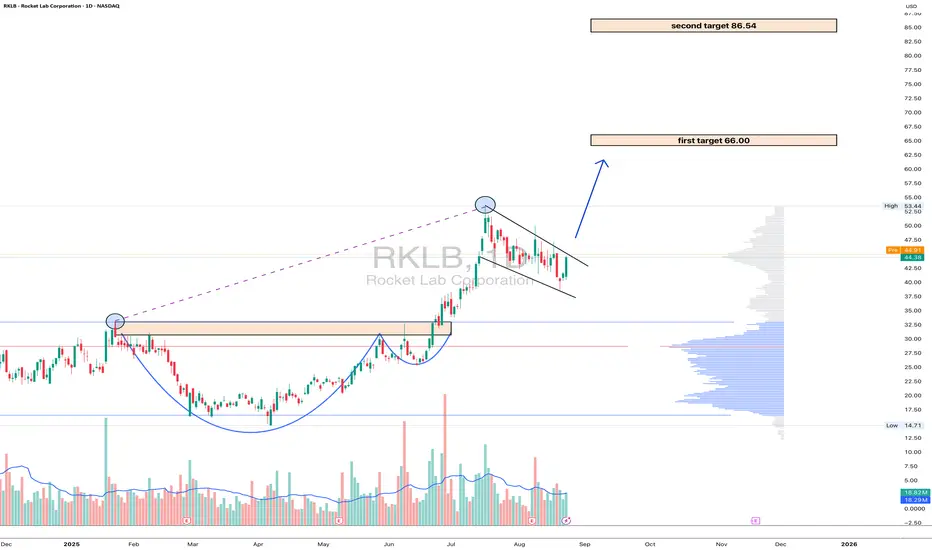
RKLB: the rocket is fueled and ready for orbitOn the daily chart of Rocket Lab (RKLB) , the price is trading at $44.38 after a confident breakout above key consolidation zones. Technically , the break of the $40 level confirmed the strength of the bulls and solidified the upward structure. The next target is $66 - a strong resistance aligned with the Fibo extension and if momentum holds, the market could extend toward $86.54, where long-term levels converge. EMA indicators remain below the price, reinforcing the bullish outlook.
Fundamentally , Rocket Lab stands as a leader in the small-launch vehicle sector, strengthened by contracts with NASA and consistent commercial demand. Amid growing interest in the aerospace industry and rising competition with SpaceX, the company benefits from diversified revenue streams and steady launch schedules. On the geopolitical side, increased defense programs in the U.S. and allied nations provide additional long-term support.
Tactically , the zone above $40 now acts as a support: as long as price holds above it, the bullish scenario remains intact. Targets are set at $66 and $86.54. Short-term corrections are possible if the market overheats, but the broader structure points upward, with institutional flows suggesting accumulation.
If this scenario plays out, Rocket Lab won’t just launch satellites - it’ll launch portfolios into orbit.
EURCHF Bullish Wait for a bullish confirmation around the FVG zone (0.9335–0.9340) or the OB This could include:
A bullish candle formation like a bullish engulfing candle or a pin bar.
A break of structure: Look for a shift from lower lows and lower highs to higher highs and higher lows, which signals the market is starting to form an uptrend.
Order block confirmation: If the price moves into the yellow order block (OB) and reacts with bullish price action, that can be another signal to go long.

LZ 1D: Legal move to the upside?On the daily chart, LegalZoom broke out of a falling wedge and perfectly retested the breakout area - almost textbook stuff. The buy zone around 9.25–9.89 aligns with the 0.5–0.618 Fibonacci retracement and previous volume cluster, giving the setup extra strength.
With both MA50 and MA200 below the price, momentum stays bullish. The first technical target lies near $15.33, with potential extension toward $20+ if broader sentiment remains supportive.
From a fundamental view, LegalZoom benefits from renewed demand for digital legal services and cost optimization. Not a bad combo - solid technicals plus improving business dynamics.
So yes, bulls have the gavel now - let’s just hope the verdict is in their favor
