IDOLUSDT - Break or Breakdown? IDOL at Decision Zone!Currently, MEET48/USDT is sitting at a critical decision zone after a parabolic rally from 0.012 → 0.0428. The euphoric surge was followed by a healthy correction and distribution phase, forming lower highs capped by a descending trendline (yellow) while price consolidates within the 0.030 – 0.033 box zone (yellow box).
This area now acts as the ultimate battlefield between buyers and sellers. The next decisive move will determine whether we get a bullish continuation breakout or a bearish breakdown into deeper correction.
---
Visible Patterns
1. Descending Trendline (seller pressure)
Price has repeatedly failed to close above this yellow line → showing sellers are defending strongly.
2. Consolidation Box (accumulation zone)
The 0.030–0.033 zone is the current tug-of-war area. As long as price holds above it, buyers still have a chance.
3. Two Technical Interpretations:
Descending Triangle (bearish bias): if price continues to press against support.
Falling Wedge (bullish bias): if price breaks to the upside, often signaling trend continuation after a pullback.
---
Bullish Scenario
Trigger: 4H candle close above 0.033 with strong volume confirmation.
Targets:
TP1 → 0.0361 (first resistance)
TP2 → 0.0405
TP3 → 0.0428 (local high/ATH)
Narrative: A breakout signals buyers regaining control and resuming the prior rally after consolidation.
---
Bearish Scenario
Trigger: 4H candle close below 0.030 with high selling pressure.
Targets:
First support zone → 0.024 – 0.025
Extended target → 0.0115 (historical low shown on chart)
Narrative: A breakdown confirms sellers dominating the zone, opening room for a deeper correction.
---
Key Takeaway
0.030 – 0.033 = Decision Zone
Breakout above → continuation higher.
Breakdown below → deeper correction.
Watch volume and 4H candle close for confirmation.
---
Notes for Traders
Avoid FOMO, wait for confirmation before entering.
Use scaling strategies (partial entries/exits).
Always manage risk with stop loss outside the box zone.
MEET48 is a low-cap altcoin → expect potential false moves due to low liquidity.
---
#MEET48 #MEET48USDT #CryptoAnalysis #Altcoin #TechnicalAnalysis #Breakout #DescendingTriangle #FallingWedge #SupportResistance
Idolanalysis

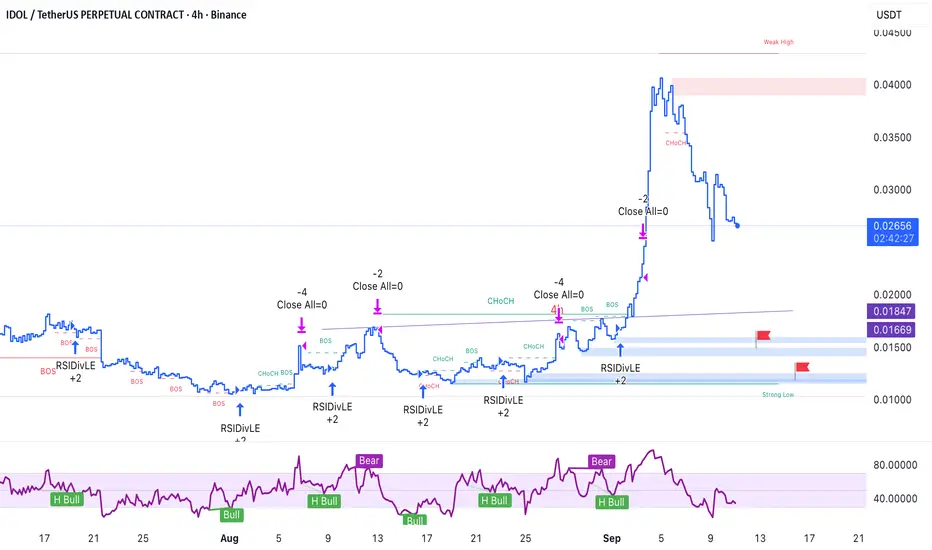
IDOL - Where is the buying zone for IDOL?For coins such as IDOL, my focus remains purely on technical analysis. Whitepapers and narratives have little relevance here; what matters is what the chart and indicators reveal.
Looking at the historical data, the market once pushed IDOL into extreme overbought territory with an RSI peak at 99—a level that cannot simply be explained by retail FOMO. Regardless of its origin, the aftermath was inevitable: a sharp correction that dragged IDOL into deep oversold conditions, hitting an RSI low of 15, followed by a mild rebound.
This is where things start to look more rational. The key question now is: Where are the optimal entry zones for those looking to position in IDOL? Based on the price structure, I identify two attractive accumulation levels: 0.014 and 0.011.
However, it is critical to emphasize that these zones are suited for a short-term relief rally, not for initiating a full-fledged bullish wave. Since these are futures trades, applying tight stop-loss management is essential before entering any position.
Let’s keep the discussion open and evaluate how this setup unfolds.