An Exhaustive Analysis of Financial Market GapsAn Exhaustive Analysis of Financial Market Gaps: Mechanics, Psychology, and Advanced Trading Applications
● Part I: The Foundational Architecture of Price Gaps
The study of financial markets is, in essence, the study of price action. While much of this action is continuous, with transactions creating a seamless flow of data, there are moments of abrupt discontinuity that appear on price charts as voids or empty spaces. These phenomena, known as price gaps, are not mere charting curiosities; they are powerful signals that reveal profound shifts in the equilibrium between supply and demand, offering a unique window into market psychology and future price direction. Understanding the architecture of these gaps—their definition, their classification, and the complex web of factors that cause their formation—is a prerequisite for any sophisticated market participant seeking to interpret and navigate market dynamics effectively.
• Section 1: Defining the Phenomenon
At its most fundamental level, a price gap represents a range of prices at which no trades have occurred. This visual discontinuity on a price chart signifies a sudden and significant jump in an asset's price, where the opening price of one trading period is markedly different from the closing price of the preceding period.
• 1.1. The Anatomy of a Price Gap: Visual and Technical Definitions
A price gap, also referred to as a "window" in Japanese Candlestick charting, is a term used to describe a discontinuation in a price chart. Visually, it appears as an empty space between two consecutive trading periods, most commonly observed on daily bar or candlestick charts. The formation of a gap indicates that the market's perception of an asset's value has changed so dramatically that it bypasses a range of prices entirely.
• 1.2. A Taxonomy of Gap Formations: Full vs. Partial Gaps
Not all gaps are created equal in their structure or implications. This distinction gives rise to two main categories:
Partial Gap: Occurs when the opening price of the current session is higher or lower than the previous session's close, but still falls within the trading range (high and low) of that previous session.
Full Gap: Occurs when the opening price is completely outside the prior day's entire trading range.
• Section 2: The Genesis of Gaps: Causal Factors and Market Dynamics
Price gaps are the tangible result of a confluence of fundamental, technical, and market microstructure factors.
• 2.1. Fundamental Catalysts
Corporate Earnings Reports: Quarterly earnings reports are the most regular and potent catalysts for individual stocks.
Major News Events: Mergers, acquisitions, product launches, or regulatory changes.
Macroeconomic Data: GDP figures, CPI inflation reports, and interest rate decisions.
• 2.2. Technical Precursors
Support and Resistance Breakouts: A gap through a well-established level is a particularly powerful technical event.
Chart Pattern Completion: Gaps frequently serve as the confirmation signal for patterns like the cup and handle or head and shoulders.
Algorithmic Trading: Automated systems can exacerbate gaps when specific technical conditions are met.
● Part II: A Comprehensive Typology of Market Gaps
The ability to correctly classify a price gap is the most critical step in its analysis. Different types of gaps have vastly different implications for future price action.
• Section 3: The Four Archetypal Gaps: A Deep Dive
• 3.1. The Common Gap (or Trading/Area Gap)
Common Gaps are typically small in magnitude and characterized by normal or below-average trading volume. They usually appear within a sideways trading range and tend to be "filled" relatively quickly, often within a few days.
• 3.2. The Breakaway Gap (or Power Gap)
Signifies a decisive and forceful end to a period of consolidation.
Volume: Must be accompanied by a massive surge in trading volume (ideally 50% or more above the 50-day average).
Significance: Low probability of being filled in the near term; the gap area often transforms into a new support or resistance level.
• 3.3. The Runaway Gap (or Continuation/Measuring Gap)
Occurs in the middle of a well-established trend and signals that the prevailing momentum is strong. It is often driven by "FOMO" (Fear of Missing Out).
• 3.4. The Exhaustion Gap
Occurs near the end of a mature trend. The single most important feature is climactic trading volume . This represents the peak of emotional intensity, often followed by a rapid reversal and a high likelihood of the gap being filled.
• Section 4: Advanced and Specialized Gap Patterns
• 4.1. The Island Reversal
A distinctive and highly reliable chart pattern where a cluster of price bars is isolated by gaps on both sides. It represents a dramatic shift in market sentiment and is one of the strongest reversal signals in technical analysis.
• 4.2. Fair Value Gaps (FVG) and Liquidity Voids
An institutional perspective identifying market inefficiencies. An FVG is a three-candle pattern where the wick of the first and third candle do not overlap. Unlike breakaway gaps, FVGs are viewed as "magnets" that price will likely return to in order to rebalance liquidity.
● Part III: The Human Element and Empirical Realities
• Section 5: The Behavioral Science of Gaps
Irrational Exuberance: Drives bullish exhaustion gaps where optimism overrides fundamentals.
Panic and Capitulation: Drives downside exhaustion gaps at the end of a downtrend.
Herd Behavior: Amplifies price shocks as traders follow the collective crowd, often leading to initial overreactions.
"Breakaway, Runaway, and Exhaustion gaps are foundational technical formations rooted in crowd psychology and trend lifecycle stages. Conversely, the Fair Value Gap (FVG) is an institutional metric designed to identify price inefficiencies. While analytically distinct, these frameworks often converge within the same price action event, providing a dual perspective on market dynamics."
• Section 6: Statistical Analysis of the "Gap Fill"
The popular adage that "all gaps get filled" is an oversimplification.
Common/Exhaustion Gaps: Fill probability of 75-90%.
Breakaway Gaps: Fill probability of 35-65%.
Volume Impact: Gaps on low volume are 85% likely to fill within two sessions.
● Part IV: Application and Strategy
• Section 7: Strategic Frameworks for Gap Trading
Momentum-Based ("Gap and Go"): Trading with the gap. Best for Breakaway and Runaway gaps.
Mean-Reversion ("Fading the Gap"): Trading against the gap. Best for Common and Exhaustion gaps.
• Section 8: The Indispensable Role of Confirmation
Volume Spread Analysis: High volume validates breakaway gaps; climactic volume confirms exhaustion.
Momentum Oscillators (RSI, MACD): Identify divergences that suggest a gap might be exhausting rather than continuing.
Volatility Indicators (ATR): Used to set intelligent stop-losses based on the asset's specific character.
• Section 9: Advanced Risk Management
The single greatest danger in holding positions overnight is Gap Risk—the risk that price opens far beyond a pre-set stop-loss, causing significant slippage.
To manage this risk:
Avoid known catalysts (earnings).
Reduce position size during high-volatility weeks.
Use protective options (hedging).
● Part V: A Cross-Market Perspective
• Section 10: Comparative Gap Analysis Across Asset Classes
Equities: Daily gaps due to session closures; earnings are the primary driver.
Forex: Weekday gaps are rare; weekend gaps are the primary focus.
Commodities: Sensitive to supply shocks and interplay between global exchanges (CME vs LME).
Cryptocurrencies: Spot markets are 24/7 (no gaps), but CME Bitcoin Futures Gaps act as powerful price magnets with high fill rates.
● Part VI: Synthesis and Concluding Insights
• Section 11: Integrating Gap Analysis into a Holistic Market Framework
Effective gap analysis requires that:
Diagnosis Precedes Treatment: Classify the gap before selecting a strategy.
Volume is the Arbiter of Truth: It is the physical manifestation of market conviction.
Analysis is Probabilistic: There are no certainties, only shifts in likelihood based on context.
The study of price gaps remains one of the most compelling disciplines in financial markets, offering a record of collective emotion and a lens into market discovery.
Imbalances

NQ Price points im looking at for reversals or continuationsReversal: Sweep HTF LiQ + Breakaway gap + BRKR + Revisit = Entry
Continuation: Closure above 25,936 + MTF CISD + IMRB/IOFED + LTF OB respected = Entry
DRH- 26220.75
75DRT-25936.75
DRE- 25652.75
25DRT- 25368.75
(close of 25147.50)
DRL- 25084.50
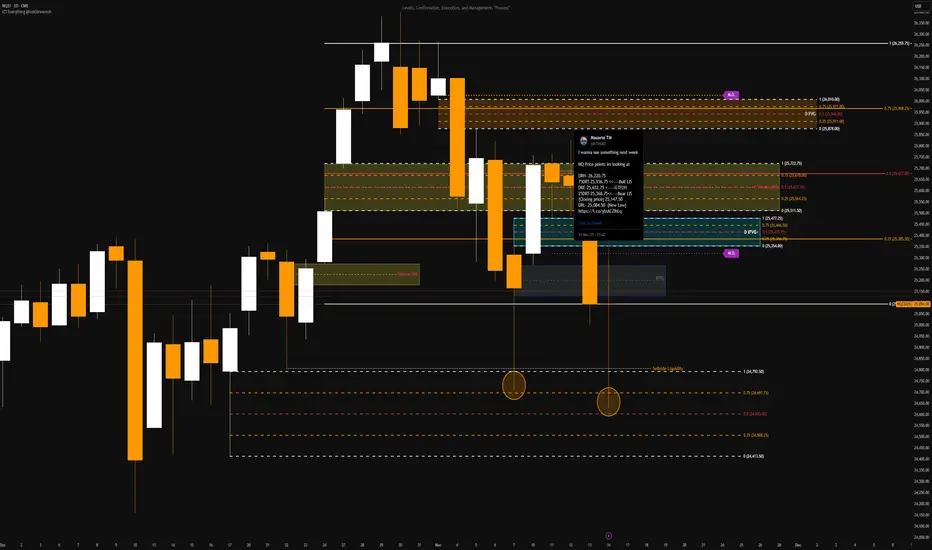
we might continue dropping daily hidden divergence, price might want to continue seeking sell side liquidity
4hr is making a new low and taking out old lows (sell side liquidity) to the left MACD is not converging as of yet
1hr hbrsh-div price is dropping ahead of red news this Friday, could head to 1hr old low or weekly low, waiting to see how price reacts to news
m15 price is below POC of previous NY session POC, as well as overnight Asian and London session converging nicely ahead of news I would favor price reacting short-term from m15 bearish imbalance before reaching the lows around the NY open after news but we will see

Overall Bullish on NXT ASX Currently in PubllBack phase overall im Bullish on NXT. i mainly trade forex using IMB'S on timeframes such as monthly weekly daily 4h and 1H. but nxt we need to look at longer term time frames like 12months, 6 months and 3 months. and i potentially see we are pulling back to the break of the 6month and 12month
once we tap these areas of interest we go down even lower to see a shift in market structure and Order flow. i dont really see price going lower then $12.53. we have just over 3 months left until a new 6 month candle is created which is when we could possibly see bullishness kick in again

EURAUD BUY SETUP1️⃣ Demand Zone Reaction
The price is currently in a clearly defined demand zone, where we’ve seen strong buying interest in the past. This zone has already shown signs of holding support, making it an ideal area to look for a long position.
2️⃣ Volume Profile Confirmation
The volume profile shows increased activity near the demand zone, indicating significant interest from buyers in this area.
3️⃣ Fibonacci Confluence
The demand zone aligns with the golden pocket area (61.8%–78.6%) of a Fibonacci retracement, adding strength to this level.
4️⃣ Bullish Momentum Potential
There are signs of rejection from lower levels, with wicks and candles showing hesitation in breaking lower, suggesting bullish momentum may build from here.
5️⃣ Liquidity Grab
The price recently swept the lows, grabbing liquidity from weak hands before a potential move to the upside.
Trade Plan:
Entry: 1.61900 (current demand zone).
Stop Loss: 1.61600 (below the demand zone and liquidity sweep).
Take Profit Levels:
TP1: 1.62500 (local resistance).
TP2: 1.63000 (higher timeframe resistance zone).
Bias:
The overall market structure remains bullish, with price expected to continue upward after this retracement.
Reminder:
Always manage your risk. Use proper position sizing and wait for confirmations if needed.

Update on teslaHi, quick update.
i do want to update some bearish technical scenerios that align with liquidity concepts. (neither bullish or bearish idea is 100% to occur and its important to prepare to all scenerios)
The latest test on demand was not what i was hoping to see. with prices making bad lows (confirm on TPO) and creating a liquidity pool, showing a lack of strength (market moves on the path of least resistance) from buyers(volume is low market shows uncertainty around current price).
We have a gap down (green rectangle) and bad lows, the last imbalances on the chart at 199.48 (if we dont consider the aug 5 bad lows duo to the japanese sell off)
These will hit stop losses and reset highly leveraged positions and most importantly will provide wallstreet a premium price on tsla shares.
That price aligns with targets from both bearish and bullish sides. as of now we are holding the daily 100 ema
the 200 EMA is 201 and the yearly VWAP is also confluencing with that EMA. SHOCKING!
If we are at the parliamentary supply a selling climax will follow.. and the target for it would close the imbalance and the gap would provide us a good low to buy from and grab upside liquidity if not break resistance finally.
in terms of RSI a sell off to that area will give us an oversold RSI on the daily and hit the orderblocks down there!
I am still bullish on tesla but acknowledging these bearish scenerios will help up understand what is happening if they happening. I closed my CFD position in tiny profit but i am still keeping my value investment on and havent sold a bit.
I will happily go further down and give myself a nice CFD trade on tesla from these price targets.!
This is not a financial advice but simply me sharing my ideas and journaling my investments and trading. I hope you all have a great day
I AM STILL BULLISH
THERES A REASON WHY THEY ARE CALLED SHORTS (SHORT TERM) AND LONGS (LONG TERM)

payo are you gonna correct?after the great boom payo brought us some great profits. tbh i havent closed anything and i am still bullish on payo.
payo accumulation and bingbongdingdong has been formed for 3 years as of this moment we are attempting to turn previous critical resistance into support.
2 scenerios according to wykoff theory.
1. correction then big money needs to defend its positions and at a reasonable price.
fundementally that could be previous value area high (vah upper white line) because we need to create a new value range it would only make sense to turn vah to the new point of control (poc) or the new value area low (where price is traded the most e.g mid range val bottom area)
another point to consider for the correction is the gap, so previous point of control to turn value area low or a sweep to that level would provide 4 things
first it will close the gap and get rid of that imbalance.
2nd it will shake off weak hands and get rid of breakout traders when it
grabs the single print
3rd it will provide a decent price for big money to enter at.. liquidity liquidity liqduidity.
4th provide the oprotunity for hedge shorting and basically thats more fuel to the upside when said shorts close. (so basically proffesionals get paid to pump the market for free)
2. leave everyone behind everyone whos waiting for the correction. that scenerio is less likely to anticipate, depends more on the company preformance and has less upside for big money that wants to accumulate low and provide big gains.
i believe the first scenerio is more likely that the other one.
the teal circles on the green lines are where i am looking to see reactions for swing fail patterns and adding to my positions
luckily i already have an open position on payo for quite a while now, so im chilling.

LETS SEE.... #GBPUSD HARMONIC SHARK SHORT IDEAAwaiting this idea potentially happen, I see an ABC pattern form and begin to connect the dots in hindsight... ill wait to see how this unfolds not an active trade until my confluences confirm

GBPUSD To Keep Pricing Lower We've had a large range expansion we're retracing into, FOREXCOM:GBPUSD is to offer repricing below 1.21839

Unlocking the Secrets of Price Inefficiency: Dive Deep into FVG👑Price inefficiencies are also known as imbalances, gaps or voids. Healthy price action moves in a zigzag fashion, making highs and lows in line with the directional bias at any given moment. When price isn’t trending we find it consolidates, in which case highs lows are still being made. However, we may also see price move in straight lines with huge volume and momentum. When this happens, price finds itself unable to deliver price in an efficient manner. For example, in a bullish environment, price may continue to make higher highs without providing higher lows at a discount price. When price moves with this much momentum, it leaves behind imbalances.
🟠An imbalance can be identified by open space in price action, where the wicks on either side of a candle do not match each other. On the left is an example of price inefficiency, since the wick high of candle 1 does not meet the wick low of candle 3, leading to an imbalance on candle 2.
🟠This is an example of healthy price action with no imbalances. This is because all candles have wicks on either side of them. Since wicks were bodies during live price action and are bodies on lower time frames, this shows that price was delivered efficiently to buyers and sellers in this area. Whereas the example above shows an imbalance on a bullish candle, which shows that price was only available to buyers in that imbalance and therefore is not efficient.
👉For price to be efficient, it needs to be delivered to buyers and sellers. This helps us understand that in our original bullish imbalance, price has to come back and fill that imbalance using bearish price action in order to make that price available to sellers. This re-balancing could take hours, days, weeks or years, but it is our job to understand that it must happen at some point. Inline with the rest of the strategy, we can use this knowledge to pick out the specific imbalances that will be filled and how we can capitalise on this.
🟠This is an example of the correctly identified imbalance and where we expect price to react from
🟠This is an example when is our level being met, it is at this point that we use the rest of the strategy and knowledge to capitalise on the move that is about to unfold with high risk:reward entries.
🟠This is the completion of this particular market cycle, with our level being respected and price giving us a nice bullish leg.
🔴Bearish Order Flow:
🟢Bullish Order Flow:

USDCHF London Open April 26thAggressive setup on USDCHF on London Open liquidity grab, bullish market structure. This setup is seen as aggressive because we have important imbalances below not filled yet. We aim for a fixed risk-to-reward in this case (1:3)

XAUUSD | Trade Idea The XAU/USD pair shows a weak growth, again testing the psychological level of 2000.00 for a breakout. At the end of last week, gold quotes showed a sharp decline, retreating from their record highs of March 2022, falling under the influence of technical factors and a new phase of strengthening of the US currency. In addition, traders expect further tightening of monetary policy by the world's central banks in early May. In particular, the US Federal Reserve, the European Central Bank (ECB) and the Bank of England are likely to raise interest rates again. The pressure on the position of gold is also exerted by the fact of the growth in the yield of US Treasury bonds: the 10-year bonds corrected the day before from 3.522% to 3.595%. Today, the focus of investors will be American statistics on the dynamics of Housing Starts in March, where forecasts suggest a slowdown from 1.45 million to 1.40 million, and the Housing Starts Change may fall from 9.8% to 0.4%.

GBPJPY POTENTIAL BUYPrice reversed from a HTF demand zone and formed potential higher highs and higher low. Price has potential to move higher from the retest of the demand zone. Look at LTF confirmations to confirm the move.

GBPUSD i just want tell you that i put all the home work. level. optimal trade entry levels. look for the level.. price reaction ,


US30 BUY TO SELL MODELPrices took a short term high, giving us a shift in market structure, looking for pullback into a bullish order block or imbalance for a potential long entry. We are going to look for a fill of the sell-side imbalance.

⁉️ What is an Imbalance?‼️ Imbalances are also known as inefficiencies or FVG (Fair Value Gaps) these are periods in price action whereby means of lopsided order flow, which create porous wakes or gaps in fills. The market will slip to the only available trade levels as a result of thin liquidity and these voids in liquidity will be revisited at a later stage. The market will seek to fill in any missing gaps or missed levels on a trade. Impulse price swings are typically seen with this voids in liquidity. In simple terms imbalances are gaps in the market and the market will always seek in to close or fill those gaps.

USDOLLAR Long Setup!USDOLLAR: market has been developing in a falling channel but managed to break to the upside recently. We have a beautiful retest on a resisting channel line, I am expecting this instrument to launch to 13050$ and possibly form a gartley pattern

Ape Imbalance Fill Area 50% awayImbalances are area where price tends to return. Not always but very likely. The difficulty is waiting it out. Price action could dip for months before coming back to fill the area target. The total market structure determines the time frame.

NZD/JPYPossible entry could be a retracement on the daily candle and then have it push to the downside to fulfill imbalances in the daily candles. Should we have a break past our stop loss we re-look entry points for a bearish trendline

EURUSD ShortFX:EURUSD
republished(originally got stopped out)
-arrows are 1h imbalances/inefficiencies
-15m supply and demand are entry and exit

⁉️ How to identify imbalances? ‼️ Imbalances are also known as inefficiencies or FVG (Fair Value Gaps) these are periods in price action whereby means of lopsided order flow, which create porous wakes or gaps in fills. The market will slip to the only available trade levels as a result of thin liquidity and these voids in liquidity will be revisited at a later stage. The market will seek to fill in any missing gaps or missed levels on a trade. Impulse price swings are typically seen with this voids in liquidity. In simple terms imbalances are gaps in the market and the market will always seek in to close or fill those gaps.

EURUSD SMC analysisDue to the increase in interest rates of the FEDS, the USD has gain value and therefore everything that is base to the USD went short. This is just a quick demonstration of the precision of SMC.
