DXY LOCAL LONG|
✅DXY reacts from a higher-timeframe demand zone after strong bearish displacement. Sell-side liquidity likely absorbed, opening room for a corrective bounce toward the marked imbalance. Time Frame 4H.
LONG🚀
✅Like and subscribe to never miss a new idea!✅ [/b
Index

DXY FREE SIGNAL|SHORT|
✅DXY rejection from premium supply with bearish displacement confirms ICT distribution. Price taps equilibrium, fails to reclaim range high, favoring continuation toward sell-side liquidity below.
—————————
Entry: 98.67
Stop Loss: 98.86
Take Profit: 98.40
Time Frame: 4H
—————————
SHORT🔥
✅Like and subscribe to never miss a new idea!✅

DXY Free Signal! Sell!
Hello,Traders!
DXY Breakdown below a key equilibrium shows smart money distribution after a failed reclaim. Bearish displacement suggests continued sell-side delivery toward resting liquidity below.
--------------------
Stop Loss: 98.87$
Take Profit: 98.26$
Entry: 98.62$
Time Frame: 5H
--------------------
Sell!
Comment and subscribe to help us grow!
Check out other forecasts below too!
Disclosure: I am part of Trade Nation's Influencer program and receive a monthly fee for using their TradingView charts in my analysis.

Dow Jones Free Signal! Buy!
Hello,Traders!
US30 Price trades into a well-defined demand zone after a sharp displacement lower, collecting sell-side liquidity. Strong reaction from this base hints at smart money accumulation and a potential upside continuation.
--------------------
Entry: 48,888
Stop Loss: 48,724
Take Profit: 49,123
Time Frame: 5H
--------------------
Buy!
Comment and subscribe to help us grow!
Check out other forecasts below too!
Disclosure: I am part of Trade Nation's Influencer program and receive a monthly fee for using their TradingView charts in my analysis.

DXY - Trend Shift Confirmed...I’ve been watching DXY closely, and this move matters.
After a prolonged bearish phase, price broke above the orange resistance, and that’s where the bias shifted. What was resistance is now acting as support, and that’s a key change in behavior.
Right now, DXY is pulling back into that same orange zone, which lines up perfectly with the lower trendline of the rising structure. That confluence is what matters.
As long as this support holds , I’ll be looking for trend-following long setups, staying aligned with the new bullish momentum rather than fighting it.
⚠️ Disclaimer: This is not financial advice. Always do your own research and manage risk properly.
📚 Stick to your trading plan regarding entries, risk, and management.
Good luck! 🍀
All Strategies Are Good; If Managed Properly!
~Richard Nasr

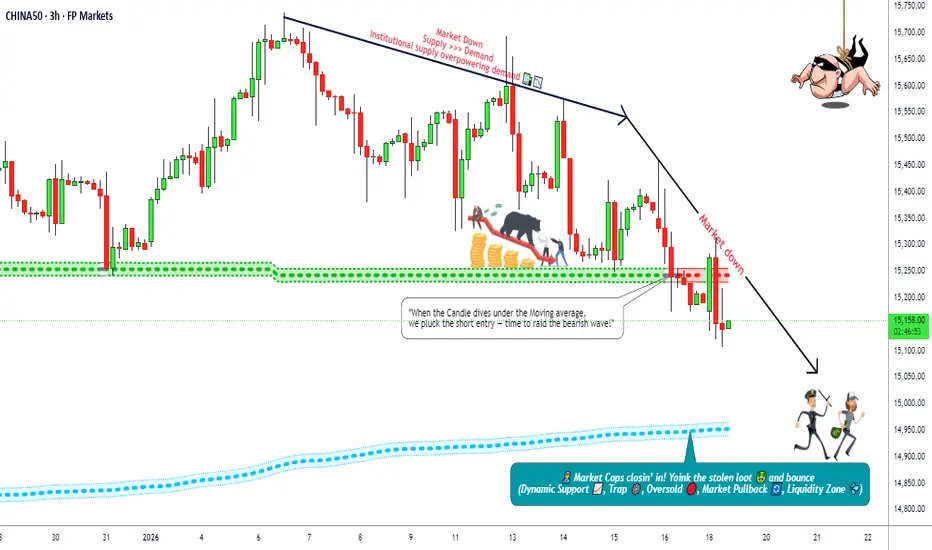
China A50 Market Analysis | Downtrend Confirmation🔥 China A50 (CHINA50) Short Bias Set-up | MA Breakout Confirmed 📉 + Correlation Watchlist + Macro Fuel
📌 DESCRIPTION — Pro Traders + OGs Only 🔓
Market: China A50 Index CFD (Trading Benchmark — top 50 A-shares listed Shanghai & Shenzhen).
Timeframe: Day / Swing Trade
🧠 TRADE STRUCTURE 📊
📉 Bias: Bearish — Confirmed MA Breakout (Price cracked dynamic zone)
🎯 Entry: Any logical price break / retest — flexibility preferred
🛑 Stop Loss:
“Thief SL” @ 15400 — Risk Protect Zone (manage risk, not hope)
📍 Target:
First Profits: ~14950 zone — confluence with dynamic support fade
(Remember: price can overshoot; scale profit taking)
🔥 RISK DISCLOSURE
Dear Ladies & Gentlemen (Thief OG’s) — this is trade guidance only. Set your own SL/TP based on your risk tolerance — not only mine. Trade smart, take profits, protect capital.
📌 PAIRS & CORRELATIONS TO WATCH 👀
Strong / relevant correlations with China equity sentiment:
• USD/CNH — rising USD against CNH usually pressures Chinese equities
• CSI 300 / HSI — if broader China large caps weaken, A50 often follows
• ASX200 / Hang Seng Tech — regional risk appetite bleed confirms gravity
• AUD/JPY / Nikkei 225 — Asia risk proxy; risk-off often means equities slide
Why watch these? Greater macro forces ripple across Asian/China markets and confirm momentum.
📊 FUNDAMENTAL & ECONOMIC CONTEXT (Latest + Upcoming)
🔎 China growth slowing but resilient: GDP forecast ~4.8% in 2026 (slightly below last year) with export strength supporting macro growth.
📈 Tech & ETF flows — institutions increasing exposure, tech earnings gaining momentum — positive undercurrent.
🏙️ Domestic weakness + property drag — ongoing property price declines and weak consumption could weigh on broader sentiment.
📰 Market oversight tightened — regulators vow stricter supervision to curb speculative excess; margin requirements rising.
⏰ Upcoming Macro Drivers:
✔ PMI/services releases
✔ China trade data (exports/imports)
✔ PBOC policy stance — interest rate / RRR actions
✔ US macro (PPI/CPI) impacting China export demand via currency flows
🛠 TECHNICAL EDGE
✔ MA breakout suggests bleeding momentum
✔ Dynamic MA acts as pseudo resistance
✔ Oversold zones + trap signals warrant profit realization
✔ Risk clusters / support confluence near target zone
📌 NEWS IMPACT SUMMARY (London Time)
• China met growth targets despite challenges, but domestic demand remains weak.
• Property sector softness risking broader economic drag.
• Regulatory tightening to curb speculation could pressure markets.
(All news interpreted in London time market context.)
🔔 LESSON IN A LINE
Price respects structure more than direction — trade levels with confirmation, not emotions.
Nikkei 225 - Looking for Completion LevelsCounting waves and assessing technical potential. Here’s what we see:
March 2009 - January 2018 - Wave 1 (range ≈ 17,400)
January 2018 - March 2020 - Wave 2
March 2020 - July 2024 - Wave 3 (range ≈ 26,100)
July 2024 - April 2025 - Wave 4
April 2025 - present - Wave 5 (already advanced ≈ 23,500)
Breaking down the current fifth wave:
We are also forming a fifth sub-wave within it.
Most probable targets for wave completion:
58,400
60,200
or within this range
Estimated upside potential from current levels: 8 - 12 %.
---
Please subscribe and leave a comment!
You’ll get new information faster than anyone else.
---

DXY Free Signal! Buy!
Hello,Traders!
DXY has delivered a strong SMC breakout from the horizontal demand, confirming a bullish shift in market structure. Clean displacement and follow-through show aggressive buy-side control, with prior sell-side liquidity fully absorbed. Continuation toward higher liquidity pools remains favored.
--------------------
Stop Loss: 99.160
Take Profit: 99.599
Entry: 99.343
Time Frame: 5H
--------------------
Buy!
Comment and subscribe to help us grow!
Check out other forecasts below too!
Disclosure: I am part of Trade Nation's Influencer program and receive a monthly fee for using their TradingView charts in my analysis.

DXY FREE SIGNAL|LONG|
✅DXY breaks above a key resistance with strong bullish displacement, confirming an ICT market structure shift. Price accepts above the reclaimed zone, signaling continuation strength rather than a false breakout. Upside expansion toward premium liquidity remains favored.
—————————
Entry: 99.32
Stop Loss: 99.15
Take Profit: 99.58
Time Frame: 6H
—————————
LONG🚀
✅Like and subscribe to never miss a new idea!✅

US100 Will Go UP! Buy!
Hello, Traders!
US100 pulls back into a proven demand zone after a sharp sell-off. Selling pressure weakens at lows, hinting at accumulation and a potential rebound toward higher liquidity. Time Frame 6H.
Buy!
Comment and subscribe to help us grow!
Check out other forecasts below too!
Disclosure: I am part of Trade Nation's Influencer program and receive a monthly fee for using their TradingView charts in my analysis.

DXY PULLBACK AHEAD|SHORT|
✅DXY went up just as we predicted in our previous analysis but now the pair is reacting from a strong supply area so we will be expecting a local bearish correction!
SHORT🔥
✅Like and subscribe to never miss a new idea!✅

DXY WILL GROW|LONG|
✅DXY retraces into a well-defined higher-timeframe demand after a strong bullish impulse. Holding above this zone suggests bullish continuation, with internal liquidity resting higher likely to be targeted after consolidation. Time Frame 5H.
LONG🚀
✅Like and subscribe to never miss a new idea!✅

Dow Jones Industrial Average H1 HTF FVG Support and Continuation📝 Description
CAPITALCOM:US30 is holding above a higher-timeframe H4/H1 demand zone after a corrective pullback from recent highs. Price respected the BPR and FVG support area and is now stabilizing, suggesting the move is corrective rather than a trend reversal.
________________________________________
📈 Signal / Analysis
Primary Bias: Bullish while price holds above the H1 BPR.
Preferred Setup:
• Entry: 49,130
• Stop Loss: Below 49,050
• TP1: 49,240
• TP2: 49,380
• TP3: 49,520 (HTF draw / higher liquidity)
________________________________________
🎯 ICT & SMC Notes
• Reaction from H4/H1 BPR confirms valid demand
• No bearish HTF BOS observed
• Upside liquidity above recent highs remains the primary draw
________________________________________
🧩 Summary
Dow Jones Industrial is consolidating above key HTF support after a controlled retracement. As long as price remains above the identified demand zone, the expectation favors continuation toward higher liquidity levels in line with the prevailing bullish bias.
________________________________________
🌍 Fundamental Notes / Sentiment
Overall risk sentiment remains supportive for equities, with no immediate macro catalyst signaling aggressive risk-off behavior. In this environment, pullbacks into HTF demand are more likely to resolve as continuation moves rather than deeper trend reversals.
________________________________________
⚠️ Risk Disclosure
Trading involves substantial risk and may result in capital loss. This analysis is for educational purposes only and does not constitute financial advice. Always apply proper risk management, predefined stop-loss levels, and disciplined position sizing aligned with your trading plan.

DAX BULLISH BREAKOUT|LONG|
✅DAX Price has delivered a clean bullish displacement above a key ICT level, confirming breakout strength. Previous resistance flips into support, with momentum aligned toward higher buy-side liquidity and continuation higher. Time Frame 9H.
LONG🚀
✅Like and subscribe to never miss a new idea!✅

DAX Free Signal! Buy!
Hello,Traders!
DAX breaks and holds above a key horizontal demand, confirming bullish market structure. Smart money displacement and clean BOS suggest continuation toward higher liquidity, with pullbacks likely to be shallow before expansion resumes.
--------------------
Entry: 24,493
Stop Loss: 24,361
Take Profit: 24,684
Time Frame: 4H
--------------------
Buy!
Comment and subscribe to help us grow!
Check out other forecasts below too!
Disclosure: I am part of Trade Nation's Influencer program and receive a monthly fee for using their TradingView charts in my analysis.

DAX WILL KEEP GROWING|LONG|
✅DAX breaks above a key supply zone, confirming bullish ICT market structure. Acceptance above prior highs signals smart money continuation, with upside expansion likely toward premium liquidity after a brief consolidation. Time Frame 8H.
LONG🚀
✅Like and subscribe to never miss a new idea!✅

US100 FREE SIGNAL|LONG|
✅US100 has swept sell-side liquidity into a clean discount demand zone, followed by strong bullish displacement. Structure is holding with inefficiency below, suggesting smart money accumulation and continuation toward buy-side liquidity at the highs.
—————————
Entry: 25,484
Stop Loss: 25,366
Take Profit: 25,654
Time Frame: 6H
—————————
LONG🚀
✅Like and subscribe to never miss a new idea!✅

DXY BEARISH BIAS|SHORT|
✅DXY remains bearish after respecting falling resistance. Price failed to reclaim structure in premium, with buy-side liquidity already taken, favoring continuation lower toward resting sell-side liquidity below. Time Frame 6H.
SHORT🔥
✅Like and subscribe to never miss a new idea!✅

DXY dollar index YEARLY ANALYSISDXY or Dollar index suggestets that it is in a very critical position. and movement to the up or down will be a breakout.

VanEck Africa Index ETF: A Momentum Play Worth MonitoringThe VanEck Africa Index ETF (AFK) has been performing well over the last year. Nice and steady gains with a recent pullback that could be a good watch for an entry. Over the past year, the fund has delivered a 71% gain and this persistent upward trajectory, including a 33% rise over the last six months , suggests a sustained trend rather than a short-term price spike.
What makes this movement notable is the supporting volume, which has recently been running at roughly 210% of its 50-day average . This level of activity often points toward institutional accumulation. On the fundamental side, the outlook for the region is being shaped by significant cross-border investments, such as a recent 1-billion-dollar commitment from the UAE toward AI development in Africa. This shift toward technology and infrastructure may be providing a fresh catalyst for a region traditionally tied to commodities.
For those who like upward trending assets with great momentum, the current technical profile presents an interesting setup. After a strong run, the ETF has undergone a mild 2.5% pullback , allowing the RSI to settle near 60. This cooling-off period has moved the price into a potentially better value area, while still remaining comfortably above both the 50-day and 200-day EMAs and the overall price action remains firmly in a bullish structure.
For traders who prioritize established trends, AFK could be worth a watch.

DAX LOCAL SHORT|
✅DAX trades into a clear premium supply zone after buy-side liquidity was taken. Weak bullish follow-through and rejection signal smart money distribution, favoring a downside expansion toward internal liquidity. Time Frame 8H.
SHORT🔥
✅Like and subscribe to never miss a new idea!✅

JPYBASKET/ JPY index approaching major levelJPY index is approaching long forgotten level and its more likely to react from there or at least the probability is higher from the normal. I will post some JPY pairs and what I'm currently waiting-->

SNP500 Review December 24 2025Short-term price movement ideas.
Price has filled the nearest weekly long FVG, which builds a context for a potential high break.
After the FVG fill, we received confirmations on the daily timeframe in the form of multiple FVGs, which currently act as the main areas of interest.If price revisits one of these daily POIs and provides confirmation on the 4H timeframe, further upside movement can be expected, targeting a new high.
After the weekly high sweep, price behavior should be monitored closely.
If there is no meaningful reaction to the sweep and price continues to push higher, the market may proceed toward all-time highs.
However, if we see an aggressive reaction and a pullback below 6800, followed by a clear acceptance below this level, a deeper correction may follow.
Be flexible, adapt to the market, and the results will come quickly. Good luck to everyone.
