NIKKEI Rebound Ahead! Buy!
Hello,Traders!
NIKKEI is trading in a
Strong uptrend and the
Index is making a retest
Of the horizontal support
Level of 42,138 from where
We will be expecting a local
Bullish rebound
Buy!
Comment and subscribe to help us grow!
Check out other forecasts below too!
Disclosure: I am part of Trade Nation's Influencer program and receive a monthly fee for using their TradingView charts in my analysis.
Index

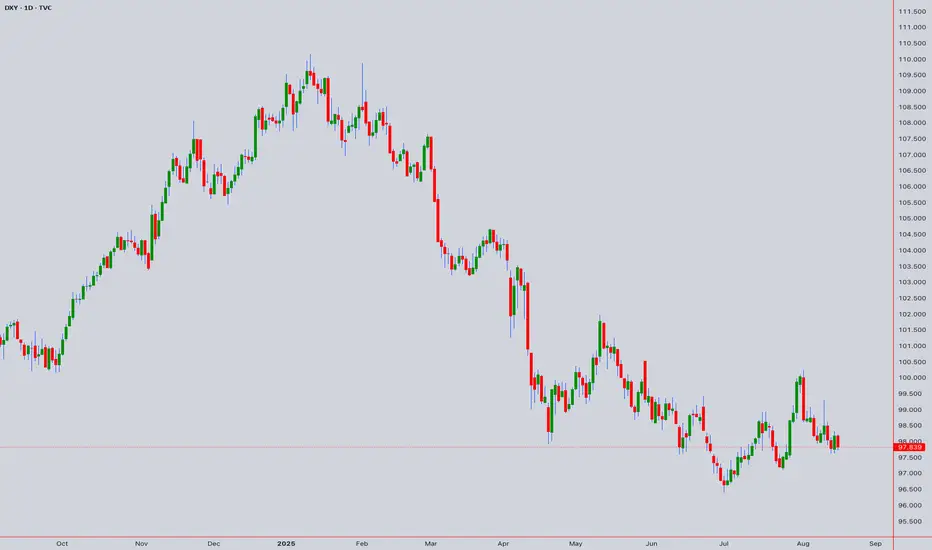
# DXY (US Dollar Index) Technical Analysis & Forecast# DXY (US Dollar Index) Technical Analysis & Forecast
**Base Price:** 97.839 (August 16, 2025 - 12:55 AM)
## Executive Summary
The DXY at 97.839 shows the USD in a consolidation phase near key technical levels. Multiple analytical frameworks converge around critical support/resistance zones, suggesting an imminent directional breakout within the next trading sessions.
## Japanese Candlestick Analysis
### Intraday Patterns (5M-1H)
- **Current Formation:** Doji-like indecision around 97.85 level
- **Key Reversal Zones:** 97.50 (Hammer potential), 98.20 (Shooting Star zone)
- **Momentum Candles:** Watch for Marubozu above 98.00 or below 97.60
- **Evening Star Setup:** Three-candle reversal pattern completion around 98.15
- **Morning Star Potential:** Bullish reversal signal near 97.45 support
### Swing Patterns (4H-Monthly)
- **Engulfing Patterns:** Critical at 98.50 weekly resistance and 97.00 monthly support
- **Harami Cross:** Indecision pattern suggesting range-bound action
- **Piercing Line/Dark Cloud:** Key reversal patterns at major S/R levels
- **Three White Soldiers:** Bullish continuation above 98.00
- **Three Black Crows:** Bearish breakdown below 97.50
## Harmonic Pattern Analysis
### M & W Formations
- **Double Top (M):** Resistance confluence at 98.80-99.00 zone
- **Neckline:** Critical break level at 97.25 for M-pattern completion
- **Double Bottom (W):** Support structure around 96.50-96.80
- **W-Pattern Target:** Bullish objective at 99.20-99.50 on completion
- **Measured Move:** M-top target 96.00, W-bottom target 99.00
### ABCD Pattern Analysis
- **Bullish ABCD:** Current structure suggests C-point at 97.20, D-target 99.80
- **Bearish ABCD:** Alternative count with D-wave completion at 96.20
- **AB=CD Equality:** Time and price symmetry around 98.25 pivot
- **Extension Ratios:**
- 127.2% extension at 99.45
- 161.8% extension at 100.20
- 200% extension at 101.50
## Elliott Wave Analysis
### Primary Count
- **Current Position:** Wave 4 correction of larger degree impulse from 94.50
- **Wave Structure:**
- Wave 1: 94.50 → 96.80
- Wave 2: 96.80 → 95.20
- Wave 3: 95.20 → 98.90
- Wave 4: 98.90 → 97.20 (current)
- Wave 5 Target: 100.50-101.20
### Alternative Count
- **ABC Correction:** Large degree correction from 105.00 highs
- **A-Wave:** 105.00 → 100.80
- **B-Wave:** 100.80 → 99.20 (current)
- **C-Wave Target:** 94.00-95.50
### Time Projections
- **Wave 4 Completion:** 3-5 trading days
- **Wave 5 Duration:** 8-13 days
- **Cycle Completion:** 21-34 days
## Wyckoff Analysis
### Market Structure
- **Phase:** Late accumulation or early distribution
- **Trading Range:** 97.00-99.00 (established range)
- **Point of Support (PS):** 97.20 level
- **Secondary Test (ST):** Current price action around 97.85
- **Sign of Strength (SOS):** Break above 98.50 with volume
- **Last Point of Support (LPS):** Final test around 97.40
### Volume Characteristics
- **Accumulation Signals:** High volume on declines, low volume on rallies
- **Distribution Signals:** High volume on rallies, climactic action above 98.50
- **No Demand:** Weak rallies with declining volume
- **Stopping Volume:** Heavy volume at support levels
## W.D. Gann Theory Analysis
### Time Theory
- **Natural Cycles:** 30, 60, 90, 120-day cycles active
- **Anniversary Dates:** Previous major highs at 105.00 (time squares)
- **Seasonal Pattern:** USD strength typically in Q3-Q4
- **Time Windows:**
- Minor: 7-10 days
- Intermediate: 21-30 days
- Major: 90-120 days
### Square of 9 Analysis
- **Current Position:** 97.839 sits at 347° on the wheel
- **Key Angles:**
- 0°/360°: 98.00 (major resistance)
- 45°: 97.20 (support)
- 90°: 98.80 (resistance)
- 180°: 96.40 (major support)
- 270°: 99.60 (major resistance)
### Price Targets from Square
- **Bullish Targets:** 98.44, 99.25, 100.69
- **Bearish Targets:** 97.21, 96.49, 95.36
### Angle Theory
- **1x1 Angle:** Primary trendline from 94.50 low at 97.60
- **2x1 Angle:** Acceleration line at 98.20
- **1x2 Angle:** Support line at 97.00
- **Fan Lines:** Multiple confluence zones at 97.25, 98.15, 99.05
### Squaring Price and Time
- **Price Squares:** 97.00, 98.00, 99.00, 100.00
- **Time Squares:** 144 hours (6 days), 233 hours (10 days)
- **Geometric Harmony:** 50% level at 97.50, 62% at 98.10
## Ichimoku Kinko Hyo Analysis
### Cloud (Kumo) Analysis
- **Current Position:** Price trading above cloud (bullish bias)
- **Cloud Support:** 97.20-97.40 zone
- **Future Cloud:** Bearish twist in 26 periods around 98.60
- **Cloud Thickness:** Medium strength S/R levels
### Signal Line Analysis
- **Tenkan-sen (9):** 97.75 - short-term momentum line
- **Kijun-sen (26):** 97.55 - medium-term trend line
- **Senkou Span A:** 97.65 (leading span)
- **Senkou Span B:** 97.30 (leading span)
- **Chikou Span:** Confirming current price action strength
### Trading Signals
- **TK Cross:** Tenkan above Kijun (weak bullish)
- **Price vs Kijun:** Above baseline (bullish bias)
- **Cloud Break:** Monitor 97.20 break for bearish signal
## Technical Indicators Analysis
### RSI (Relative Strength Index)
- **14-Period RSI:** 52.8 (neutral zone)
- **Overbought Level:** >70 (watch 98.20+ levels)
- **Oversold Level:** <30 (watch 97.00- levels)
- **Divergence Signals:** Hidden bullish divergence on 4H timeframe
- **Trend Confirmation:** Break above 55 confirms bullish momentum
### Bollinger Bands
- **Upper Band:** 98.45 (immediate resistance)
- **Middle Band (20 SMA):** 97.80 (dynamic support/resistance)
- **Lower Band:** 97.15 (immediate support)
- **Band Width:** Moderate volatility (expansion expected)
- **Squeeze Indicator:** Potential breakout setup forming
### VWAP Analysis
- **Daily VWAP:** 97.72 (key pivot level)
- **Weekly VWAP:** 97.91 (resistance)
- **Monthly VWAP:** 98.15 (major resistance)
- **Volume Profile:** High volume node at 97.50, 98.10
- **VWAP Deviation:** +1 std dev at 98.20, -1 std dev at 97.30
### Moving Averages
- **SMA 20:** 97.78 (short-term trend)
- **SMA 50:** 97.45 (medium-term support)
- **SMA 200:** 96.80 (long-term bullish above this)
- **EMA 8:** 97.85 (immediate dynamic resistance)
- **EMA 21:** 97.70 (key dynamic support)
- **WMA 10:** 97.82 (weighted recent price bias)
## Multi-Timeframe Analysis
### Intraday Analysis
#### 5-Minute Timeframe
- **Trend:** Sideways with upward bias
- **Range:** 97.75-97.95 immediate trading range
- **Scalping Levels:** Buy 97.78, Sell 97.88
- **Breakout Levels:** Above 97.95 or below 97.75
#### 15-Minute Timeframe
- **Pattern:** Ascending triangle formation
- **Apex:** Around 97.90 level
- **Time Target:** Next 2-3 hours for breakout
- **Volume:** Declining (coiling for move)
#### 30-Minute Timeframe
- **Structure:** Higher lows pattern since 97.20
- **Resistance:** 98.00 psychological level
- **Support:** 97.60 swing low
- **Momentum:** Neutral to slightly bullish
#### 1-Hour Timeframe
- **Trend:** Corrective move within larger uptrend
- **Key Level:** 98.20 hourly resistance
- **Support Zone:** 97.40-97.60
- **Next Move:** 4-6 hour window for direction
#### 4-Hour Timeframe
- **Pattern:** Bull flag consolidation
- **Pole:** Move from 97.00 to 98.90
- **Flag:** Current consolidation 97.20-98.20
- **Target:** 99.80-100.20 on upside break
- **Invalidation:** Break below 97.00
### Swing Analysis
#### Daily Timeframe
- **Primary Trend:** Bullish since July 2025
- **Current Phase:** Healthy pullback/consolidation
- **Key Resistance:** 99.00-99.20 zone
- **Major Support:** 96.80-97.00 zone
- **Expected Duration:** 5-8 trading days
#### Weekly Timeframe
- **Long-term Trend:** Sideways to up since Q2 2025
- **Weekly Range:** 96.50-99.50
- **Momentum:** Neutral with bullish undertone
- **Critical Level:** Weekly close above 98.50
#### Monthly Timeframe
- **Macro Trend:** Recovery from 2024 lows
- **Monthly Resistance:** 100.00-101.00 zone
- **Monthly Support:** 95.00-96.00 zone
- **Cycle Position:** Mid-cycle consolidation
## Key Levels & Price Targets
### Critical Support Levels
1. **97.60** - Immediate support (4H swing low)
2. **97.40** - Minor support (Gann angle)
3. **97.20** - Major support (Ichimoku cloud)
4. **97.00** - Key support (psychological + Wyckoff PS)
5. **96.80** - Weekly support (200 SMA)
6. **96.50** - Monthly support (major swing low)
### Critical Resistance Levels
1. **98.00** - Immediate resistance (psychological + Gann square)
2. **98.20** - Minor resistance (previous swing high)
3. **98.50** - Major resistance (weekly level)
4. **98.90** - Key resistance (recent high)
5. **99.20** - Weekly resistance (harmonic target)
6. **100.00** - Monthly resistance (major psychological)
### Price Projections
#### Bullish Scenario (Probability: 55%)
- **Catalyst:** Break above 98.20 with volume
- **Target 1:** 98.80-99.00
- **Target 2:** 99.50-99.80
- **Target 3:** 100.20-100.50
- **Timeline:** 2-3 weeks
#### Bearish Scenario (Probability: 35%)
- **Catalyst:** Break below 97.40 with volume
- **Target 1:** 97.00-96.80
- **Target 2:** 96.50-96.20
- **Target 3:** 95.80-95.50
- **Timeline:** 1-2 weeks
#### Neutral Scenario (Probability: 10%)
- **Range:** 97.40-98.20
- **Duration:** 1-2 weeks
- **Strategy:** Range trading
- **Breakout:** Eventually expected
## Risk Management Framework
### Position Sizing
- **Conservative:** 1% risk per trade
- **Moderate:** 1.5% risk per trade
- **Aggressive:** 2% risk per trade
### Stop Loss Guidelines
- **Intraday:** 20-30 points from entry
- **Swing:** 50-80 points from entry
- **Long-term:** 100-150 points from entry
### Take Profit Strategy
- **Scale out:** 25% at first target
- **Trail stops:** Above key support/resistance
- **Final target:** Risk-reward minimum 1:2
## Trading Strategies
### Intraday Strategy
- **Long Setup:** Break above 98.00 with volume
- **Entry:** 98.05-98.10
- **Stop:** 97.75
- **Target:** 98.45-98.60
### Swing Strategy
- **Long Setup:** Pullback to 97.40-97.60
- **Entry:** Scale in on support test
- **Stop:** Below 97.00
- **Target:** 99.00-99.50
### Momentum Strategy
- **Breakout Play:** Above 98.50 or below 97.00
- **Volume Confirmation:** Required
- **Follow Through:** Next day continuation
- **Risk:** Tight stops due to false breaks
## Market Outlook Summary
The DXY at 97.839 presents a critical inflection point with multiple technical frameworks suggesting an imminent directional move. The slight bullish bias is supported by:
- Elliott Wave suggesting Wave 5 higher
- Wyckoff accumulation characteristics
- Gann time cycles favoring upward movement
- Ichimoku cloud support holding
However, traders should remain vigilant for:
- False breakouts in current range
- Federal Reserve policy changes
- Global economic developments
- Risk sentiment shifts
**Primary Expectation:** Bullish breakout above 98.20 targeting 99.00+
**Alternative Scenario:** Range continuation 97.40-98.20
**Bearish Scenario:** Break below 97.00 targeting 96.50
*Analysis Date: August 17, 2025*
*Next Update: August 19, 2025*
*Key Event Risk: Federal Reserve communications, Economic data releases*
For those interested in further developing their trading skills based on these types of analyses, consider exploring the mentoring program offered by Shunya dot Trade.(world wide web shunya dot trade)
I welcome your feedback on this analysis, as it will inform and enhance my future work.
Regards,
Shunya.Trade
world wide web shunya dot trade
⚠️ Disclaimer: This post is educational content and does not constitute investment advice, financial advice, or trading recommendations. The views expressed here are based on technical analysis and are shared solely for informational purposes. The stock market is subject to risks, including capital loss, and readers should exercise due diligence before investing. We do not take responsibility for decisions made based on this content. Consult a certified financial advisor for personalized guidance.
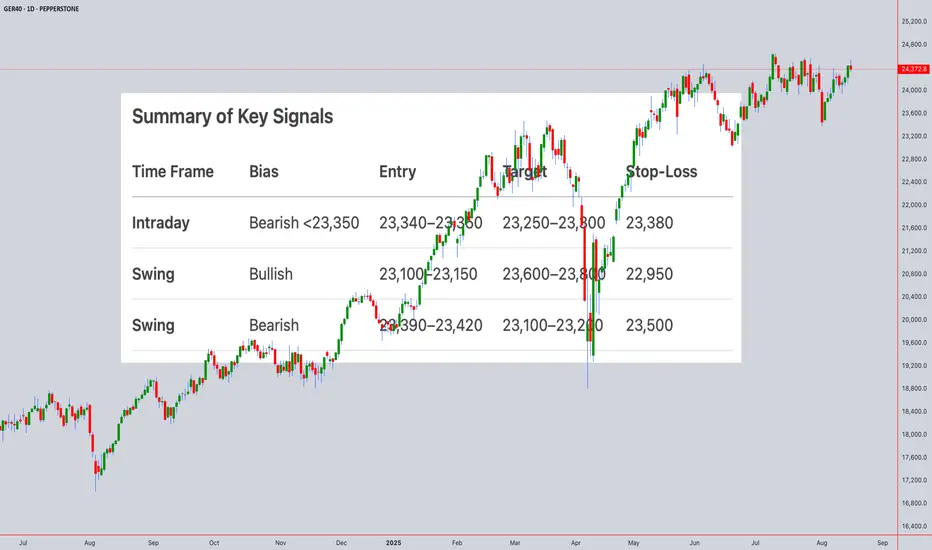
Technical Analysis for GER40 (DAX) Closing Price: 23,372.80 (15th Aug 2025, 11:50 PM UTC+4)
Analysis Methods: Japanese Candlesticks, Harmonic Patterns (ABCD, M/W), Elliott Wave, Wyckoff, Gann Theory (Time/Square of 9/Angles), Ichimoku, RSI, Bollinger Bands, VWAP, Moving Averages (MA/EMA/SMA/WMA).
---------------------------------------------------------------------------------------------
1. Long-Term Trend (Weekly/Monthly)
Elliott Wave:
GER40 is likely in Wave 3 of a broader bull cycle (Wave 1 peak: 22,800, Wave 2 dip to 21,500).
Wave 3 Target: 24,000–24,500 (1.618 extension of Wave 1).
Gann Price Forecasting:
Square of 9: √23,372.80 ≈ 152.90 →
Resistance: 153² = 23,409 (immediate), 154² = 23,716 (swing target).
Support: 152² = 23,104 (daily pivot), 151² = 22,801 (Wyckoff accumulation zone).
Ichimoku (Monthly):
Tenkan/Kijun: Bullish (Tenkan: 22,900 > Kijun: 22,400).
Cloud: Price above thick Senkou Span (22,000–22,500) – structural bullishness.
Moving Averages:
Weekly SMA(100): 22,200 (major support).
Swing Outlook: Bullish. Wave 3 rally targets 24,000–24,500.
2. Medium-Term Swing (4H/Daily)
Harmonic Patterns:
Bearish ABCD on Daily:
A: 23,800 → B: 23,100 → C: 23,550 → D: 23,380–23,420 (1.272 BC extension).
Bullish Crab (W Pattern) forming near 23,100 (0.886 XA retracement).
Wyckoff Phase:
Testing at 23,400:
Upthrust rejection at 23,450 (15th Aug) on low volume.
Spring potential near 23,100 (accumulation signal).
Gann Theory:
Time Window: Aug 18–20 (Square of 9 date cluster) for breakout/reversal.
Price-Time Squaring: 23,372 aligns with Aug 15 – consolidation expected.
Gann Angle: 1x1 angle at 23,300 – close below accelerates selling.
Indicators:
RSI(14) + Bollinger Bands (Daily):
RSI: 64 (neutral, no divergence).
Price testing upper BB(20,2) at 23,450 – expansion hints at volatility.
VWAP (Weekly): 23,250 (swing support).
Swing Trade Setup:
Short near 23,400 (ABCD target) → Target 23,100. Stop-loss: 23,500.
Long near 23,100 (Crab + Gann 151² support) → Target 23,800. Stop-loss: 22,950.
3. Intraday Outlook (5M–4H)
Key Levels:
Resistance: 23,400 (Gann 1x1), 23,450 (weekly high).
Support: 23,300 (VWAP), 23,200 (Ichimoku cloud), 23,100 (psychological).
Indicators:
Ichimoku (1H):
Tenkan: 23,360, Kijun: 23,330 → Price above both (short-term bullish).
Cloud: Bullish (23,280–23,320) – strong support zone.
RSI + Bollinger Bands (4H):
RSI(14): 58 (neutral).
Price near mid-BB(20,2): 23,350 – break below signals bearish momentum.
VWAP + MAs:
VWAP: 23,340 (intraday pivot).
EMA(50): 23,310 (dynamic support).
Candlestick Patterns:
4H Shooting Star at 23,450 (15th Aug) → Bearish reversal confirmed.
1H Bearish Engulfing below 23,380 – adds downside pressure.
Gann Intraday Squaring:
Time Cycle: 8:00–10:00 AM CET (European open) for volatility.
Price Harmony: Close below 23,350 targets 23,300 → 23,250.
Intraday Trade Plan:
Sell below 23,350 → Target 23,300 (VWAP) → 23,250 (Ichimoku cloud).
Buy above 23,400 only with RSI <60 → Target 23,450.
Stop-Loss: 25–30 points risk.
Summary of Key Signals
Time Frame Bias Entry Target Stop-Loss
Intraday Bearish <23,350 23,340–23,350 23,250–23,300 23,380
Swing Bullish 23,100–23,150 23,600–23,800 22,950
Swing Bearish 23,390–23,420 23,100–23,200 23,500
Critical Events Ahead:
Gann Reversal Window: Aug 18–20 (watch for Eurozone CPI/GDP data).
Daily Close >23,450 invalidates bearish ABCD and targets 23,716.
Risk Note: GER40 is sensitive to EU political/energy risks. Use tight stops during news events.
Disclaimer: Technical analysis is probabilistic and based on historical patterns. Fundamental drivers (e.g., ECB policy, German industrial data) may override technical signals. Always use risk management.
For those interested in further developing their trading skills based on these types of analyses, consider exploring the mentoring program offered by Shunya dot Trade . (world wide web shunya dot trade)
I welcome your feedback on this analysis, as it will inform and enhance my future work.
Regards,
Shunya.Trade
world wide web shunya dot trade
⚠️ Disclaimer: This post is educational content and does not constitute investment advice, financial advice, or trading recommendations. The views expressed here are based on technical analysis and are shared solely for informational purposes. The stock market is subject to risks, including capital loss, and readers should exercise due diligence before investing. We do not take responsibility for decisions made based on this content. Consult a certified financial advisor for personalized guidance.
DXY LONG FROM RISING SUPPORT|
✅DXY is trading in an uptrend
Along the rising support line
Which makes me bullish biased
And the pair is about to retest the rising support
Thus, a rebound and a move up is expected
With the target of retesting the level above at 98.000
LONG🚀
✅Like and subscribe to never miss a new idea!✅

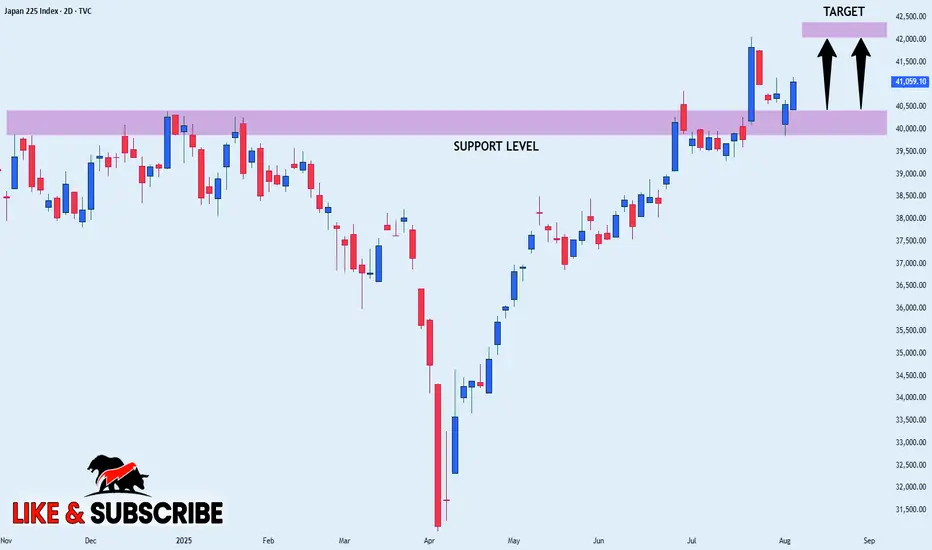
NIKKEI Will Keep Growing! Buy!
Hello,Traders!
NIKKEI is trading in a
Strong uptrend and the
Pair made a bullish breakout
Of the key horizontal level
Of 42,500 and the breakout
Is confirmed so we are bullish
Biased and we will be expecting
A further bullish move up
Buy!
Comment and subscribe to help us grow!
Check out other forecasts below too!
Disclosure: I am part of Trade Nation's Influencer program and receive a monthly fee for using their TradingView charts in my analysis.

DXY: Dollar’s ready, but the starter pistol’s still silentDXY is holding in the 97.50–97.60 support zone, an area where buyers have stepped in multiple times. Current market structure suggests possible liquidity accumulation before an upside move. The key tactical trigger is a breakout and close above 98.76, opening the path to 100.28, then 101.84 where historical selling pressure has emerged. The long-term target, if all levels break in sequence, is 104.40. While price remains below 98.76, buyers have no confirmed advantage and any rally remains speculative.
Fundamentally , the dollar lacks unconditional support: US macro data is mixed and Fed policy remains uncertain. However, safe-haven demand and cautious risk positioning by large players create a backdrop for a potential upward correction.
Tactical plan: watch 97.50–97.60, a confirmed break above 98.76 activates a move towards 100.28 → 101.84 → 104.40. Failure to break cancels the idea until a fresh impulse emerges.
The dollar right now is like a boxer before stepping into the ring - warmed up, focused, but waiting for the bell.

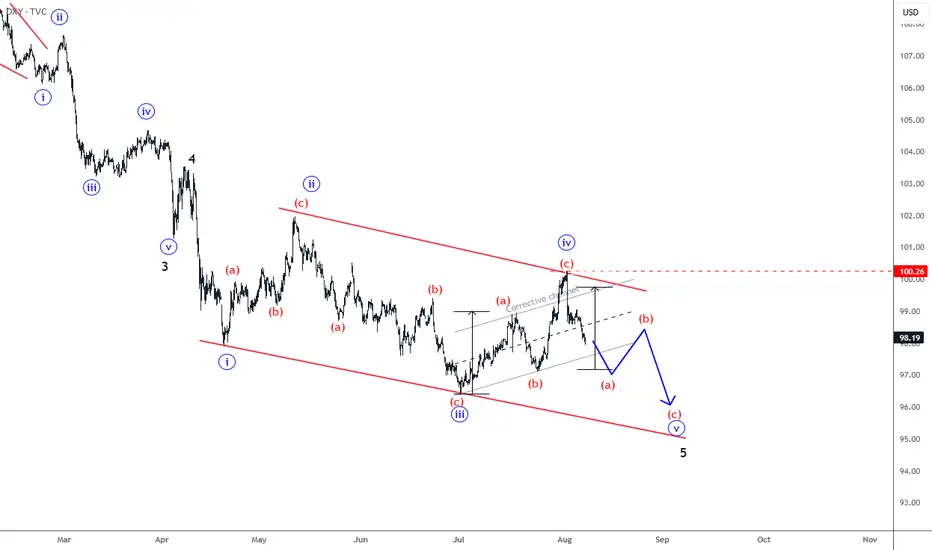
DXY Is Still Bearish; Final Leg Of The Wedge Pattern?DXY Is Still Bearish, but it can be trading in final leg of ending diagonal a.k.a. wedge pattern from technical and Elliott wave perspective.
US Dollar Index – DXY made only a three-wave rise from the lows, which indicates for a correction within downtrend. So recovery can basically still be a fourth wave rally, just a bit deeper one that can still belong to an ending diagonal a.k.a. wedge pattern. Final wave “v” of 5 can be still missing, so be aware of a continuation lower within a new three-wave abc decline, especially if breaks below the lower side of the corrective channel near 97.70 level.
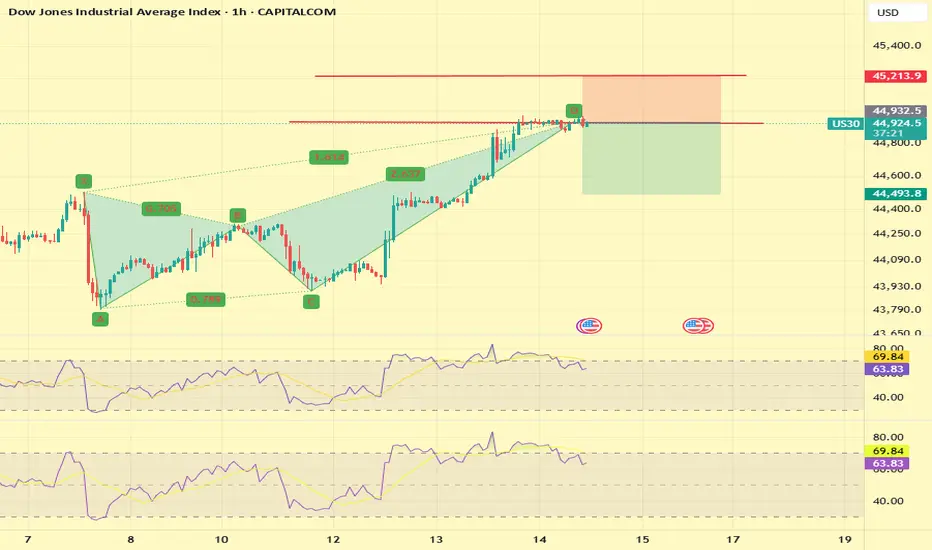
US30 Short This trade is massively overbought on all timeframes and at the all-time high with very good resistance
There is a crab pattern on H1 and H4
Multiple tops on M15 and M30 are showing massive divergence
stoploss above 150 pips
This is against the trend so will have to monitor when it is time to exit
US100 Bullish Breakout! Buy!
Hello,Traders!
US100 is trading in a
Strong uptrend and the
Index made a strong bullish
Breakout of the key horizontal
Level of 23,720 which is now
A support and the breakout
Is confirmed so we are
Bullish biased and we will
Be expecting a further
Bullish continuation
Buy!
Comment and subscribe to help us grow!
Check out other forecasts below too!
Disclosure: I am part of Trade Nation's Influencer program and receive a monthly fee for using their TradingView charts in my analysis.

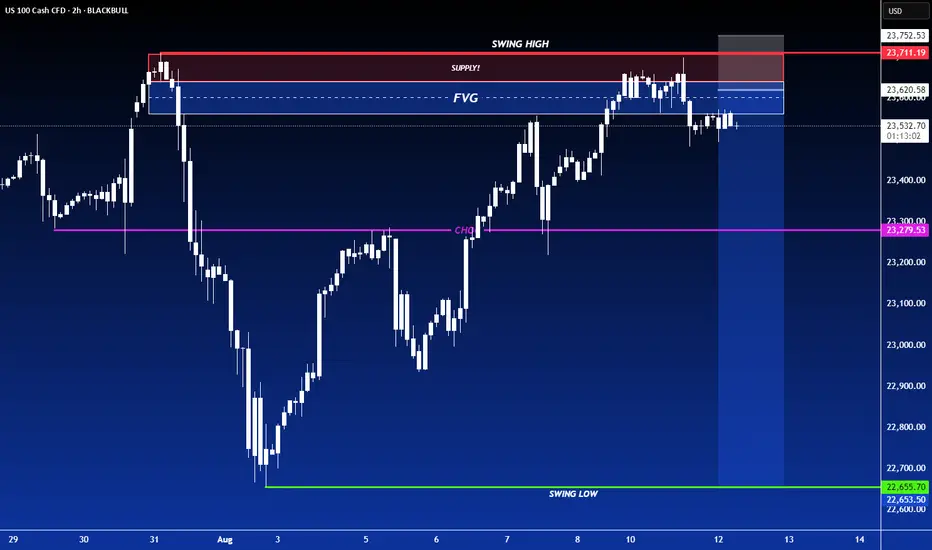
SHORT ON NAS100NAS has retested a major supply zone after a nice CHOC (Change Of Character)
I will be selling NAS looking to catch over 800-100 points.
DXY (USD) CPI economic news will also be a catalyst to more this trade this morning after 8:30am.
NASDAQ Short This is at the all-time high, showing a lot of resistance
There is an AABCD pattern on H1
All timeframes are overbought
There are multiple tops on M15 and M30 with divergence
Stop loss of 150 pips

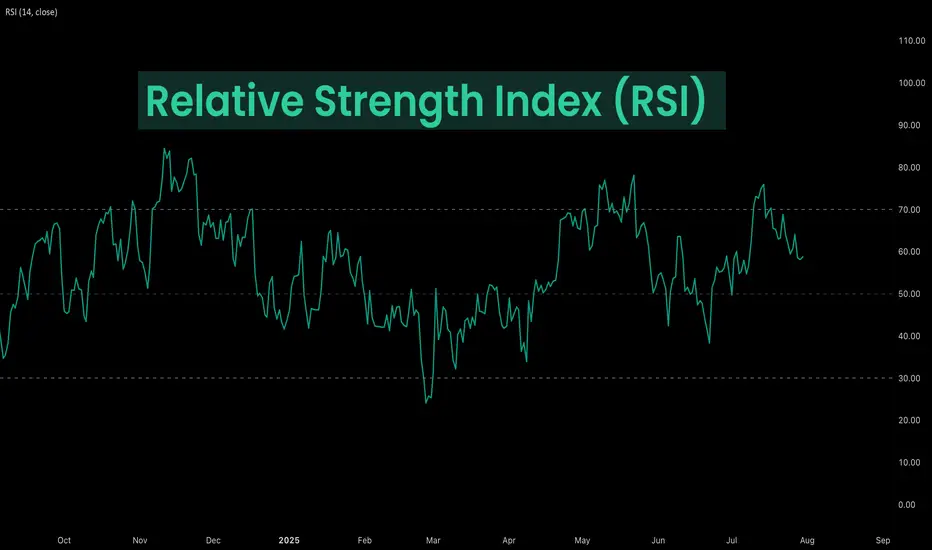
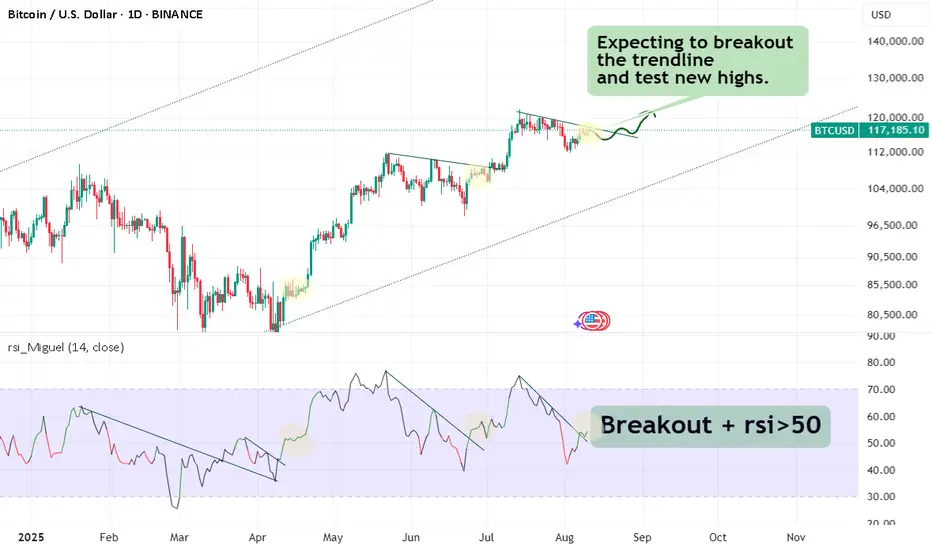
Think of RSI like a car’s speedometer: The speed (RSI) changes b"Think of RSI like a car’s speedometer:
The speed (RSI) changes before the position (price) changes direction."
1. What RSI actually is?
RSI (Relative Strength Index) is just a math transformation of price data.
It measures the ratio of recent upward moves to downward moves over a period (often 14 candles) and compresses it into a 0–100 scale.
2. Why RSI sometimes “moves first”
This isn’t magic — it’s because RSI is sensitive to the speed and size of recent price changes, not just direction.
- If price is still going up but at a slower pace, RSI can already start turning down.
- If price is falling more gently than before, RSI can start curling up before price actually reverses.
3. Why traders care about RSI reversals?
- If RSI starts turning down from an overbought level while price is still climbing, it can be an early warning of a possible price top.
- Same for the opposite: RSI turning up from oversold while price still dips can signal an upcoming bounce.
4. RSI above or below 50
50 on the RSI is the “momentum neutral” line.
- When RSI is above 50, recent gains outweigh recent losses → momentum is bullish.
- When RSI is below 50, recent losses outweigh recent gains → momentum is bearish.
5. The “delay” you see
The delay is more about your eyes than the math:
- RSI smooths recent price moves (average gains/losses), so it reacts slightly ahead to changes in momentum.
- Price must actually reverse for you to “see” it, but RSI reflects that change in momentum first.
- Think of RSI like a car’s speedometer:
The speed (RSI) changes before the position (price) changes direction.
6. How to deal with noise* in RSI?
Use higher timeframes (1D, 1W, 1M) to confirm signals from small charts.
*Noise in trading = small, random price movements that don’t reflect the bigger trend.
On a 1-minute or 5-minute chart, there’s a lot of this — caused by scalpers, bots, spreads, liquidity gaps, and normal market “chatter.”
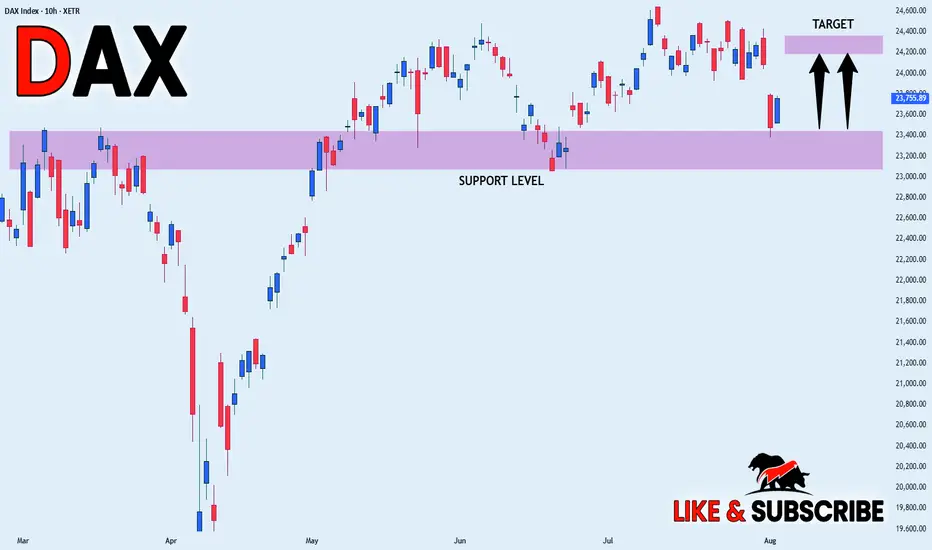
DAX WILL GO UP|LONG|
✅DAX is going up now
And the index made a
Breakout of the key horizontal
Level of 24,100 which is
Now a support then
Made a retest and a is now
Making a rebound already so
We are bullish biased and we
Will be expecting a further
Bullish move up
LONG🚀
✅Like and subscribe to never miss a new idea!✅

NIKKEI WILL KEEP GROWING|LONG|
✅NIKKEI is trading in an uptrend
And the index was making a bearish correction
But it has now retested a horizontal support level of 40,500
From where we are already seeing a bullish
Reaction and I am expecting the index to go further up
LONG🚀
✅Like and subscribe to never miss a new idea!✅
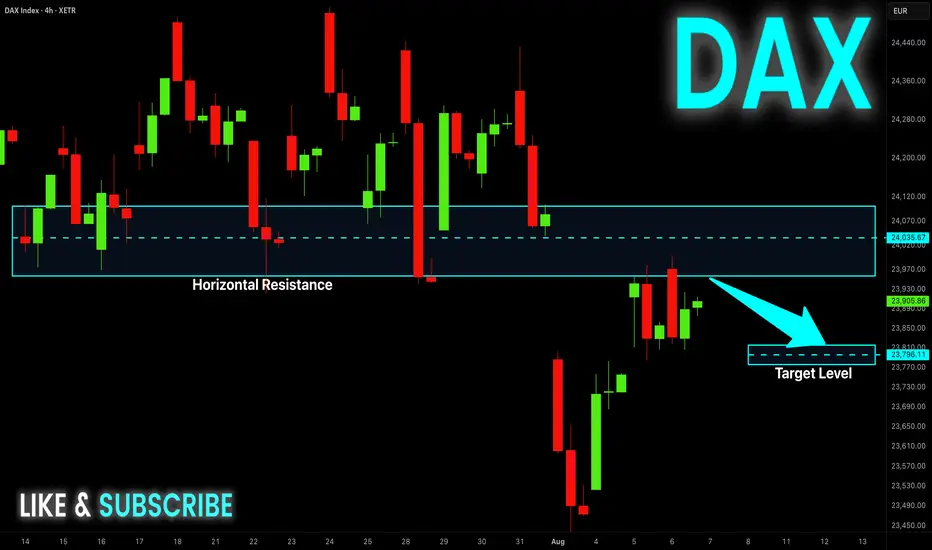
DAX Potential Short! Sell!
Hello,Traders!
DAX went up nicely
But is now about to hit
A horizontal resistance
Around 24,000 so after
The retest we will be
Expecting a local pullback
Sell!
Comment and subscribe to help us grow!
Check out other forecasts below too!
Disclosure: I am part of Trade Nation's Influencer program and receive a monthly fee for using their TradingView charts in my analysis.
DAX WILL GROW|LONG|
✅DAX is trading in an
Uptrend and the index made
A bullish rebound from the
Horizontal support of 23,400
Which reinforces our bullish
Bias and we will be expecting
A further bullish move up
LONG🚀
✅Like and subscribe to never miss a new idea!✅
The Ghost of 1986-1987 Stock Market Overlay onto $IWMThe 1986-1987 stock market advance was 48% as measured by the S&P500 Index SP:SPX from the low in late 1986 which peaked in August 1987 and crashed into October 19th's spectacular 20% decline in one day.
The advance in the Russell 2000 Index from the low in 2023 to the high in 2024 was 51%, topping the 48% gain in the SP:SPX and the meltdown wasn't as spectacular, but it was similar.
There were similar patterns in fears of trade wars, US dollar declines, new tax laws going into effect back then and tax laws sunsetting this time. Those you can go into by reviewing my other charts I have published over the years here.
I stretched the 1987 pattern to fit the low to the high, so it isn't "exactly" the same time day-to-day for this pattern.
I found it interesting because the chart of AMEX:IWM all by itself had the same "look" to me as the 1987 bull market and crash so I decided to put it together for you all here to see.
I would expect a choppy market from here on as people adjust to the new uncertainties. Sellers of this decline will be shy to reinvest anytime soon and buyers are likely afraid to step up and get aggressive with so much uncertainty.
Sentiment as measured by AAII shows an extremely fearful and reluctant investor class, which is typical to see at major market bottoms.
Wishing everyone peace and prosperity!
Tim West
11:17AM EST April 24, 2025

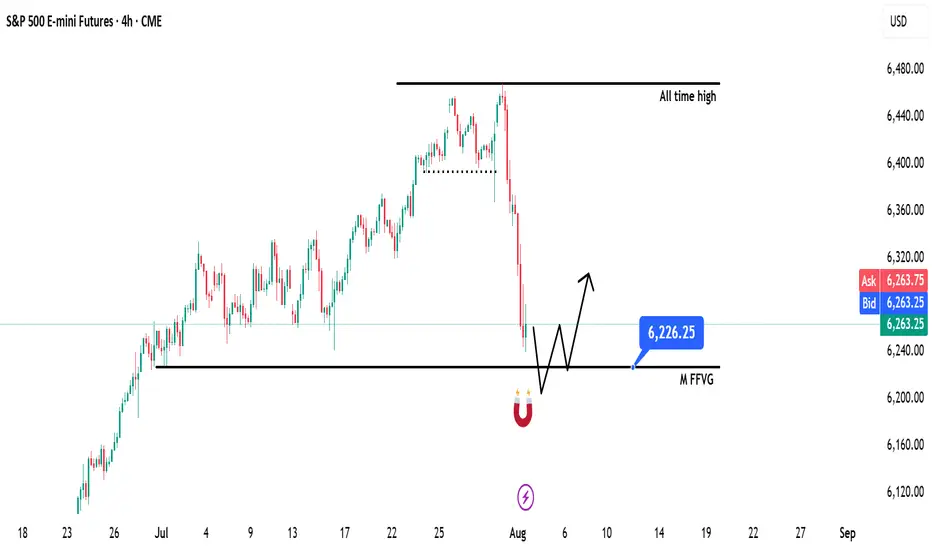
ES | SP500 - Weekly Recap & Gameplan - 03/08/25📈 Market Context:
Traders are currently anticipating a possible 0.25% rate cut during the upcoming September FOMC meeting, which continues to support the broader bullish framework.
Although the market pulled back after the Non-Farm Employment Change data came in below expectations, overall optimism remains.
Sentiment has now cooled off from last week's greed and shifted to a more neutral stance. Historically, August tends to bring some chop and pullbacks, but the structural bias still leans bullish.
🧾 Weekly Recap:
• ES kicked off the week with strong upward momentum, climbing steadily into Thursday.
• Along the way, price swept a key 4H swing high, breaking into new highs before initiating a retracement.
• This price action hinted at a short-term distribution and possible liquidity grab ahead of a correction.
📌 Technical Outlook & Game Plan:
→ I'm anticipating a move into the Monthly Fair Value Gap — a high-probability liquidity zone on my radar.
→ That area could act as a springboard for bullish continuation or at least provide a strong reaction.
→ Until that happens, I remain short-biased targeting the 6226$ zone, which I've marked as a major level.
🎯 Setup Trigger:
Once price taps 6226$, I'll monitor for:
• Clear break of structure on the 4H and 1H timeframes
• Formation of new demand zones indicating potential reversal
→ On confirmation from the lower timeframes, I’ll shift my focus toward long setups, potentially targeting new highs.
📋 Trade Management:
• Stoploss: Below the demand zone formed on 1H–4H
• Target: I’ll trail my stop to lock in profits as price moves higher
• Note: Although I’ll be watching for ATH retests, I plan to manage risk actively and book profits along the way
💬 Like, follow, and comment if this breakdown supports your trading! I’ll be sharing more detailed setups and educational posts — stay connected!
SOLANA $250 INCOMING? or $150 again?We can see a wedge is forming, price is at a major point, break above with a failed break below the resistance - we see high potential for $250.
Failed breakthroughs and a rejection? We see $150 once more.
Thoughts?

HK50 LONG This trade is with the daily trend and the showing the momentum still being very up
There are multiple bat patterns on H1 and M15
This trade is oversold on all timeframes up to H4 and showing divergence
Stop loss of 200 pips

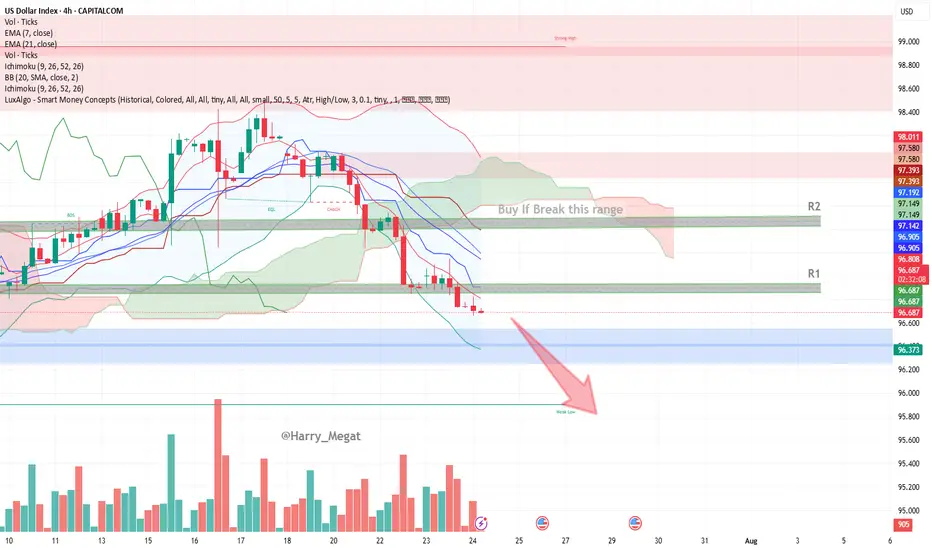
US Dollar Index (DXY) – 4H Chart AnalysisUS Dollar Index (DXY) – 4H Chart Analysis
**Current Trend:** Bearish
Price trades below EMAs, Ichimoku Cloud, and within a bearish channel.
#**Bearish Scenario (Favorable)**
* **Conditions:**
* Price remains below EMA 7 & 21
* Stays under Ichimoku Cloud and 96.812 resistance (R1)
* Lower lows forming, bearish momentum increasing
* **Confirmation:**
Break below **96.37 (blue zone)**
* **Target:**
* TP1: 96.00
* TP2: 95.60 (next weak support)
**Bullish Scenario (Reversal)**
* **Conditions:**
* Price must break above **96.81 (EMA 7 + resistance)**
* Break above **R1 → 96.90**, and then above **R2 → 97.14–97.19**
* Bullish candles close above the Ichimoku cloud
* **Confirmation:**
Break and retest of **97.20**
* **Target:**
* TP1: 97.39
* TP2: 97.58 (key structure)
* TP3: 98.00 (major resistance)
**Bias:** Bearish unless DXY breaks above **97.20** with strong volume and bullish structure.
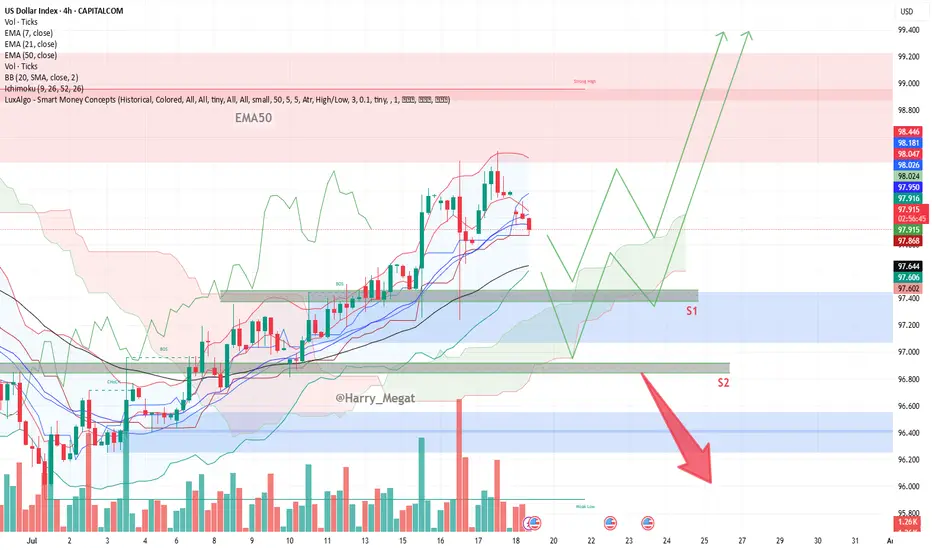
DXY Chart Outlook: Trend, Support, and Price Objectives**DXY Chart Outlook: Trend, Support, and Price Objectives (Reworded Analysis)**
**Trend Overview**
* The DXY chart reflects a **clear upward trajectory**, characterized by a sequence of **ascending highs and higher lows** — a classic sign of bullish momentum.
* Currently, the price is **retracing toward the 50-day EMA**, which appears to be holding as **dynamic support**.
* Two important **horizontal support zones** are marked:
* **Support 1 (S1):** \~97.400 (aligned with EMA-50)
* **Support 2 (S2):** \~96.800 (a deeper correction level)
**Projected Price Zones**
* **Near-Term Objective:** **98.800 to 99.000**
* A rebound from the EMA or S1 could send price higher toward this zone, continuing the current bullish structure.
* **Mid-Term Target:** **99.200 to 99.400**
* If the price successfully clears the 99.000 resistance, further bullish continuation could aim for this intermediate target range.
* **Extended Target:** **100.000+**
* A sustained breakout beyond 99.400 could open the path toward **psychological resistance at 100.000**, possibly higher on strong momentum.
**Support Zones to Watch**
* **S1 (97.400):** This level coincides with the 50-day EMA and represents a **first line of defense**.
* **S2 (96.800):** Should the price fall below S1, this secondary level could provide **stronger support** and potential bounce opportunity.
**Risk Management**
* Consider placing a **protective stop** just below S2 — around **96.500** — to safeguard against a potential trend reversal or deeper correction.
**Summary**
* The DXY remains **technically bullish**, with potential upside targets at **98.800**, **99.400**, and eventually **100.000+**.
* Traders can monitor **S1 and S2** for potential entries or trend confirmation.
* A **breakdown below 96.500** would invalidate the bullish setup and warrant caution.
Deep Dive Into Relative Strength Index (RSI)The Relative Strength Index (RSI) is a momentum oscillator developed by J. Welles Wilder Jr. that measures the speed and magnitude of price changes.
Introduction
In the world of trading, timing is everything — and few indicators have stood the test of time like the Relative Strength Index (RSI). Introduced by J. Welles Wilder in 1978, the RSI is a momentum oscillator that helps traders evaluate the strength and speed of price movements. Whether you're trading stocks, forex, or crypto, understanding how RSI is calculated and how to interpret its signals can give you a critical edge.
In this article, we’ll break down exactly how the RSI works, explore its formula, and dive into practical ways you can incorporate it into your trading strategies. From spotting potential reversals to identifying overbought and oversold conditions, the RSI remains a cornerstone of technical analysis — but only if you know how to use it properly.
Let’s explore the mechanics and the mindset behind this powerful indicator.
What Is RSI and How Is It Calculated?
The Relative Strength Index (RSI) is a momentum oscillator that measures the speed and change of price movements over a defined period. It outputs a value between 0 and 100, which helps traders determine whether an asset is overbought or oversold.
The default RSI setting uses a 14-period lookback window and is calculated with the following steps:
🔷Calculate the average gain and loss over the last 14 periods:
Average Gain = Sum of all gains over the past 14 periods / 14
Average Loss = Sum of all losses over the past 14 periods / 14
🔷Compute the Relative Strength (RS):
RS = Average Gain / Average Loss
🔷Apply the RSI formula:
RSI=100−(100/(1+RS))
The result is a single number between 0 and 100 that indicates the asset's momentum.
How to Use RSI in Trading Strategies
⚡️Overbought and Oversold Conditions Strategy
RSI > 70 typically signals that an asset may be overbought and due for a pullback.
RSI < 30 suggests the asset might be oversold, potentially primed for a bounce.
However, these levels aren’t absolute sell or buy signals. In strong trends, RSI can stay overbought or oversold for extended periods.
📈Long Trading Strategy Example:
1. Identify the major trend, to find the long trades it shall be uptrend. On the screen below you can see 1D time frame for BITMART:BTCUSDT.P .
2. Move to lower time frame (in our case 4h) and find the moment when RSI falls below 30. This is our oversold condition and we are going to look for long trade.
3. Find the local support zone and open long trade.
4. Take profit when price reaches resistance level next to the previous swing high
5. Don’t forget to put initial stop loss when enter position. The best stop loss which will give you 3:1 risk to reward ratio.
📉Short Trading Strategy Example
1. Identify the major trend, to find the short trades it shall be downtrend. On the screen below you can see 1D time frame for BITMART:ETHUSDT.P .
2. Move to lower time frame (in our case 4h) and find the moment when RSI grows above 70. This is our overbought condition and we are going to look for short trade.
3. Find the local resistance zone and open short trade.
4. Take profit when price reaches support level next to the previous swing low
5. Don’t forget to put initial stop loss when enter position. The best stop loss which will give you 3:1 risk to reward ratio.
⚡️RSI Breakout Strategy
RSI is breaking through 60 indicating bullish momentum shift if the long-term trend is bullish can be the potential long signal
RSI is breaking down 40 indicating bearish momentum shift if the long-term trend is bearish can be the potential short signal
This strategy works great only on the trending market, don’t use it on the range bounded market to avoid whiplashes.
📈Long trading strategy example:
1. Make sure that long-term trend is bullish. Use 200 period EMA as its approximation. If price remains above it we can look for potential long trade setup.
2. If RSI crossed above the level 60 open long trade.
3. Put the initial stop-loss under the signal candle’s low.
4. Take profit when price reached 3:1 risk-to-reward ratio.
📉Short trading strategy example
1. Make sure that long-term trend is bearish. Use 200 period EMA as it’s approximation. If price remains below it we can look for potential short trade setup.
2. If RSI crossed below the level 40 open short trade.
3. Put the initial stop-loss above the signal candle’s high.
4. Take profit when price reached 3:1 risk-to-reward ratio. In our case we received very fast and profitable trade
⚡️RSI Divergence Strategy
RSI can be used also as a trend reversal indicator if we are looking for divergences. This is very reliable sign of current trend weakness and great opportunity open trade against the trend. Usually it’s not recommended, but in case if divergence can be applicable.
Bullish divergence is the situation when price created the lower low, while RSI made the lower low. Usually, it indicates that current downtrend is weakening and we can look for long trades
Bearish divergence is the situation when price created the higher high, while RSI made the lower high. Usually, it indicates that current uptrend is weakening and we can look for short trades
😎Important hint: it’s rarely covered in textbooks about technical analysis, but in our opinion it’s better to used divergences when RSI was able to cross level 50 between two lows/highs.
📈Long trading strategy example
1. Find at the chart situation, when the price made the lower low
2. At the same time RSI shall set the higher low
3. RSI shall break level 50 between these lows indicating shift to the bullish momentum
4. If price failed to set the clean breakdown open long trade on the candle which set the lower low. Put stop loss under it’s low
5. Take profit at 3:1 RR. When you master this concept, you will be able to have much more RR trades, even 10:1. This is possible because when trend finish you have the highest potential upside
📉Short trading strategy example
1. Find at the chart situation, when the price made the higher high
2. At the same time RSI shall set the lower high
3. RSI shall break level 50 between these highs indicating shift to the bearish momentum
4. If price failed to set the clean breakout open short trade on the candle which set the higher high. Put stop loss above it’s high
5. Take profit at 3:1 RR. When you master this concept, you will be able to have much more RR trades, even 10:1. This is possible because when trend finish you have the highest potential upside
Conclusion
The Relative Strength Index (RSI) remains one of the most powerful and flexible tools in a trader’s technical arsenal — but its real value lies in how you use it.
We’ve explored three key RSI strategies:
✅ Overbought/Oversold setups offer simple entry signals in ranging markets, where price tends to revert to the mean.
✅ Breakout strategies unlock RSI’s momentum-tracking potential, helping you ride strong directional moves with confidence.
✅ Divergence detection reveals hidden shifts in market sentiment, giving you an early warning of possible reversals or trend continuations.
Each approach has its strengths — and its risks — but together, they offer a complete framework for using RSI across different market conditions
🔑 Key Takeaways:
RSI is not just a “buy low, sell high” tool — it’s a multi-dimensional indicator that adapts to trends, momentum, and market structure.
The best RSI signals come from confluence: combining RSI with price action, support/resistance, volume, or trend filters like moving averages.
Patience and discipline are essential — RSI signals are only effective when paired with proper risk management and confirmation.
By mastering RSI beyond the basics, you'll be better equipped to make timely, confident, and informed trading decisions — whether you're entering a pullback, chasing a breakout, or spotting the early signs of reversal.