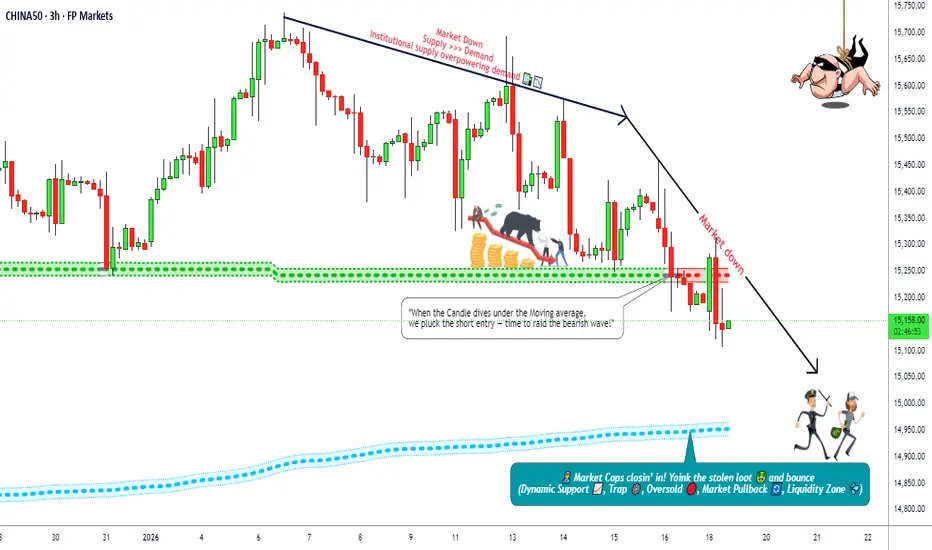
China A50 Market Analysis | Downtrend Confirmation🔥 China A50 (CHINA50) Short Bias Set-up | MA Breakout Confirmed 📉 + Correlation Watchlist + Macro Fuel
📌 DESCRIPTION — Pro Traders + OGs Only 🔓
Market: China A50 Index CFD (Trading Benchmark — top 50 A-shares listed Shanghai & Shenzhen).
Timeframe: Day / Swing Trade
🧠 TRADE STRUCTURE 📊
📉 Bias: Bearish — Confirmed MA Breakout (Price cracked dynamic zone)
🎯 Entry: Any logical price break / retest — flexibility preferred
🛑 Stop Loss:
“Thief SL” @ 15400 — Risk Protect Zone (manage risk, not hope)
📍 Target:
First Profits: ~14950 zone — confluence with dynamic support fade
(Remember: price can overshoot; scale profit taking)
🔥 RISK DISCLOSURE
Dear Ladies & Gentlemen (Thief OG’s) — this is trade guidance only. Set your own SL/TP based on your risk tolerance — not only mine. Trade smart, take profits, protect capital.
📌 PAIRS & CORRELATIONS TO WATCH 👀
Strong / relevant correlations with China equity sentiment:
• USD/CNH — rising USD against CNH usually pressures Chinese equities
• CSI 300 / HSI — if broader China large caps weaken, A50 often follows
• ASX200 / Hang Seng Tech — regional risk appetite bleed confirms gravity
• AUD/JPY / Nikkei 225 — Asia risk proxy; risk-off often means equities slide
Why watch these? Greater macro forces ripple across Asian/China markets and confirm momentum.
📊 FUNDAMENTAL & ECONOMIC CONTEXT (Latest + Upcoming)
🔎 China growth slowing but resilient: GDP forecast ~4.8% in 2026 (slightly below last year) with export strength supporting macro growth.
📈 Tech & ETF flows — institutions increasing exposure, tech earnings gaining momentum — positive undercurrent.
🏙️ Domestic weakness + property drag — ongoing property price declines and weak consumption could weigh on broader sentiment.
📰 Market oversight tightened — regulators vow stricter supervision to curb speculative excess; margin requirements rising.
⏰ Upcoming Macro Drivers:
✔ PMI/services releases
✔ China trade data (exports/imports)
✔ PBOC policy stance — interest rate / RRR actions
✔ US macro (PPI/CPI) impacting China export demand via currency flows
🛠 TECHNICAL EDGE
✔ MA breakout suggests bleeding momentum
✔ Dynamic MA acts as pseudo resistance
✔ Oversold zones + trap signals warrant profit realization
✔ Risk clusters / support confluence near target zone
📌 NEWS IMPACT SUMMARY (London Time)
• China met growth targets despite challenges, but domestic demand remains weak.
• Property sector softness risking broader economic drag.
• Regulatory tightening to curb speculation could pressure markets.
(All news interpreted in London time market context.)
🔔 LESSON IN A LINE
Price respects structure more than direction — trade levels with confirmation, not emotions.
Indexanalysis
US2000 Momentum Rebuilds After Triangular MA Retest🚀 US2000 Bullish Setup – Triangular MA Pullback Play (Layered Entry Blueprint) 🚀
✨ Asset: US2000 – Small-Cap U.S. Index
📅 Trade Style: Day / Swing
🎯 Bias: Bullish Continuation confirmed through Triangular Moving Average Pullback
📌 Trade Plan – Clean & Clear
📈 Bullish Structure Confirmed
The price retest on the Triangular Moving Average shows buyers stepping in aggressively, signalling a strong continuation phase. This is where momentum traders and swing players gain the best advantage.
🧠 Thief Strategy – Layered Limit Entries (Multi-Order Method)
To manage volatility + trap liquidity like a pro, we use layered buy limits.
🔽 Buy Limit Layers (Flexible Based on Your Style):
2470
2480
2490
2500
(Feel free to add more layers based on your own capital, risk model, or spread environment.)
This layered technique helps you:
⚡ Catch deeper pullbacks
⚡ Reduce average entry cost
⚡ Beat market whipsaws
⚡ Accumulate position silently like a true OG
🛑 Stop Loss – Safety First
SL: 2450
Dear Ladies & Gentlemen (Thief OGs), adjust this SL as per your strategy, risk appetite, and volatility conditions.
This is not a forced SL — your account, your rules.
🎯 Target – Exit with Profits, Not with Ego
Our take-profit sits near:
TP: 2570
Why?
🔼 Moving averages above are acting as a strong dynamic resistance zone
🔼 Market nearing overbought territory
🔼 Potential bull trap zone, so escape elegantly with profits
Again, OGs — your TP is your own choice. Manage your bag with discipline.
📊 Market Psychology & Structure Insight
The US2000 typically reacts faster to sentiment compared to big indices like SPX or NASDAQ because small-caps absorb liquidity shocks quicker.
This bullish pullback presents a classic “buy the dip into MA” play — a favourite among swing traders.
🌐 Related Pairs To Watch (Correlation Keynotes)
💵 SP:SPX / AMEX:SPY (S&P 500)
Strong positive correlation
If SPX is bullish, US2000 usually follows with stronger momentum
Watch SPX’s 4H trend for confirmation
📈 NASDAQ:NDX / NASDAQ:QQQ (NASDAQ 100)
When tech rallies, small-caps often catch delayed momentum
A strong NASDAQ risk-on pulse boosts US2000 sentiment
📉 TVC:DXY (U.S. Dollar Index)
Inverse correlation
Weak DXY boosts equities (US2000 included)
If DXY drops, small-cap indices often pump harder
TVC:VIX (Volatility Index)
Direct risk-sentiment indicator
Falling VIX = bullish for US2000
Rising VIX = be cautious with new entries
💼 TVC:DJI (Dow Jones)
Large caps lead in stability
When Dow is stable/bullish → risk-on spillover increases small-cap flows
📝 Final Thought
This setup suits traders who love structured pullbacks, clean MA-based momentum, and layered entries. Manage risk, scale smart, and take profit with intention — not emotion.

NAS100 — 25,458 Liquidity Sweep, Target Revised to 24,989The NAS100 has completed a clear liquidity sweep at 25,458, taking out the previous swing high before rejecting the zone. This move confirms that the breakout above 25,458 was only a liquidity grab, not a structural shift. As long as price remains below this swept level, the bias stays bearish.
The rejection from 25,458 suggests that the market has collected buy-side liquidity and is now positioned to move toward the opposite side of the range. The first reaction zone is 25,054, but this level is likely to act only as an intermediate pause. The true downside magnet is now 24,989, where a deeper liquidity pool resides (lows + imbalance).
Key Level
25,458 — Sweep Liquidity Zone (bearish invalidation if reclaimed)
Targets
25,054 — Interim level
24,989 — Main target

Bull Run Stumbles: S&P 500 Heads Toward a Potential Correction After a rough day on Wall Street, the S&P 500 dropped about 1.2%, pulling U.S. markets lower. But there’s more behind this fall than just profit-taking.
What’s Really Happening?
Warning Signs from Wall Street
Two top banking leaders raised caution. Morgan Stanley’s Ted Pick expects a 10–15% correction, calling it a “healthy normalization.”
Goldman Sachs’ David Solomon warned that tech stocks are showing bubble-like behavior, with prices running much faster than earnings.
AI Boom Driving Market Concentration
The AI craze and tech optimism have made a few mega-cap companies dominate the market. In fact, just 10 big tech firms now make up nearly 40% of the S&P 500’s total value, making the market more fragile.
Fed Confusion Adds to Uncertainty
The Federal Reserve is sending mixed signals — some officials talk about possible rate cuts by December, while others say rates should stay high because the economy is still strong.
Adding to the mess, a partial U.S. government shutdown has delayed key data, leaving investors and the Fed guessing about what’s really happening in the economy.
What the Chart Reveals
From a technical standpoint, the U.S. market’s rally has been nothing short of extraordinary. Since the April bottom near 4,835, the index has soared nearly 42%, touching a recent peak around 6,920 — and even gained about 12–13% before the latest (April 2025) pullback began.
But now, the momentum seems to be fading. The chart is flashing early warning signals — RSI divergence suggests that while prices made new highs, the underlying strength (momentum) did not. That often hints at a potential trend reversal.
If this weakness deepens, the index could correct swiftly by around 10%, targeting the 6,200–6,100 zone. And if the “healthy normalization” predicted by Morgan Stanley’s Ted Pick (a 15% drop) plays out, the index might slide further to around 5,700 — a level that would reset valuations to more reasonable territory after the sharp run-up.
Valuation Check
Let’s set aside all the opinions and headlines for a moment and focus on the key valuation metrics that truly help us understand the real picture of the U.S. market.
The Price-to-Earnings (P/E) Ratio — The Market’s Mood Meter
P/E Ratio = Current Market Price/Earnings Per Share (EPS)
So, Current Market Price = P/E Ratio*EPS
Currently, the S&P 500’s P/E ratio stands at 30.8x, with an EPS of $222.5.
When you multiply the two — 30.8 × 222.5 = roughly $6,800 — it perfectly aligns with the index’s recent market level.
Now, to find out what the fair value of the market should be, let’s use the 5-year median P/E ratio, which is around 25.4x.
Fair Market Price = 25.4*222.5 = 6,650.
This aligns perfectly with the technical chart levels, suggesting that a 15% correction would be a healthy pullback to help cool down the overheated U.S. market.
The Buffett Indicator — Market Cap vs. GDP
One of Warren Buffett’s favorite valuation tools compares the total U.S. stock market capitalization to the country’s GDP — essentially measuring how large the market has grown relative to the real economy.
At present, this ratio stands at around 224%, far above the long-term fair value range of 100–120%. Even when compared to its 5-year median level of 192%, the market still appears significantly overvalued.
To return to its median level, the ratio would need to drop by roughly:
100 = 16.6%
That’s roughly a 15–16% correction, which again perfectly aligns with both the technical chart signals and Ted Pick’s projection of a healthy market normalization.
The Bottom Line
The U.S. market’s extraordinary rally has been built on a mix of AI optimism, liquidity hopes, and investor euphoria, but the fundamentals are starting to whisper caution.
Both valuation metrics and technical signals point to the same conclusion — the market is stretched, and a 10–15% correction wouldn’t be a disaster; it would be a return to balance.
History shows that every overheated bull run needs a pause — not to end the story, but to give it a stronger foundation.
So if the coming months bring some red on the screen, smart investors will see it not as fear, but as the market taking a deep breath before its next big move.

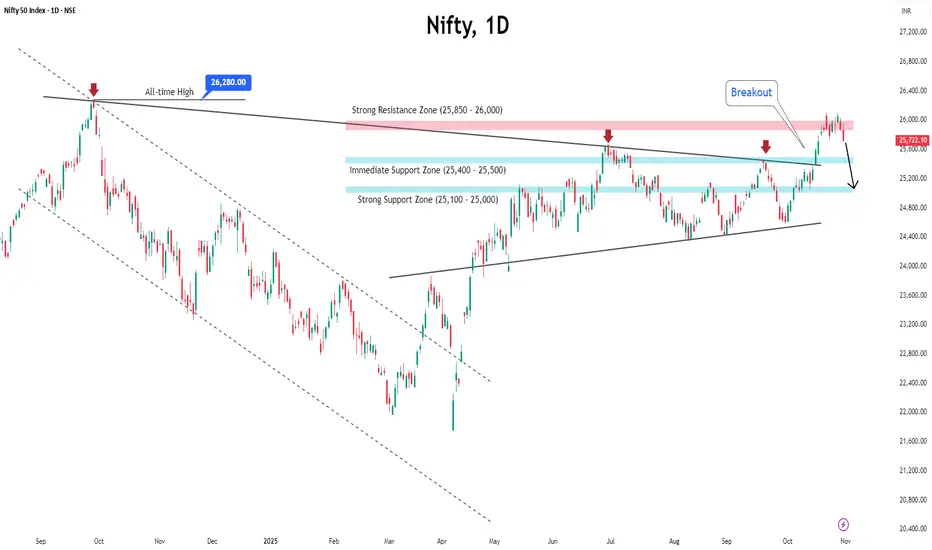
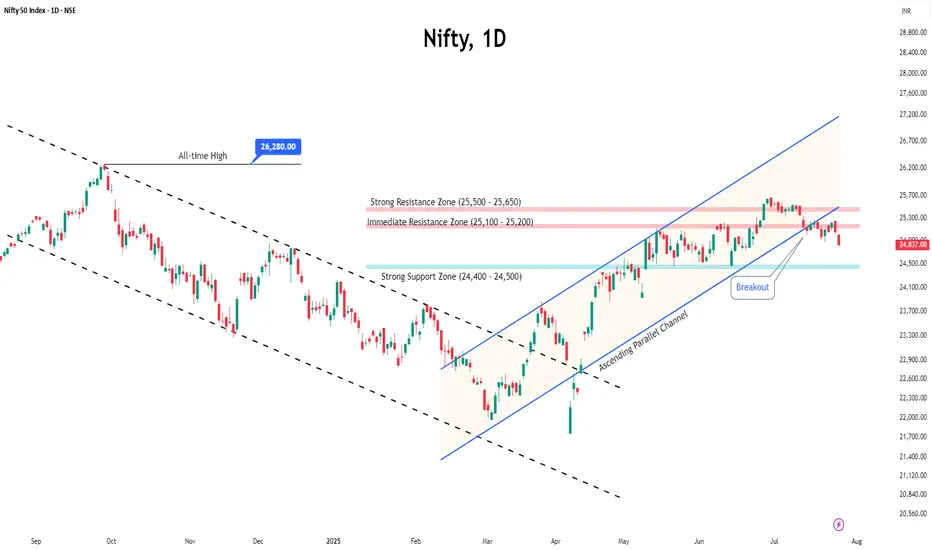
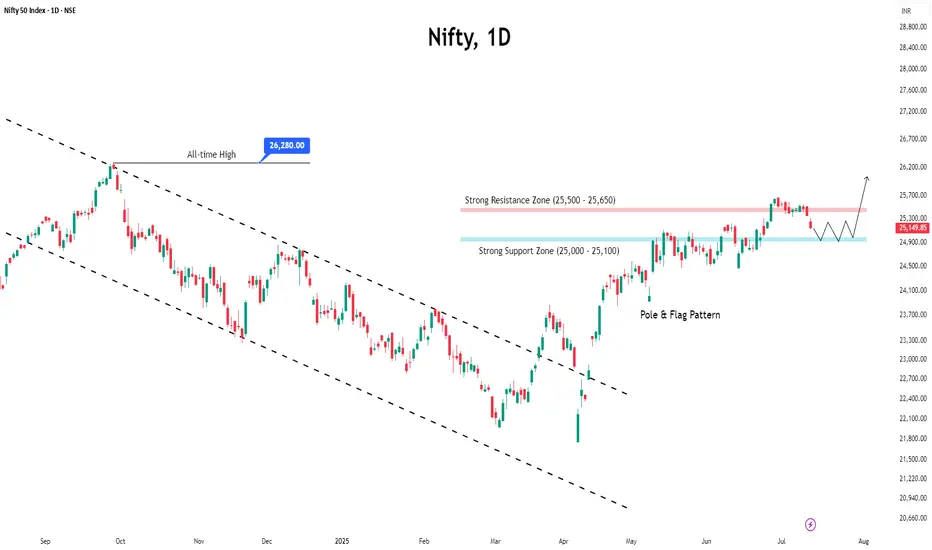
"Nifty Hits a Red Light After a Four-Week Sprint — What’s Next?"Indian markets finally took a breather after a four-week winning streak, ending the week marginally lower at 25,722.
The week began on an upbeat note, with the index advancing through the first three sessions. However, back-to-back declines in the last two days wiped out those early gains.
Even with this mild correction, October stood out as the best month in seven months, marking the strongest performance since March.
Technically, the index appears to be losing some steam after hitting a strong resistance near 26,000. This weakness could drag it toward the 25,400–25,500 support zone, and if the weakness deepens, a slide toward 25,000 cannot be ruled out.
On the fundamental side, one key factor to watch is India’s ongoing bilateral trade negotiations with the US, which are now in their final stages — a development that could sway market sentiment in the near term.
For traders, the strategy remains clear: stay stock-specific and adopt a buy-on-dips approach, as the broader market undertone remains constructive.
ETFs vs Index TradingIntroduction
The financial markets offer a wide range of instruments that cater to investors of varying risk appetites, time horizons, and objectives. Among these, Exchange-Traded Funds (ETFs) and Index Trading stand out as two of the most popular methods for gaining diversified exposure to markets. While both allow investors to benefit from broad market movements rather than focusing on individual stocks, they differ in structure, flexibility, trading mechanism, cost, and strategic use. Understanding the distinctions between ETFs and index trading is essential for investors aiming to optimize returns while managing risk efficiently.
1. Understanding ETFs
Definition and Structure
An Exchange-Traded Fund (ETF) is a type of pooled investment vehicle that holds a basket of securities — such as stocks, bonds, commodities, or currencies — and is traded on an exchange like a stock. ETFs are designed to track the performance of an underlying index, such as the S&P 500, Nifty 50, or NASDAQ-100, but can also be actively managed in some cases.
Each ETF is composed of shares that represent proportional ownership in the underlying assets. Investors buy and sell ETF shares throughout the trading day at market prices, similar to how they trade stocks. The creation and redemption mechanism, involving authorized participants, helps maintain the ETF’s price close to its Net Asset Value (NAV).
Types of ETFs
Index ETFs – Track a specific market index (e.g., SPDR S&P 500 ETF).
Sector ETFs – Focus on specific industries (e.g., technology, healthcare, energy).
Bond ETFs – Invest in government, corporate, or municipal bonds.
Commodity ETFs – Provide exposure to commodities like gold, silver, or oil.
International ETFs – Offer access to global markets or specific regions.
Thematic ETFs – Focus on trends like renewable energy or artificial intelligence.
Leveraged & Inverse ETFs – Designed for short-term traders seeking amplified or inverse returns.
How ETFs Work
ETFs are managed by fund companies that assemble the basket of assets mirroring an index. When large institutions (authorized participants) buy or redeem ETF shares, they exchange them for the underlying basket of securities. This creation/redemption process ensures liquidity and price alignment with the index.
Investors can hold ETFs in brokerage accounts and trade them intraday. The price fluctuates throughout the day based on supply and demand, unlike mutual funds, which can only be traded at end-of-day NAV.
2. Understanding Index Trading
Definition and Concept
Index trading involves speculating on the price movements of a stock market index such as the Dow Jones Industrial Average (DJIA), S&P 500, FTSE 100, or Nifty 50. Investors do not own the individual stocks within the index but trade based on the overall direction of the index’s value.
Unlike ETFs, which represent ownership in a basket of assets, index trading is generally executed through derivatives such as futures, options, contracts for difference (CFDs), or index funds. The main objective is to profit from market movements — either upward or downward — without holding the physical assets.
Forms of Index Trading
Index Futures – Standardized contracts to buy or sell an index at a predetermined price on a future date.
Index Options – Provide the right (but not obligation) to trade the index at a specific strike price.
CFDs (Contracts for Difference) – Enable traders to speculate on index price changes without owning the underlying assets.
Index Funds – Mutual funds designed to replicate the performance of a specific index (though less flexible than ETFs).
Mechanics of Index Trading
Index traders focus on price charts, technical indicators, and macroeconomic data to forecast market direction. Because indices aggregate the performance of many companies, they offer a snapshot of overall market health. Traders use leverage in futures or CFDs to magnify potential gains — but also risk.
For example, when trading Nifty 50 Futures, a trader is betting on whether the Nifty index will rise or fall by the expiry date. This allows both hedging and speculative strategies.
3. Advantages of ETFs
1. Diversification
ETFs provide instant diversification across a large number of securities. For example, an S&P 500 ETF gives exposure to 500 of the largest U.S. companies, reducing single-stock risk.
2. Cost Efficiency
Most ETFs have low expense ratios compared to mutual funds, as they are passively managed.
3. Liquidity and Flexibility
ETFs can be bought or sold at any time during market hours, offering real-time trading flexibility.
4. Transparency
Holdings are disclosed daily, unlike mutual funds, which reveal their portfolios quarterly.
5. Dividend Income
Equity ETFs often pay dividends from the underlying stocks, which can be reinvested.
6. Tax Efficiency
Because ETFs use an in-kind creation/redemption process, they generally generate fewer taxable events than mutual funds.
4. Advantages of Index Trading
1. High Leverage
Traders can control large positions with small capital outlay, increasing potential returns.
2. Short-Selling Capability
Index derivatives allow traders to profit from falling markets — a feature not typically available with ETFs unless inverse ETFs are used.
3. Hedging Opportunities
Institutional investors use index futures and options to hedge portfolios against market risk.
4. 24-Hour Market Access
Major index futures (like S&P 500, NASDAQ, or FTSE) trade almost round the clock, allowing participation across global time zones.
5. Quick Market Exposure
Traders can gain exposure to the entire market efficiently without buying individual stocks.
5. Risks Involved
ETFs:
Tracking Error – ETF performance may slightly deviate from the underlying index due to fees or imperfect replication.
Liquidity Risk – Niche or thinly traded ETFs may experience wider spreads.
Market Risk – ETFs still carry the same risk as their underlying assets.
Currency Risk – For global ETFs, exchange rate fluctuations can affect returns.
Management Risk – Active ETFs depend on manager skill for performance.
Index Trading:
Leverage Risk – Amplifies both gains and losses.
Market Volatility – Indices can fluctuate rapidly due to macroeconomic or geopolitical events.
Margin Calls – Traders must maintain margin levels; otherwise, positions may be liquidated.
Timing Risk – Short-term trades can be affected by sudden market reversals.
Complexity – Requires understanding of derivatives, rollovers, and expiration dates.
6. Strategic Use Cases
When to Choose ETFs
Long-term investors seeking diversified exposure to markets.
Passive investors focused on wealth building.
Those preferring simplicity and low costs.
Investors who want dividend income.
Retirement portfolios and systematic investment plans (SIPs).
When to Choose Index Trading
Short-term or swing traders seeking profit from volatility.
Institutions looking to hedge market risk.
Traders comfortable with technical analysis and leverage.
Professionals managing derivatives portfolios.
Speculators expecting directional market moves.
7. Cost and Tax Comparison
ETFs:
Costs: Management fees (expense ratios), brokerage commission, and bid-ask spread.
Taxation: In India, equity ETFs held for over a year attract long-term capital gains tax (LTCG) at 10% above ₹1 lakh; short-term gains are taxed at 15%.
Index Trading:
Costs: Margin requirement, overnight rollover charges (for CFDs), exchange fees, and broker commissions.
Taxation: Profits from futures and options are treated as business income and taxed at slab rates. Losses can be carried forward for set-off.
8. Performance and Historical Context
Historically, ETFs have enabled retail investors to participate in market growth efficiently. For instance, the SPDR S&P 500 ETF (SPY), launched in 1993, has become one of the largest funds globally, offering consistent performance in line with the U.S. equity market.
On the other hand, index trading through derivatives has empowered traders to hedge risk and exploit volatility. The launch of index futures, such as Nifty Futures in India, significantly improved market depth and price discovery.
Both instruments have played critical roles in enhancing market efficiency and liquidity.
9. Global and Indian Market Perspective
Global Context
In developed markets like the U.S. and Europe, ETFs dominate retail and institutional portfolios due to low fees and easy access. Global ETF assets surpassed $10 trillion in 2023, driven by the rise of passive investing.
Indian Context
In India, ETFs have gained popularity through platforms like Nippon India ETF Nifty BeES, ICICI Prudential Nifty Next 50 ETF, and SBI ETF Sensex. Meanwhile, index trading through Nifty and Bank Nifty futures and options remains the backbone of India’s derivatives market, attracting massive daily volumes.
10. Future Trends
Thematic ETFs – Growing interest in innovation, AI, green energy, and digital assets.
Smart Beta ETFs – Combining passive and active strategies using factors like value or momentum.
ESG Indexes – Environmentally and socially conscious index products.
Algorithmic Index Trading – Automated strategies enhancing efficiency and reducing emotional bias.
Global Integration – Increasing cross-border ETF listings and index-linked products.
Conclusion
Both ETFs and index trading represent powerful tools for market participation — yet they serve different investor profiles.
ETFs suit long-term, passive investors who value diversification, stability, and simplicity.
Index trading, on the other hand, caters to active traders and professionals aiming to profit from short-term volatility or hedge risk using leverage.
The choice between ETFs and index trading depends on investment goals, time horizon, risk tolerance, and expertise. When used wisely, both can play complementary roles — ETFs for building wealth steadily, and index trading for tactical opportunities and portfolio protection.
In an evolving global financial ecosystem, understanding the nuances between these two approaches empowers investors to navigate markets more effectively, balance risk, and pursue consistent returns in both bullish and bearish environments.
Nifty - Expecting a minor dip with short term bullishnessSo as we studied yesterday, a sharp move was under development — and that’s exactly what played out today.
Today’s move in NSE:NIFTY was genuine as it was backed by strong buyers’ volume of nearly 70 million.
However, I believe that’s just half the action I was expecting. Since today’s Pivot Percentile is again tight, we may see another sharp move soon.
Intraday momentum looks a bit exhausted, so a small dip can’t be ruled out.
Pivot has now moved up to 25300, which will act as intraday support tomorrow.
If this level breaks, we can see 25250–25180 levels being tested — that would be a good opportunity to collect longs.
A crucial support remains at 25100. The short-term trend stays clearly bullish as long as this level holds.
Next important resistance stands at 25355 — if Nifty breaks this, we could see another rally toward 25500 or even higher.
NSE:BANKNIFTY also looks strong after crossing its short-term resistance at 56156.
With this setup, we’re actively trading in NSE:CNXPSUBANK
Another short-term theme looking good right now is NSE:NIFTY_IND_DEFENCE
That’s all for the day. Take care and have a profitable tomorrow.
📊 Levels at a glance:
Pivot: 25300
Support 1: 25250–25180 (buy zone on dip)
Support 2: 25100 (crucial level)
Resistance: 25355 (break = rally to 25500+)
Pivot Percentile: Tight (sharp move likely)
Bias: Short-term bullish with minor intraday dip expected
Sectors to watch: PSU Banks, Defence

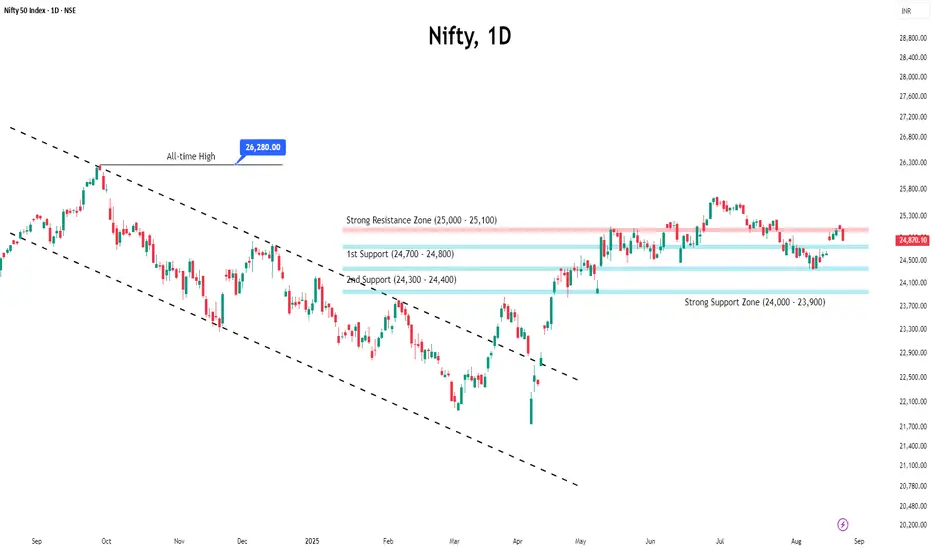
Positive Sentiment Drives Nifty Higher, Resistance in SightThe Nifty 50 closed the week on a positive note, rising nearly 1%, supported by strong macro cues and sectoral gains.
RBI Policy Boost:
The Reserve Bank of India kept the repo rate unchanged at 5.50% for the second straight meeting while raising FY26 GDP growth to 6.8% and lowering the inflation forecast — a move that lifted overall market sentiment.
Sector Highlights:
Banking stocks led the rally, with Bank Nifty up over 2% as private lenders like Kotak Mahindra Bank and Axis Bank posted solid gains.
Metals also shined, with Nifty Metal up 1.85%, driven by optimism over potential Fed rate cuts and a weaker dollar.
Key Levels to Watch:
Resistance: 25,000–25,100 remains a tough barrier. A breakout above 25,100 could spark a rally toward 25,400.
Support: 24,400–24,500 is the key zone to hold. A dip below this may trigger renewed selling pressure
Outlook:
The market is expected to consolidate within the current range, with sector rotation likely to drive short-term moves. Overall sentiment remains constructive as long as Nifty holds above key support levels.
Nasdaq Is About to Choose: Melt Up or MeltdownNasdaq E-minis (NQ1) are coiling at a key inflection point.
-If 24,874 breaks, a push into 25,100 looks likely.
-Clear that level, and bulls can stretch to 25,300–25,385 for a solid run.
-But if we lose 24,782, pressure builds toward 24,689… and a break there exposes 24,439.
Here’s the part most traders miss: these levels aren’t just numbers; they’re liquidity traps. One side of the market gets baited in, then the other side runs with it.
👉 Smart money already knows which pockets matter most. Retail will find out the hard way.
How are you positioning if NQ1 breaks either way?

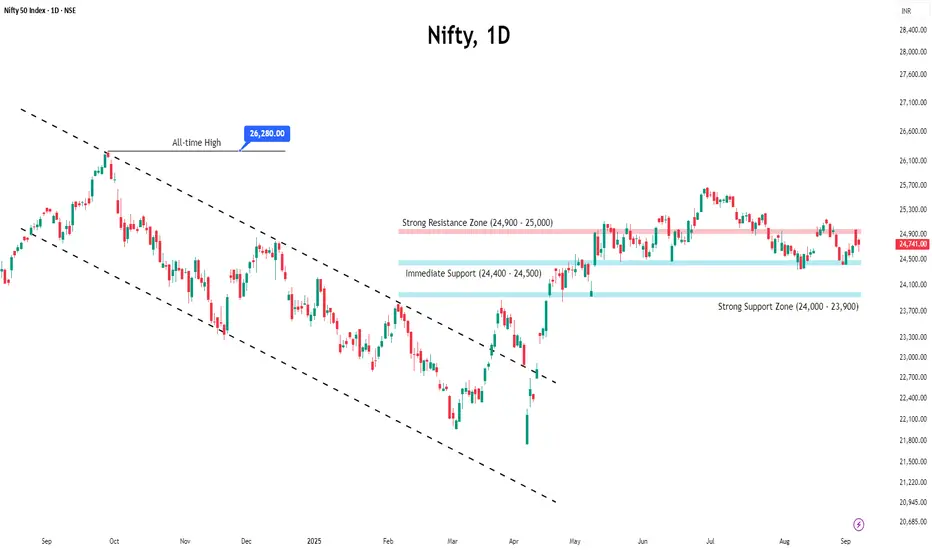
Market Mood Turns Sour as Nifty Slips Below 25KThe Nifty 50 ended its three-week winning streak with a sharp fall of ~2.6% , slipping below the crucial 25,000 psychological mark .
What Triggered the Decline?
● Global headwinds weighed on sentiment as trade tensions resurfaced, hurting risk appetite across equity markets.
● Domestic pressures coupled with persistent selling by foreign investors added to the weakness.
● Foreign Institutional Investors (FIIs) offloaded equities worth over ₹5,500 crore during the week.
● Concerns around a potential change in U.S. H-1B visa norms spooked the IT sector, a key driver of Indian exports.
Technical Backdrop
● The index has now fallen for 7 straight sessions , showing clear downward momentum.
● Immediate support: 24,400–24,500 zone. A break below this could drag the index toward the 23,900–24,000 strong support zone.
● Resistance levels: After slipping below the 25,000 mark, this level will now act as an immediate resistance. Strong resistance is placed at 25,400–25,500.
Market Outlook
With global uncertainties and foreign outflows, cautiousness and volatility are likely to dominate sentiment heading into October.
Strategy for Traders & Investors
● Maintain strict stop-loss discipline and manage position sizing carefully in this environment.
● For short-term traders: watch the 24,400–24,500 support zone for signs of reversal or breakdown.
● For investors: remain selective, focus on quality stocks, and avoid chasing momentum until stability returns.

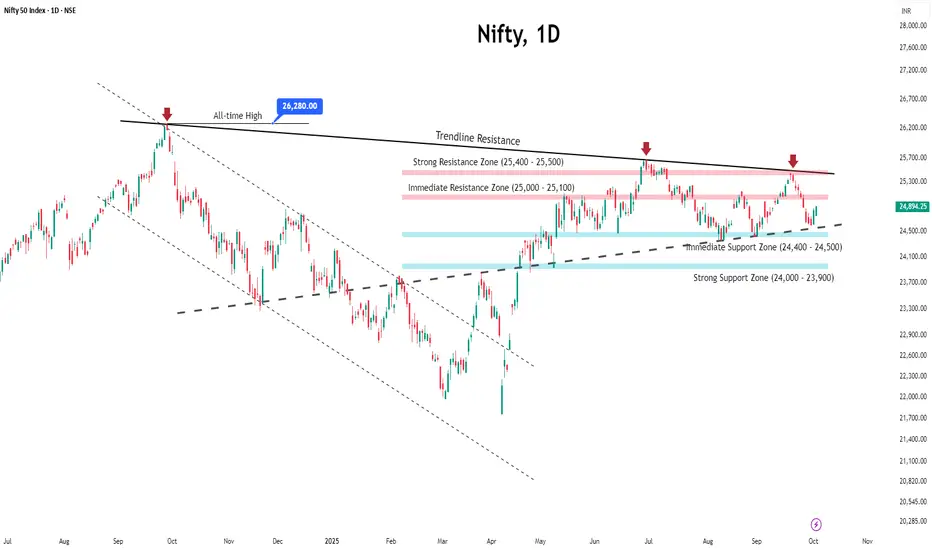
Nifty Rides 3-Week Rally, Faces Tough Resistance AheadThe Indian benchmark indices extended their rally for the third week in a row, reinforcing the ongoing bullish sentiment.
From a technical perspective, Nifty is trading just below its long-term trendline resistance, where it recently lost some steam. Immediate support lies in the 25,200–25,300 zone, while resistance is expected around 25,400–25,500, due to heavy call writing.
On the global front, markets were briefly unsettled after Donald Trump announced a sharp H-1B visa fee hike, triggering concerns for Indian IT companies. However, clarity came soon after — the White House confirmed that the $100,000 fee would apply only to new petitions, not to renewals or existing holders. This eased fears, ensuring minimal impact on ongoing IT operations.
Outlook: Nifty may witness short-term swings amid global uncertainties, but the broader setup still points to an underlying bullish trend.

Nifty Holds Above 25K, Market Drivers Signal More UpsideNifty’s winning streak hit eight sessions, closing above psychological 25,000 mark as global optimism and strong domestic cues kept the rally alive.
Technical View
● The index has registered a fresh breakout above the trendline resistance, pointing toward renewed bullish momentum.
Key Levels to Watch
● Immediate resistance is seen around 25,200–25,300, while a stronger hurdle lies at 25,500–25,600.
● Support has shifted higher to 25,000–24,900, keeping the short-term outlook positive.
Market Drivers
● Global cues: Hopes of a US Fed rate cut and progress on the India–US trade deal have lifted market sentiment.
● Domestic macros: India’s economy looks strong with solid financial stability, steady GDP growth, and easing inflation.
● Consumer demand: Spending is expected to rise sharply after September 22, especially in automobiles and consumer durables, which could boost markets in the near term.
● Policy & earnings: Market mood is supported by GST reforms, easier monetary policy, and positive earnings expectations for the second half of FY26.
Strategic View
● The overall market trend is expected to stay positive. Traders should follow a buy-on-dips strategy with strict stop-losses. As long as Nifty holds above support, it can gradually move higher in the coming sessions.

Nifty Wraps Week Positive: Sustainability in QuestionIndian equity markets closed the week with strong gains, with the Nifty rising 1.29% supported by solid domestic economic data and policy reforms.
Key economic indicators like Q1 GDP growth at 7.8%, steady FDI inflows, and a smaller current account deficit have boosted investor confidence.
Despite these positives, global challenges and heavy FII selling over the last two months (₹94,600 crore) still pose risks.
Sector-wise, the picture is mixed. While the overall market outlook is positive, weakness in banking and IT is restraining gains. A rebound in these sectors is crucial for the uptrend to sustain.
Technically, the index faces immediate resistance at the 24,950–25,000 zone, with support positioned at 24,500–24,400.
A decisive breakout from this range is needed to establish the next directional trend; otherwise, the market is poised for a period of consolidation.
Nifty Ends August in Pain: Can September Spark a Turnaround?Nifty slipped nearly 1.8% in the last week of August as global headwinds and US-India tariff concerns weighed on sentiment.
Selling was broad-based, with Banking and Financials dragging the index down the most.
The index currently trades just above 24,400, a crucial support level. Open interest data indicates that the 24,400–24,300 zone may provide short-term support, while the 25,500–25,600 zone remains significant resistance due to heavy call writing. A decisive break below 24,300 could quickly push the index toward 24,000.
Amid the weakness, a silver lining emerges — India’s strong 7.8% GDP growth, the highest in five quarters and well above expectations, may help cushion further downside.
Looking ahead, Monday’s open will set the tone for September—a gap-up above 25,500 could spark a rebound, while staying below may keep Nifty under pressure.
Nifty Hits Resistance; Volatility Looms Ahead of Monthly ExpiryReason Behind the Fall
The Indian market snapped its six-session winning streak on Friday as investors turned cautious ahead of US Federal Reserve Chair Jerome Powell’s speech at the Jackson Hole symposium.
Concerns over the upcoming 25% US tariffs, set to take effect on August 27, further added to market volatility.
Importantly, Powell signalled in his remarks on Friday that the Federal Reserve is likely to cut interest rates in September.
Technical Setup
The Nifty faced rejection from the key resistance zone of 25,000–25,100, which may trigger further downside towards 24,500–24,400.
OI Data Analysis
Open interest data shows significant call writing at 25,000, reinforcing it as a strong resistance for the upcoming monthly expiry.
On the downside, 24,800 is emerging as immediate support with notable put writing. If this level fails to hold, the next support is likely near 24,500.
Suggested Strategy
With the additional tariff deadline approaching alongside monthly expiry, heightened volatility is expected.
Traders are advised to stay cautious and adopt a wait-and-watch approach until the index provides clear directional cues.
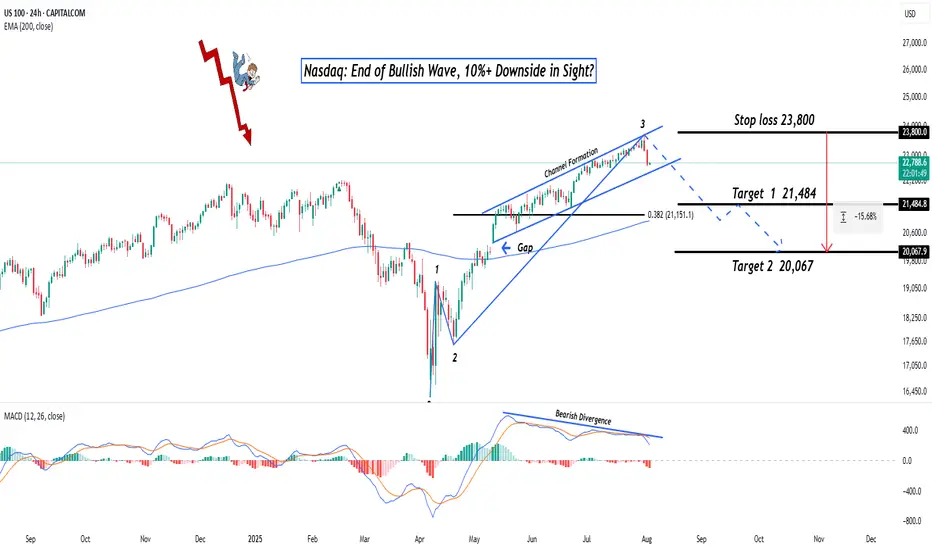
Nasdaq: End of Bullish Wave, 10%+ Downside in Sight?Hey Realistic Traders!
Has CAPITALCOM:US100 (Nasdaq) Finally Peaked? A Reversal Signal Just Flashed. Is This the Turning Point Toward a Deeper Pullback?
Let’s dive into the technicals to see what the chart is really telling us.
Technical Analysis
On the daily chart, the Nasdaq is starting to show signs of weakness. A bearish divergence has formed between the MACD and price movement , which is a classic signal that bullish momentum may be fading. This often indicates the potential for a trend reversal or a deeper correction.
A recent drop, confirmed by a strong bearish full-body candlestick, suggests that selling pressure is increasing. If this continues, we expect a breakdown from the current bullish channel.
In this scenario, the extended Wave 3 may have reached its peak. A correction could follow, with the first target at 21484, which lines up with the 0.382 Fibonacci retracement level. If the decline continues, the next downside target would be around 20067, where a previous gap may be filled.
This bearish outlook remains valid as long as the price stays below 23800 . A move above that level would invalidate the setup and return the outlook to neutral.
Support the channel by engaging with the content, using the rocket button, and sharing your opinions in the comments below.
Disclaimer: "Please note that this analysis is solely for educational purposes and should not be considered a recommendation to take a long or short position on Nasdaq.
Pressure Builds on Nifty Before ExpiryThe Nifty traded in a tight range for most of the week but eventually slipped below the 25,000 mark, ending on a weak note.
With the monthly expiry approaching, the index is likely to remain under pressure, and volatility may pick up in the coming sessions.
Key resistance levels are seen at 25,200 and 25,500. A decisive move above 25,500 could trigger an upside breakout. On the downside, support is expected around 24,500 and 24,400.
Given the current structure, traders are advised to stay cautious, focus on selective opportunities, and avoid aggressive positions until a clearer trend emerges.
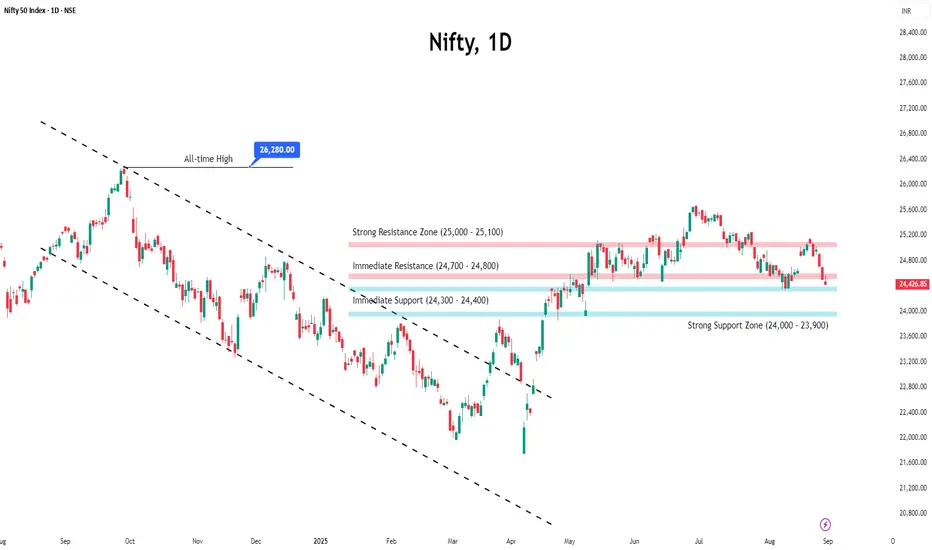
Nifty Closes Below 25,000 — What Lies Ahead?The Indian market's recent uptrend appears to be losing momentum, as the benchmark Nifty index extended its decline for the third consecutive week, ending just below the important 25,000 mark.
This pullback has been largely driven by weakness in the Financial and IT sectors, with major players like NSE:TCS , NSE:HCLTECH , and NSE:AXISBANK posting disappointing earnings.
From a technical perspective, the index is now approaching a key support zone near 24,900. A decisive break below this level could open the door for a further slide towards 24,500.
Open Interest (OI) data reinforces this view, with the 25,000–24,900 zone seeing the highest put writing, marking it as an immediate support area. On the upside, strong call writing at 25,100 and 25,200 on Friday suggests these levels will act as immediate resistance.
Given the current structure, the outlook for the coming week remains neutral to bearish.
Traders are advised to stay cautious, manage risk effectively, and keep a close watch on these crucial levels.

Market Mood Sours as Inflation Surprises AgainU.S. stock markets were under pressure on Tuesday after new inflation data came in higher than expected. This has made investors rethink how soon the Federal Reserve might cut interest rates.
What Happened?
● The Consumer Price Index (CPI) recorded its biggest monthly rise in 5 months.
● Core inflation (which excludes food and energy) jumped by 2.9% compared to last year — more than the Fed's 2% target.
What It Means
● Investors had expected the Fed to cut interest rates multiple times in 2025.
● After the inflation report, they now think the Fed will cut less than expected.
● The chances of a rate cut in September also dropped sharply.
Market Impact
● Bond yields went up — the 10-year U.S. government bond yield rose to 4.49%, making borrowing more expensive.
● Stock futures fell (Dow, S&P 500, Nasdaq), as higher yields tend to hurt company profits and stock prices.
S&P 500 and Dow Struggle at Resistance
● Both the S&P 500 and Dow Jones faced resistance near all-time highs.
● This rejection suggests potential for further short-term pullback, especially if macro pressures like inflation and rate uncertainty persist.
Near-Term Outlook
With inflation running hotter than expected, hopes for early Fed rate cuts have cooled. Traders and investors should remain cautious, manage risk actively, and prepare for continued volatility in the coming weeks.

Nifty Dips, Suggests Range-Bound Movement AheadIndian markets ended the week with a decline of nearly one percent, driven by lingering concerns over global tariffs and a weak start to the earnings season.
The 25,500 level has now turned into a strong resistance zone, marked by heavy call writing, while 25,000 continues to act as a solid support level backed by significant put writing.
Given these dynamics, the index is likely to enter a consolidation phase, with upcoming earnings announcements expected to keep sectoral volatility elevated.
S&P500: Top Within ReachThe S&P has recently continued its upward movement, climbing higher into the magenta-colored Short Target Zone between 5,880 and 6,166 points. Primarily, we expect the top of the current wave (X) in magenta within this price range, after which a downtrend should follow with wave (Y). This final phase of the magenta three-part movement should lead the index into the green Long Target Zone between 4,988 and 4,763 points, completing the overarching green wave there. A rise above the upper boundary of the Target Zone and a breach of resistance at 6,675 points would trigger our alternative scenario.
📈 Over 190 precise analyses, clear entry points, and defined Target Zones - that's what we do.

US30 Locked & Loaded – Get In, Get Profit, Get Out!**💰 Market Heist Alert: US30 Setup 🔥**
Yo Money Raiders & Chart Bandits! 🏴☠️📈
US30 is ripe for the taking, and we’re rollin’ in with the *Thief Trading Style*—a slick mix of sniper-level technicals and street-smart fundamentals. Whether it’s bull or bear, we strike fast, grab profit, and vanish! 💨💸
---
**🧠 The Blueprint – US30 Hit Plan**
**📍 Entry Zones:**
🔹 **Bullish Strike 1**: Look for a pullback and **buy at 42400** – clean signal to enter the action!
🔹 **Bullish Strike 2**: Set your sights on **40900 - 40800**, inside the Institutional Buy Zone. Wait for an MA pullback, then hit it hard. Fortune favors the bold! ⚔️
🔹 **Bearish Ambush**: If price breaks down below **41600**, it’s time to ride that bear wave 🐻💨
💡 **Pro Bandit Tip**: Set alerts on key levels so you never miss the moment! 🔔
---
**🛑 Stop Loss Defense:**
Protect the stash! Use the **nearest 4H low** as your SL for day/swing trades.
Tweak based on your risk level, lot size, and open positions. 🛡️
---
**🎯 Profit Targets – Take the Loot:**
💥 **Bullish Goal**: Lock in at **44200** – or escape early if momentum cools 😎
💥 **Bearish Goal**: Target **40600** – but don’t overstay if signs reverse 🚪
🚨 Watch out for overbought/oversold traps – this is where many fall.
---
**⚠️ Risk Alert – News Incoming!**
News events = wild moves. Handle with care:
📰 Avoid new entries during major news drops
📉 Use **trailing SL** to secure profits and manage risk like a pro
Stay smart. Stay ready. This is a heist, not a gamble! 💼💣
---
**🚀 Boost the Thief Trading Movement!**
If this setup hits your style, smash that **boost** and show love to the Thief Crew! 💪
We raid charts daily with precision, profit, and a bit of outlaw swagger. Let’s own the US30 together! 🤝💵
Stay sharp, alerts on, and eyes wide—more setups coming soon.
Catch you in the green, bandits! 🤑🎉📊

S&P500 - The bottom we have been waiting for!The S&P500 - TVC:SPX - officially created the bottom:
(click chart above to see the in depth analysis👆🏻)
This month we officially saw one of the craziest stock market fakeouts of the past decade. With a drop and reversal rally of about +15%, the S&P500 is about to even close with a green monthly candle, which then indicates that the stock market bottom was created.
Levels to watch: $120, $250
Keep your long term vision!
Philip (BasicTrading)
