DOW JONES INDEX (US30): Bullish Trend Continuation
I see a confirmed BoS on US30 index and a valid
violation of a resistance based on a previous ATH.
With a high probability, the market will rise more soon.
Next resistance - 49500
❤️Please, support my work with like, thank you!❤️
I am part of Trade Nation's Influencer program and receive a monthly fee for using their TradingView charts in my analysis.
Indexes

DOW JONES INDEX (US30): Bullish Setup Explained
Dow Jones broke and closed above a resistance line of an
expanding wedge pattern.
An occurrence of a consequent change of character suggests
a highly probable bullish continuation.
The market will most likely reach 48527 soon.
❤️Please, support my work with like, thank you!❤️
I am part of Trade Nation's Influencer program and receive a monthly fee for using their TradingView charts in my analysis.

S&P500 INDEX (US500): Important Breakout
US500 broke and closed above a significant daily horizontal resistance cluster.
It indicates a highly probable growth further to a current ATH.
Expect a rise at least to 6915 level after a pullback.
❤️Please, support my work with like, thank you!❤️
I am part of Trade Nation's Influencer program and receive a monthly fee for using their TradingView charts in my analysis.

DOW JONES INDEX (US30): Pullback From Support
US30 index may rise from the underlined intraday support.
A bullish change of character on an hourly time frame
indicates a strong buying interest.
Goal - 48185
❤️Please, support my work with like, thank you!❤️
I am part of Trade Nation's Influencer program and receive a monthly fee for using their TradingView charts in my analysis.

DOW JONES (US30): Pullback Trade
I see a confirmed bullish Change of Character on US30
on an hourly time frame after a test of an intraday support.
I expect a pullback now at least to 48427 level.
❤️Please, support my work with like, thank you!❤️
I am part of Trade Nation's Influencer program and receive a monthly fee for using their TradingView charts in my analysis.

DOW JONES INDEX (US30): Bullish Move From Support
US30 broke and closed above a horizontal resistance cluster
based on a previous All-Time High.
The broken structure turned into a strong support.
We see its retest this morning.
Probabilities will be high, that the market will rise
and reach at least 46726 resistance soon.
❤️Please, support my work with like, thank you!❤️
I am part of Trade Nation's Influencer program and receive a monthly fee for using their TradingView charts in my analysis.

DOW JONES INDEX (US30): Important Breakout
US30 broke and closed above a key daily resistance.
The broken structure turned into a major support.
There will be a high chance to see more growth next week.
Goal will be 49000.
❤️Please, support my work with like, thank you!❤️
I am part of Trade Nation's Influencer program and receive a monthly fee for using their TradingView charts in my analysis.

S&P500 INDEX (US500): Bullish Move After Trap
I see a confirmed liquidity grab after a test of a major
intraday demand zone on US500.
An occurrence of a buying imbalance afterward
suggests a strong bullish pressure.
I expect a rise at least to 6875
❤️Please, support my work with like, thank you!❤️
I am part of Trade Nation's Influencer program and receive a monthly fee for using their TradingView charts in my analysis.

$EUIRYY- E.U CPI (November/2025)ECONOMICS:EUIRYY 2.2%
November/2025
source: EUROSTAT
- The annual inflation rate in the Eurozone edged up to 2.2% in November from 2.1% in October, slightly above expectations of 2.1%.
Prices grew faster in the services sector, while energy costs continued to decline but at a slower pace.
Meanwhile, core inflation held steady at 2.4%.

DOW JONES (US30): Pullback From Trend Line
US30 is testing a recently broken solid rising trend line
on a daily time frame.
I believe that odds are high that the market will retrace from that.
We can expect a pullback to 47300
❤️Please, support my work with like, thank you!❤️
I am part of Trade Nation's Influencer program and receive a monthly fee for using their TradingView charts in my analysis.

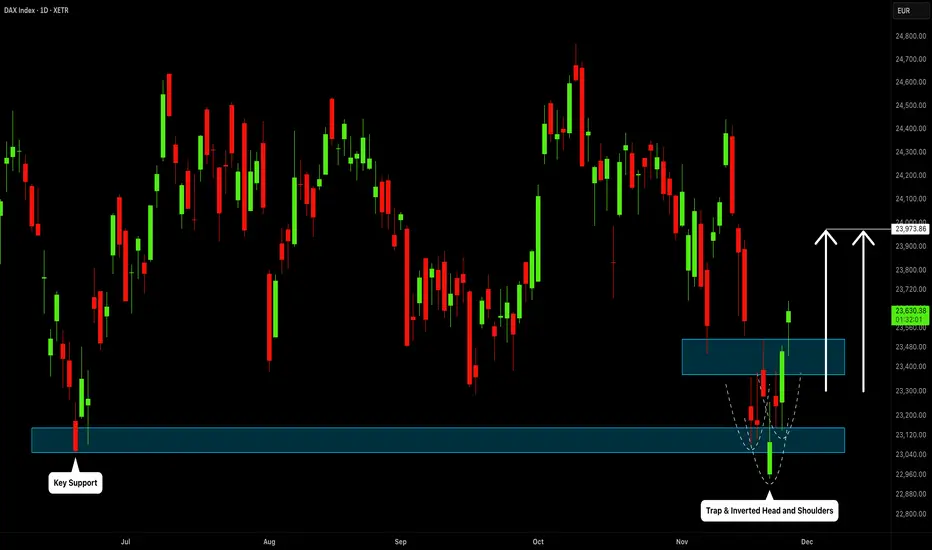
DAX INDEX: Finally Bullish?!
I see a confirmed bearish trap on DAX index
after a test of a key historic support.
An inverted head & shoulders pattern formation
and a bullish violation of its neckline provide strong
signal.
I expect a recovery at least to 24000 now.
❤️Please, support my work with like, thank you!❤️
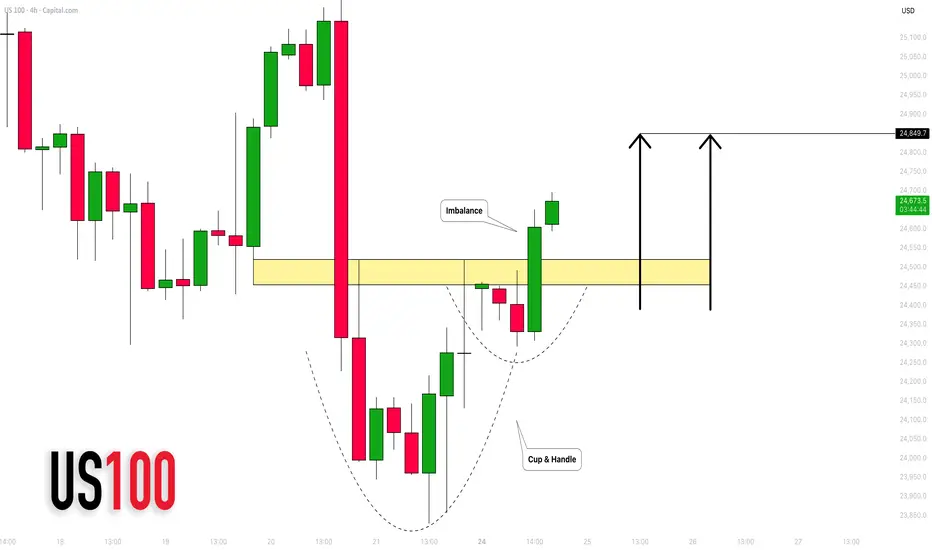
NASDAQ INDEX (US100): Strong Bullish Pattern
There is a high chance that US100 will rise
after a formation of a cup & handle pattern on a 4h time frame
with a breakout of its neckline with a bullish imbalance.
Expect a rise at least to 24850
❤️Please, support my work with like, thank you!❤️
I am part of Trade Nation's Influencer program and receive a monthly fee for using their TradingView charts in my analysis.
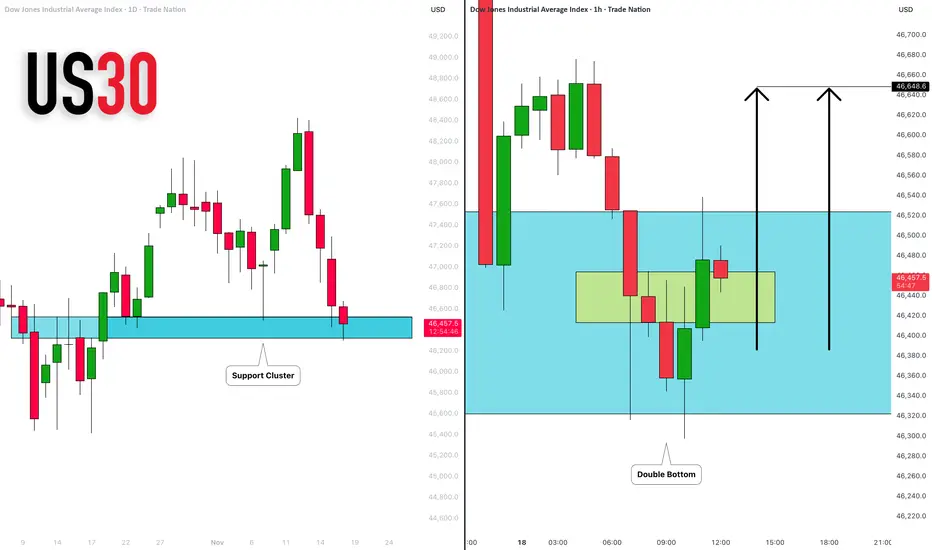
DOW JONES INDEX (US30): Time to Buy?!
It feels like US30 has finally found a bottom.
I see a strong buying interest after a test of a key
historic support cluster.
I anticipate a pullback at least to 46648
❤️Please, support my work with like, thank you!❤️
I am part of Trade Nation's Influencer program and receive a monthly fee for using their TradingView charts in my analysis.
All Federal Employees To US PopulationI think it is important for people to full understand that the 172,000 job cuts from the Federal Government is more about showmanship than logic.
The federal gov employees as a % of the population has been falling for decades through the growth of the population and the economy.
This is the absolute best way to reduce gov. Debt, deficits, etc.. through growth, NOT cutting and causing a heart attack!
Slow mythological, calculated cuts if/when they are required are fine. chaotic, reactive, for the sake of showmanship is NOT!
This will not end well. There will be consequences, people have yet to realize and appreciate the severity of these actions.
These actions taken by the current administration will be felt in the markets.

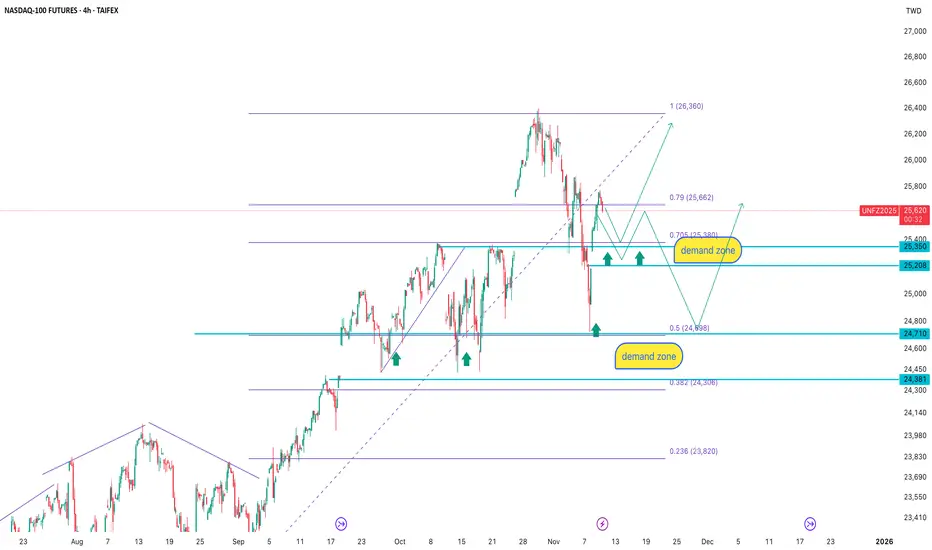
NASDAQ-100 4H: demand is not gone, only waiting for the priceAfter the recent upward impulse, the price retraced into the key demand zone at 25 350–25 208, an area that has repeatedly triggered buying reactions in the past. T
he latest correction pushed the price into the 0.79–0.705 Fibonacci range, which frequently acts as a retest zone before continuation.
Below that lies an even stronger demand zone at 24 710–24 381, aligning with the 0.5 Fibonacci level and previous volume accumulation.
The trading logic here is simple: don’t chase the move, let the price come to demand and wait for confirmation.
As long as the market structure holds, the primary scenario remains bullish from demand zones with a target toward 26 360 and potentially higher.
Fundamentally, NASDAQ remains supported by expectations of softer Fed policy, strong tech capital inflows, and continued investment in AI, cloud, and data-center infrastructure. Smart money accumulates on corrections, not on peaks.
When price falls into demand, it’s not fear — it’s opportunity.
DOLLAR INDEX (DXY): Too Overbought Now
Looks like Dollar Index finally starts correction.
A test of a significant hisotric daily resistance triggered
a bearish movement and an intraday change of character
on a 4H time frame.
I think that the market may drop lower.
Goal - 99.8
❤️Please, support my work with like, thank you!❤️

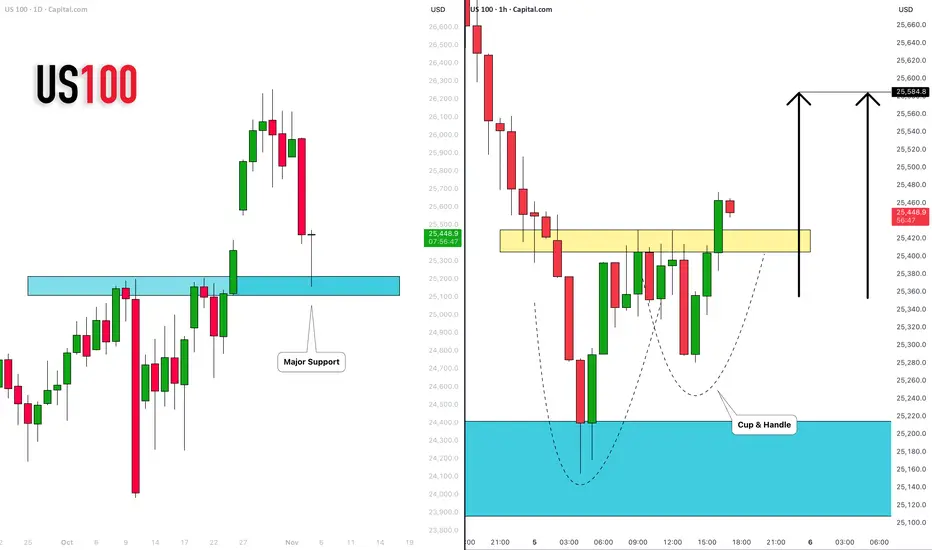
NASDAQ INDEX (US100): Time to Recover
US100 index dropped yesterday, as I predicted.
The market is recovering now, after a test of a major daily support cluster.
A formation of a cup & handle pattern on that and a breakout of its neckline
indicate a strong buying pressure.
With a high probability, the market will rise and reach 25580 level soon.
❤️Please, support my work with like, thank you!❤️
I am part of Trade Nation's Influencer program and receive a monthly fee for using their TradingView charts in my analysis.
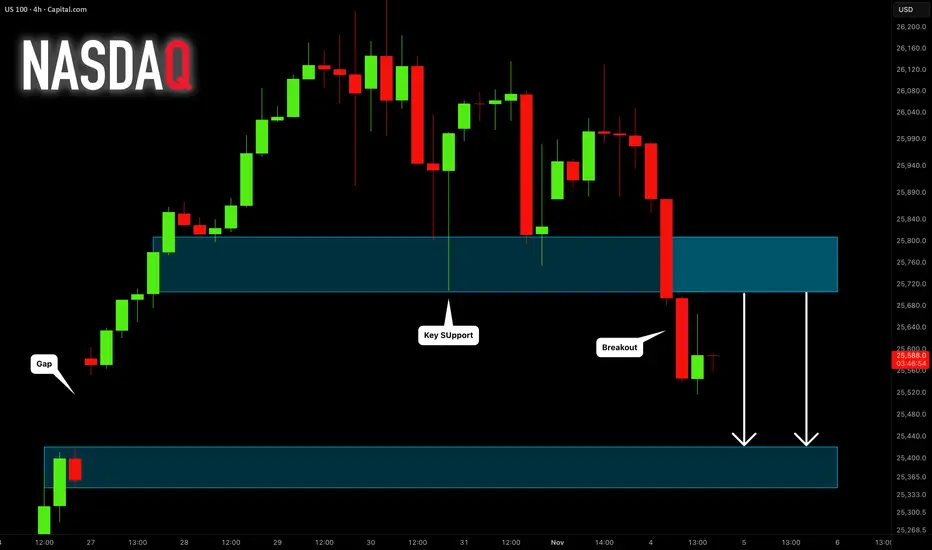
NASDAQ INDEX (US100): Forgotten Gap
A week ago, US100 formed a gap up opening.
It looks like the index is finally ready to fill it.
A breakout of a major horizontal support is a strong bearish signal.
Expect a bearish continuation to 25420.
❤️Please, support my work with like, thank you!❤️
I am part of Trade Nation's Influencer program and receive a monthly fee for using their TradingView charts in my analysis.
Dollar Index (DXY): Confirmed BoS
Dollar Index keeps following our plan.
The market closed on Friday, breaking a previous local high
and setting a new higher high higher close with a confirmed BoS.
We can expect more growth and a highly probable test of 100.0 level soon.
❤️Please, support my work with like, thank you!❤️
I am part of Trade Nation's Influencer program and receive a monthly fee for using their TradingView charts in my analysis.

DOLLAR INDEX (DXY): More Growth Ahead
A quick follow-up for the yesterday's idea for Dollar Index.
The market successfully violated a resistance line of a symmetrical triangle
pattern on a daily time frame.
We see its retest this morning.
A confirmed bullish CHoCH on an hourly time frame gives us a strong
intraday bullish confirmation.
There is a high chance that the Index will continue rising.
Goal - 99.35
❤️Please, support my work with like, thank you!❤️
I am part of Trade Nation's Influencer program and receive a monthly fee for using their TradingView charts in my analysis.

DOLLAR INDEX (DXY): Consolidation Ahead of FOMC
Dollar Index weakens ahead of FED rate decision today.
The market formed a symmetrical triangle pattern on a daily.
A breakout of one of its boundaries after an interest rate decision
announcement will accurately indicate a future direction of the market.
❤️Please, support my work with like, thank you!❤️
I am part of Trade Nation's Influencer program and receive a monthly fee for using their TradingView charts in my analysis.

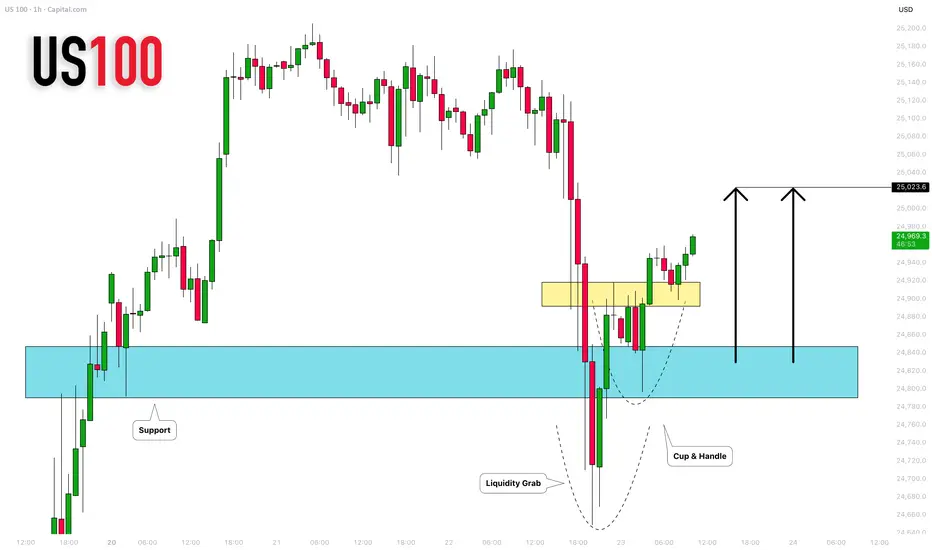
NASDAQ INDEX (US100): Bullish Move After the Trap
I see a confirmed liquidity grab below a key horizontal support
on an hourly time frame.
A formation of a cup & handle pattern and a breakout of its neckline
afterward suggest a strong buygin interest.
The market will rise more and reach at least 25023 level.
❤️Please, support my work with like, thank you!❤️
I am part of Trade Nation's Influencer program and receive a monthly fee for using their TradingView charts in my analysis.
Dollar Index (DXY): New Bullish Wave Confirmed?!
Here a quick follow-up for my recent idea for Dollar Index.
The price retested a recently broken major horizontal structure cluster
and even went below that with a bearish trap.
A rising trend line was respected as a strong vertical support
and we see a bullish continuation now.
I think that we can expect a rise at least to 99.3 level now.
❤️Please, support my work with like, thank you!❤️
