Bitcoin Strategic Interval, CME Dislocation and Macro Friction.⊢
𝟙⟠ - BTC/USDT - Binance - (CHART: 1W) - (June 17, 2025).
⟐ Analysis Price: $106,851.31.
⊢
I. ⨀ Temporal Axis – Strategic Interval - (1W):
▦ EMA21 – ($96,818.00):
∴ The current candle closes +10.3% above the EMA21, maintaining bullish dominance over the mid-term dynamic average;
∴ This is the 17th consecutive weekly candle closing above the EMA21 since its reclaim in February 2025, forming a structurally intact uptrend;
∴ No violation or wick-close below the EMA21 has occurred since April, and the distance from price to EMA21 remains within a standard deviation of mid-trend movement.
✴ Conclusion: The trend is active and preserved. EMA21 acts as dynamic support and bullish pressure zone. A reversion would only be expected if weekly closes return below $98K with volume confirmation.
⊢
▦ SMA200 – ($48,969.73):
∴ The 200-week simple moving average remains untouched since early 2023, never tested during the current cycle;
∴ The slope of the SMA200 is positive and gradually increasing, indicating a long-term structural trend recovery;
∴ Price stands +118% above the SMA200, a level historically associated with mid-cycle rallies or overheated continuation phases.
✴ Conclusion: The SMA200 confirms long-term bullish structure. Its current distance from price makes it irrelevant for immediate action but critical as the absolute invalidation level of the macro trend.
⊢
▦ Ichimoku – Kumo | Tenkan | Kijun:
∴ Price is above the Kumo cloud, with Span A ($107,172.16) and Span B ($98,562.38) creating a bullish tunnel of support;
∴ The Kijun-sen rests at $95,903.19, slightly below EMA21, and aligns with the last strong horizontal range;
∴ Chikou Span is free from historical candles, confirming trend continuity under Ichimoku principles.
✴ Conclusion: All Ichimoku components are aligned bullish. Pullbacks to the Kijun around $96K would be healthy within a macro-uptrend, and only sub-cloud closes would question this formation.
⊢
▦ Fibonacci - (Swing Low $49,000 – High $111,980):
∴ Bitcoin remains between the (0.236 Fibo - $97,116.72) and local top at $111,980, showing respect for fib-based resistance;
∴ The (0.5 Fibo - $80,490.00) has not been retested since March, confirming the range compression toward upper quadrants;
∴ Weekly price is consolidating under fib extension with decreasing body size, suggesting strength with pause.
✴ Conclusion: The Fibonacci structure confirms bullish extension phase. If $97K breaks, retracement to (0.382 Fibo - $87,921.64) is expected. Otherwise, the breakout above $112K enters full projection territory.
⊢
▦ MACD – (Values: 1,077.98 | 5,963.81 | 4,885.82):
∴ MACD line remains above signal line for the third consecutive week, recovering from a prior bearish cross in April;
∴ The histogram has printed higher bars for four weeks, but the slope of growth is decelerating;
∴ Positive cross occurred just below the zero-line, which often results in delayed reactions or failures unless reinforced by volume.
✴ Conclusion: MACD signals a weak but persistent momentum recovery. Reaffirmation depends on histogram expansion above 1,500+ and signal spread widening.
⊢
▦ RSI – (Close: 64.37 | MA: 57.56):
∴ The RSI is in the bullish upper quadrant, but without overbought extension, suggesting active buying without euphoria;
∴ The RSI has been above its moving average since mid-May, maintaining a healthy angle;
∴ Momentum is not diverging from price yet, but is approaching the 70 zone, historically a point of hesitation.
✴ Conclusion: RSI confirms controlled strength. Further advance without consolidation may trigger premature profit-taking. Above 70, caution increases without being bearish.
⊢
▦ Volume - (16.97K BTC):
∴ Weekly volume is slightly above the 20-week average, marking a minor recovery in participation;
∴ There is no volume spike to validate a breakout, which is common in compressive ranges near resistance;
∴ Volume has been declining since mid-May, forming a local divergence with price highs.
✴ Conclusion: Volume profile supports current levels but does not confirm breakout potential. A rejection with strong volume will mark local exhaustion.
⊢
II. ∆ CME Technical Dislocation – BTC1! Futures:
▦ CME GAP – BTC1! – ($107,445.00):
∴ The CME Futures opened this week at $105,060.00 and closed the previous session at $107,445.00;
∴ A clear unfilled gap persists between $105,060.00 and $107,900.00, with price action hovering just above the top edge;
∴ Bitcoin has a consistent historical behavior of returning to close such gaps within a short- to mid-term range.
✴ Conclusion: The unfilled CME gap acts as a gravitational technical force. As long as price remains below $109K without volume expansion, the probability of revisiting the $105K area remains elevated.
⊢
III. ∫ On-Chain Intelligence – (Source: CryptoQuant):
▦ Exchange Inflow Total - (All Exchanges):
∴ Current inflow volume remains below the 1,000 Bitcoin daily threshold, indicating no panic selling or institutional exits;
∴ This inflow level corresponds to accumulation or holding phases, rather than distribution;
∴ The pattern matches a neutral-to-positive mid-cycle environment.
✴ Conclusion: There is no structural on-chain pressure. As long as inflows remain low, risk of capitulation or distribution is minimal.
⊢
▦ Spot Taker CVD - (Cumulative Volume Delta, 90-day) – (All Exchanges):
∴ The 90-day CVD shows continued dominance of taker buys over sells, reflecting ongoing demand strength in spot markets;
∴ However, the curve is flattening, suggesting buyers are meeting resistance or fading interest;
∴ No sharp reversal in the CVD curve is detected — only saturation.
✴ Conclusion: Demand remains dominant, but the pace is decelerating. Without renewed volume, this curve may revert or plateau.
⊢
▦ Exchange Inflow Mean - (MA7) – (All Exchanges):
∴ The 7-day moving average of exchange inflow continues to decline steadily;
∴ This metric often precedes calm phases or pre-breakout plateaus;
∴ Historical patterns show similar inflow behavior before prior volatility expansions.
✴ Conclusion: A period of silence is unfolding. Reduced mean inflow suggests price is awaiting external catalysts for movement.
⊢
▦ Funding Rates – (Binance):
∴ Current funding rates are neutral, with slight positive bias, suggesting balanced long-short sentiment;
∴ No extreme spikes indicate absence of excessive leverage;
∴ This equilibrium typically precedes significant directional moves.
✴ Conclusion: Market is leveled. Funding neutrality reflects hesitation and prepares ground for upcoming directional choice.
⊢
IV. ⚖️ Macro–Geopolitical Axis – (Powell, Middle East & BTC/XAU):
▦ MACRO CONTEXT:
∴ Jerome Powell is scheduled to speak on Wednesday (June 19), with markets anticipating remarks on rate stability or future hikes;
∴ Ongoing tensions in the Middle East (Israel–Iran) elevate risk-off behavior in traditional markets;
∴ Bitcoin has triggered a rare Golden Cross vs. Gold, as noted by U.Today, signaling digital strength over legacy value.
✴ Conclusion: Macro remains the primary external catalyst. Powell’s statement will determine short-term volatility. Until then, Bitcoin floats between its technical support and CME magnetism, with gold dynamics providing long-term bullish backdrop.
⊢
⚜️ 𝟙⟠ Magister Arcanvm – Vox Primordialis!
⚖️ Wisdom begins in silence. Precision unfolds in strategy.
⊢
Indicators

PTON Peloton Potential Buyout Interest from Amazon or NikeIf you haven`t bought the dip on PTON, before the rally:
Now Peloton Interactive PTON remains a compelling bullish candidate in 2025, supported not only by strategic buyout interest from major players like Amazon and Nike but also by significant unusual options activity signaling strong investor conviction in a near-term upside move. These factors combined create a powerful catalyst for a potential stock rally.
1. Confirmed Buyout Interest from Amazon and Nike
Since 2022, credible reports have indicated that Amazon and Nike are exploring acquisition opportunities for Peloton, recognizing its value as a leading connected fitness platform with over 2 million subscribers.
Amazon’s interest fits its broader health and smart home ambitions, while Nike sees Peloton as a strategic extension of its digital fitness ecosystem.
Such buyout interest implies a potential premium valuation, which could trigger a sharp upward re-rating of Peloton’s shares if a deal materializes or even if speculation intensifies.
2. Massive Unusual Call Option Activity for July 18, 2025 Expiry
A mystery trader recently purchased over 80,000 call options on Peloton with a $7 strike price expiring July 18, 2025, representing a $3.1 million bet on a price rise within the next few months.
On May 20, 2025, over 90,000 contracts of the $7 strike call expiring July 18, 2025 traded, equating to roughly 9 million underlying shares—well above Peloton’s average daily volume.
This unusually high call volume signals strong bullish sentiment and possible insider or institutional anticipation of a positive event, such as a buyout announcement or operational turnaround.
3. Strategic Fit and Synergies for Acquirers
Peloton’s subscription-based connected fitness platform offers Amazon and Nike a valuable recurring revenue stream and engaged user base.
Amazon could integrate Peloton’s offerings into its ecosystem of devices, health services, and e-commerce, while Nike could leverage Peloton’s content and hardware to deepen its digital fitness presence.
The potential for cross-selling, brand synergy, and data monetization enhances Peloton’s attractiveness as an acquisition target.
4. Attractive Valuation and Growth Potential
Peloton’s market cap has contracted significantly, making it an affordable target for large corporations with strategic interests in health and fitness.
Recent product launches, cost-cutting measures, and renewed marketing efforts aim to stabilize and grow Peloton’s subscriber base and revenue.
The connected fitness market continues to expand, driven by consumer demand for at-home and hybrid workout solutions.
5. Technical and Sentiment Indicators
The stock has shown signs of stabilizing after recent volatility, with support forming near $6–$6.50.
The surge in call options activity, especially at strikes above current prices, suggests growing investor confidence in a near-term breakout.
Historical patterns show Peloton’s stock reacts strongly to buyout rumors and unusual options volume, often resulting in rapid price appreciation.
Disclosure: I am part of Trade Nation's Influencer program and receive a monthly fee for using their TradingView charts in my analysis.

WOOF Petco Health & Wellness Company Potential Bullish ReversalIf you haven`t sold WOOF before this major retracement:
WOOF Petco Health and Wellness Company has experienced a notable selloff recently, with its stock price declining to around $2.47 as of mid-June 2025. However, several fundamental and technical factors suggest that WOOF could be poised for a meaningful reversal and upside recovery in the near to medium term.
1. Attractive Valuation and Upside Potential
Despite the recent pullback, Petco’s stock is trading at a compelling valuation relative to its long-term growth potential.
Price forecasts for 2025 indicate an average target of approximately $3.55, representing a 43.7% upside from current levels.
More optimistic scenarios project highs up to $7.05 within this year, suggesting significant room for a rebound if market sentiment improves.
Long-term forecasts are even more bullish, with price targets of $14 by 2030 and as high as $77 by 2040, reflecting confidence in Petco’s strong market position and growth prospects.
2. Resilient Business Model in a Growing Pet Care Market
Petco operates in the resilient pet care and wellness industry, which benefits from secular trends such as increased pet ownership, premiumization of pet products, and growing consumer spending on pet health.
The company’s omni-channel approach—combining e-commerce with physical stores and veterinary services—positions it well to capture multiple revenue streams.
Petco’s focus on health and wellness services, including veterinary care and pet insurance, provides higher-margin growth opportunities that can drive profitability improvements.
3. Technical Signs of Stabilization and Potential Reversal
After the recent selloff, WOOF’s stock price has found some support near the $2.40–$2.50 level, with increased trading volumes indicating growing investor interest.
The stock’s recent modest gains and stabilization suggest that selling pressure may be easing, setting the stage for a potential technical rebound.
Options market activity and analyst upgrades reflect improving sentiment.
4. Improving Operational Execution and Financial Health
Petco has been investing in expanding its veterinary services and digital capabilities, which are expected to contribute to revenue growth and margin expansion.
The company’s recent earnings calls and financial reports highlight progress in cost management and customer engagement initiatives.
Strong cash flow generation and manageable debt levels provide flexibility to invest in growth and weather macroeconomic uncertainties.
5. Market Sentiment and Analyst Support
While some analysts remain cautious, the overall sentiment is shifting toward a more constructive outlook, with several price target upgrades and “hold” to “buy” rating adjustments.
The combination of attractive valuation, improving fundamentals, and sector tailwinds is likely to attract renewed institutional interest.

Bullish Thesis: Why Oscar Health OSCR Could Rally Strong in 2025Oscar Health, OSCR, a technology-driven health insurance company, is positioned for a significant stock price appreciation in 2025. Despite some mixed short-term sentiment, the long-term outlook and recent analyst forecasts suggest a potential rally that could more than double the current share price. Here’s why OSCR could be a compelling bullish opportunity this year:
1. Strong Analyst Price Targets Indicate Upside of Over 125%
According to recent forecasts, OSCR is expected to reach an average price of $31.40 in 2025, with some analysts projecting highs as much as $41.31—a potential upside exceeding 125% from the current price near $13.95.
Monthly forecasts show a steady upward trajectory, with July 2025 targets around $37.24 and December 2025 targets near $34.67, highlighting sustained bullish momentum throughout the year.
The average 12-month price target is around $34.40, representing a 146% upside, signaling strong confidence in OSCR’s growth prospects.
2. Innovative Business Model and Growth Potential
Oscar Health leverages technology and data analytics to offer user-friendly, transparent health insurance plans, differentiating itself in a traditionally complex industry.
Its focus on member engagement, telemedicine, and cost-effective care management positions it well to capture market share as healthcare consumers increasingly demand digital-first solutions.
The company’s expanding footprint in both individual and Medicare Advantage markets provides multiple growth avenues.
3. Long-Term Vision and Market Opportunity
Beyond 2025, forecasts remain highly bullish, with OSCR projected to reach $53.77 by 2027 and nearly $100 by 2030, reflecting strong secular growth potential in the health insurance and digital health sectors.
Analysts see Oscar as a disruptive force with the potential to reshape healthcare delivery, driving substantial long-term shareholder value.
4. Improving Financial Metrics and Operational Execution
Oscar has been improving its loss ratios and operating efficiencies, which are critical for sustainable profitability.
The company’s investments in technology infrastructure and data-driven care management are expected to translate into better margins and revenue growth over time.
5. Market Sentiment and Analyst Ratings
While some platforms show mixed short-term sentiment, the dominant analyst consensus is a "Buy" or "Moderate Buy," supported by strong price targets and growth forecasts.
The stock’s current undervaluation relative to its growth potential creates a favorable risk-reward profile for investors.

BTC Buy Setup | Sniper Trading System - Reverse Play🚨 BTC Buy Setup | Sniper Trading System™️ Reverse Play Activated
What you’re looking at isn’t luck — it’s Sniper-level execution.
This BTC reversal trade was triggered by my Sniper Trading System™️, which identifies institutional-level liquidity traps, dealer ranges, and timing zones with precision.
🧠 Setup Highlights:
— Liquidity sweep below key support
— RSI confirming reversal from the Fade Zone
— Dealer Range low respected
— Reversal candle + structure shift = high-probability sniper entry
📍 Chart:
This is powered by my Jesus Saves™️ + Fade Reversal Combo, built into the Sniper Trading System Suite™️.

BRIEFING Week #24 : is Stagflation Coming next ?Here's your weekly update ! Brought to you each weekend with years of track-record history..
Don't forget to hit the like/follow button if you feel like this post deserves it ;)
That's the best way to support me and help pushing this content to other users.
Kindly,
Phil


TSLA SellOff ! Elon Musk vs Donald Trump ! Beginning of the End?If you haven`t bought the dip on TSLA:
Now you need to know that TSLA Tesla experienced a significant drop of 14% today, marking its worst single-day performance in over four years. This decline erased approximately $150 billion in market capitalization, bringing the stock down to $284.70.
The immediate cause of this downturn is the escalating feud between CEO Elon Musk and President Donald Trump. Musk's public criticism of Trump's tax legislation, labeling it a "repugnant abomination," prompted Trump to threaten the revocation of government contracts with Musk's companies. This political clash has introduced significant uncertainty regarding Tesla's future government support.
Beyond the political arena, Tesla's core business metrics are showing signs of strain. The company reported a 9% decline in quarterly revenues and a staggering 71% drop in profits. Additionally, Tesla has lost its leadership position in the electric vehicle market to China's BYD, indicating increased competitive pressure.
cincodias.elpais.com
Investor sentiment is also waning. A Morgan Stanley survey revealed that 85% of investors believe Musk's political activities are negatively impacting Tesla's business fundamentals. This perception is further exacerbated by declining sales in key markets, such as a 17% drop in Model Y registrations in California.
thestreet.com
Elon Musk and Donald Trump have publicly clashed, escalating a feud that has unraveled their once-close relationship. The dispute centers on several issues:
Republican Tax and Immigration Bill: Musk criticized a sweeping Republican domestic policy bill backed by Trump, calling it a "disgusting abomination" on X. Trump claimed Musk initially had no issue with the bill, accusing him of being upset over the removal of an electric vehicle tax credit.
Epstein Files Allegation: Musk alleged Trump's name appears in classified Jeffrey Epstein files, escalating tensions. Trump has not directly addressed this claim but responded by threatening to cut government contracts with Musk's companies.
Personal and Financial Accusations: Musk argued Trump would have lost the 2024 election without his financial support, accusing him of ingratitude. Trump countered, saying he was "disappointed" in Musk, claiming he asked Musk to leave the administration and accused him of "Trump Derangement Syndrome."
Government Contracts and Tariffs: Trump threatened to cancel "billions and billions" in government contracts with Musk's companies, like SpaceX, amid the feud. Separately, Musk reportedly made personal appeals to Trump on auto tariffs, which Trump noted might involve a conflict of interest.
Cabinet Clash: Reports indicate Musk clashed with Trump’s cabinet, including Marco Rubio, over spending cuts related to the Department of Government Efficiency (DOGE), with some describing Musk's behavior as disruptive.
Given these challenges, a price target of $215 for TSLA appears justified. The combination of political entanglements, deteriorating financial performance, and eroding investor confidence suggests that Tesla's stock may face continued downward pressure in the near term.
Disclosure: I am part of Trade Nation's Influencer program and receive a monthly fee for using their TradingView charts in my analysis.

FCEL FuelCell Energy Options Ahead of EarningsAnalyzing the options chain and the chart patterns of FCEL FuelCell Energy prior to the earnings report this week,
I would consider purchasing the 5usd strike price Calls with
an expiration date of 2025-7-3,
for a premium of approximately $1.10.
If these options prove to be profitable prior to the earnings release, I would sell at least half of them.

PL Planet Labs PBC Options Ahead of EarningsAnalyzing the options chain and the chart patterns of PL Planet Labs PBC prior to the earnings report this week,
I would consider purchasing the 4usd strike price Calls with
an expiration date of 2025-6-20,
for a premium of approximately $0.37.
If these options prove to be profitable prior to the earnings release, I would sell at least half of them.

RBRK Rubrik Options Ahead of EarningsAnalyzing the options chain and the chart patterns of RBRK Rubrik prior to the earnings report this week,
I would consider purchasing the 90usd strike price Calls with
an expiration date of 2025-6-20,
for a premium of approximately $5.60.
If these options prove to be profitable prior to the earnings release, I would sell at least half of them.

This Trendline Refuses To Be OverlookedTrading Fam,
While it is somewhat unclear what Bitcoin's next move will be (though I tend to lean towards more upside bias), one thing has become clear ...that aqua blue trendline I have drawn on our chart is proving its significance. Currently, it holds as support. A break to the downside though, and I expect us to drop all the way to 96k. If it continues to hold, a break above our recent high should be expected and new highs will be formed in a relatively quick timeframe.
Stew

Volume Speaks Louder: My Custom Volume Indicator for Futures
My Indicator Philosophy: Think Complex, Model Simple
In my first “Modeling 101” class as an undergrad, I learned a mantra that’s stuck with me ever since: “Think complex, but model simple.” In other words, you can imagine all the complexities of a system, but your actual model doesn’t have to be a giant non-convex, nonlinear neural network or LLM—sometimes a straightforward, rule-based approach is all you need.
With that principle in mind, and given my passion for trading, I set out to invent an indicator that was both unique and useful. I knew countless indicators already existed, each reflecting its creator’s priorities—but none captured my goal: seeing what traders themselves are thinking in real time . After all, news is one driver of the market, but you can’t control or predict news. What you can observe is how traders react—especially intraday—so I wanted a simple way to gauge that reaction.
Why intraday volume ? Most retail traders (myself included) focus on shorter timeframes. When they decide to jump into a trade, they’re thinking within the boundaries of a single trading day. They rarely carry yesterday’s logic into today—everything “resets” overnight. If I wanted to see what intraday traders were thinking, I needed something that also resets daily. Price alone didn’t do it, because price continuously moves and never truly “starts over” each morning. Volume, however, does reset at the close. And volume behaves like buying/selling pressure—except that raw volume numbers are always positive, so they don’t tell you who is winning: buyers or sellers?
To turn volume into a “signed” metric, I simply use the candle’s color as a sign function. In Pine Script, that looks like:
isGreenBar = close >= open
isRedBar = close < open
if (not na(priceAtStartHour))
summedVolume += isGreenBar ? volume : -volume
This way, green candles add volume and red candles subtract volume, giving me positive values when buying pressure dominates and negative values when selling pressure dominates. By summing those signed volumes throughout the day, I get a single metric—let’s call it SummedVolume—that truly reflects intraday sentiment.
Because I focus on futures markets (which have a session close at 18:00 ET), SummedVolume needs to reset exactly at session close. In Pine, that reset is as simple as:
if (isStartOfSession())
priceAtStartHour := close
summedVolume := 0.0
Once that bar (6 PM ET) appears, everything zeroes out and a fresh count begins.
SummedVolume isn’t just descriptive—it generates actionable signals. When SummedVolume rises above a user-defined Long Threshold, that suggests intraday buying pressure is strong enough to consider a long entry. Conversely, when SummedVolume falls below a Short Threshold, that points to below-the-surface selling pressure, flagging a potential short. You can fine-tune those thresholds however you like, but the core idea remains:
• Positive SummedVolume ⇒ net buying pressure (bullish)
• Negative SummedVolume ⇒ net selling pressure (bearish)
Why do I think it works: Retail/intraday traders think in discrete days. They reset their mindset at the close. Volume naturally resets at session close, so by signing volume with candle color, I capture whether intraday participants are predominantly buying or selling—right now.
Once again: “Think complex, model simple.” My Daily Volume Delta (DVD) indicator may look deceptively simple, but five years of backtesting have proven its edge. It’s a standalone gauge of intraday sentiment, and it can easily be combined with other signals—moving averages, volatility bands, whatever you like—to amplify your strategy. So if you want a fresh lens on intraday momentum, give SummedVolume a try.

AVGO Broadcom Options Ahead of EarningsIf you haven`t bought AVGO before the rally:
Now analyzing the options chain and the chart patterns of AVGO Broadcom prior to the earnings report this week,
I would consider purchasing the 250usd strike price Calls with
an expiration date of 2025-6-13,
for a premium of approximately $14.75.
If these options prove to be profitable prior to the earnings release, I would sell at least half of them.
Disclosure: I am part of Trade Nation's Influencer program and receive a monthly fee for using their TradingView charts in my analysis.

BRIEFING Week #22 : Still waiting for OilHere's your weekly update ! Brought to you each weekend with years of track-record history..
Don't forget to hit the like/follow button if you feel like this post deserves it ;)
That's the best way to support me and help pushing this content to other users.
Kindly,
Phil

MOONPIG Is Taking Off — Thanks to James Wynn’s Viral CloutThe James Wynn Phenomenon:
James Wynn, a crypto trader who turned $4 million into $100 million before losing nearly all of it in leveraged Bitcoin futures, has become a polarizing figure in the crypto space. His massive trades, including a $1.2 billion Bitcoin long position that ended in a $17.5 million loss and a subsequent $1 billion short position with 40x leverage, have made him a viral sensation. Despite these setbacks, Wynn’s resilience and bold moves keep him in the spotlight, with thousands of traders and investors following his every step.
Wynn’s fame stems not just from his trading but from his ability to move markets. His posts on X, where he boasts a significant following, often trigger rapid price movements in the assets he mentions. This influence is now centered on $MOONPIG, a Solana-based meme coin that’s gaining traction thanks to his vocal support.
$MOONPIG: A Meme Coin with Momentum:
$MOONPIG, a meme coin built on the Solana blockchain, has seen its price surge by as much as 80% following Wynn’s endorsements, though it’s also faced volatility with a 30% drop in 24 hours and a 60% decline from its all-time high. Despite these fluctuations, the coin’s community-driven narrative and Wynn’s backing make it a compelling speculative play.
Wynn’s posts on X reveal his belief in $MOONPIG’s potential to be the “next SafeMoon” of this cycle, predicting a run to a billion-dollar market cap. He’s emphasized its appeal to retail investors, calling it “normie-friendly” and highlighting its strong community as a key driver. This narrative aligns with the meme coin mania that often propels tokens like CRYPTOCAP:DOGE or CRYPTOCAP:SHIB to explosive gains during bullish market phases.
Why I’m Bullish:
Wynn’s Influence as a Catalyst: Wynn’s fame amplifies $MOONPIG’s visibility. His posts on X, such as one claiming he transferred profits to the $MOONPIG reserves wallet, signal commitment and attract attention. When Wynn speaks, traders listen, and his endorsements have already driven significant price action, with one instance sparking an 80% surge.
Community Strength: Wynn has emphasized $MOONPIG’s community-driven ethos, stating it “doesn’t need KOLs or BS” and thrives on organic support. In the meme coin space, strong communities can sustain momentum, as seen with tokens like CRYPTOCAP:PEPE , which Wynn also supports.
Market Timing: With Bitcoin hitting new highs and retail interest flooding back into crypto, $MOONPIG is well-positioned to ride the wave. Wynn’s thesis that retail investors will soon pour into altcoins aligns with current market sentiment, making $MOONPIG a potential beneficiary.
Speculative Upside: Meme coins thrive on hype, and $MOONPIG’s low market cap relative to its potential—analysts like @KookCapitalLLC
speculate a $1 billion valuation—offers significant upside for early investors. Even after recent pullbacks, the coin’s volatility suggests opportunities for traders who can stomach the risk.
MLong

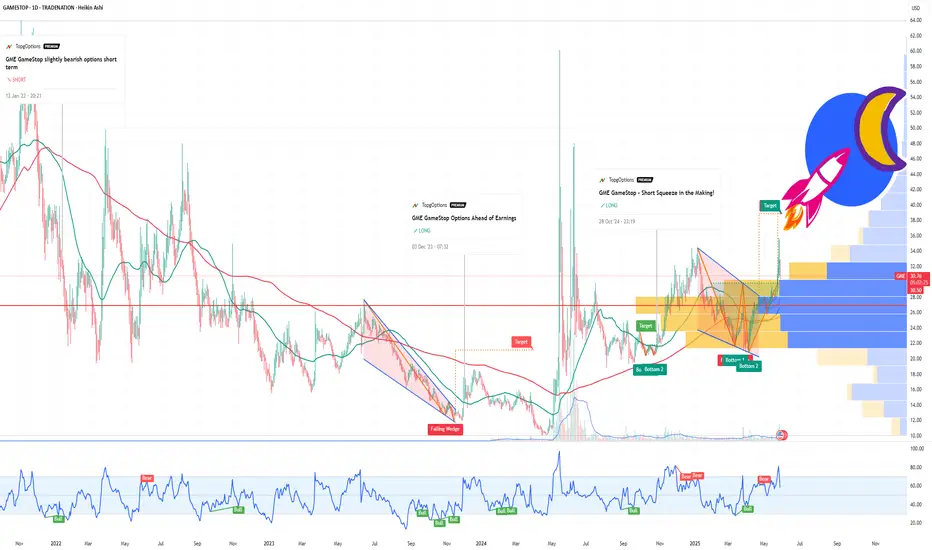
GameStop (GME) Is the New MSTR — And It Might Moon Harder ! If you haven`t bought the dip on GME:
Now You need to know that GameStop (GME) is the new MSTR MicroStrategy — But With Meme Power!
GME GameStop just made its boldest move yet: the company revealed it has purchased 4,710 Bitcoin, officially entering the crypto game in a serious way. While it hasn’t disclosed the total price paid, the intent is loud and clear — GameStop is transforming into a Bitcoin-holding company, just like MicroStrategy (MSTR) did back in 2020.
This isn’t just about hype. In March, GameStop raised $1.3 billion through a convertible note offering, specifically to help fund Bitcoin purchases. It also updated its investment policy to formally add Bitcoin as a reserve asset — the same exact strategy that led to MicroStrategy’s 10x stock explosion.
But here’s the twist: GameStop brings more than just Bitcoin exposure — it brings meme momentum. Unlike MicroStrategy, which had to win over the market, GME already has an army of loyal retail traders, massive online visibility, and a cultural legacy as the original meme stock. If MicroStrategy was the corporate face of Bitcoin adoption, GameStop is the internet’s version — louder, faster, and potentially more explosive.
Yes, the stock dipped on the announcement — typical for big moves like this — but long-term, the upside is undeniable. Bitcoin on the balance sheet gives GME new life, and volatility is GameStop’s comfort zone. With Bitcoin becoming a political and financial flashpoint — highlighted by major figures like JD Vance and Donald Trump Jr. attending the 2025 Bitcoin conference — GME’s move couldn’t be more timely.
This is more than a pivot. It’s a power play. GameStop is no longer just a nostalgia-fueled retailer — it’s a digital asset powerhouse in the making.
If you missed MicroStrategy’s rise, GameStop might just be your second chance — with even more firepower behind it.
Disclosure: I am part of Trade Nation's Influencer program and receive a monthly fee for using their TradingView charts in my analysis.
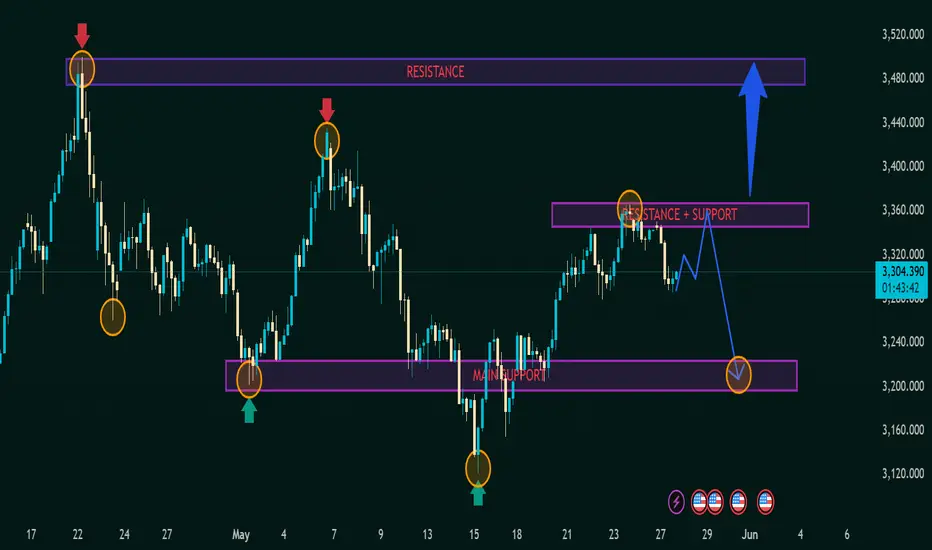
Technical Analysis: XAU/USD (Gold) Price Action📊 Technical Analysis: XAU/USD (Gold) Price Action
🕒 Timeframe: 4H (Based on candlestick structure)
📅 Published: May 27, 2025
💰 Current Price: 3,303.860
🔴 Major Resistance Zone
📍 3,480 – 3,500
📌 Seen with red arrows and price rejections.
📉 Strong selling pressure has occurred twice from this level (double top-like behavior).
❗ Until price breaks above this, bulls face a major hurdle.
🟣 Key Mid-Level Zone (S/R Flip)
📍 3,340 – 3,360
🔄 This area has flipped between support and resistance.
🔸 Price tested this level recently and pulled back (orange circle), suggesting sellers are active.
🔮 This is the pivot zone – watch for break/rejection to determine next trend leg.
🟪 Main Support Zone
📍 3,180 – 3,220
✅ Multiple bounce reactions visible (green arrows and circles).
💪 This zone has held strong; indicates solid buyer interest.
📉 If price returns here and breaks below, we could see further downside to 3,120 or lower.
🧭 Market Structure Summary
🔁 The market is in a range-bound structure between 3,220 – 3,360, with spikes towards 3,480.
🔃 The recent higher low followed by rejection at mid-resistance suggests potential distribution.
🧠 Forecast Scenarios
🔵 Bullish Scenario (Blue Path)
Break above 3,360 → Retest as support → 📈 Potential rally to 3,480
📍 Target: 3,480+
🟢 Confirmation: Strong bullish engulfing candle + volume surge
🔻 Bearish Scenario (Blue-Arrow + Orange Circle)
Rejection at current resistance → Drop toward 3,220
📍 Target: Main Support zone
❗ Watch for bearish candle pattern confirmation at 3,340
⚖️ Trading Strategy Tips
🔍 Wait for confirmation at the mid-resistance before entering.
🛡️ Place stops below support zones for long positions.
💥 Aggressive short sellers may look to enter near 3,340 with tight stops above.
🧩 Conclusion
The asset is in a critical decision zone. Whether it breaks higher toward the resistance or retraces to support will shape the next directional move. Traders should remain cautious, and let price action confirm bias before committing.
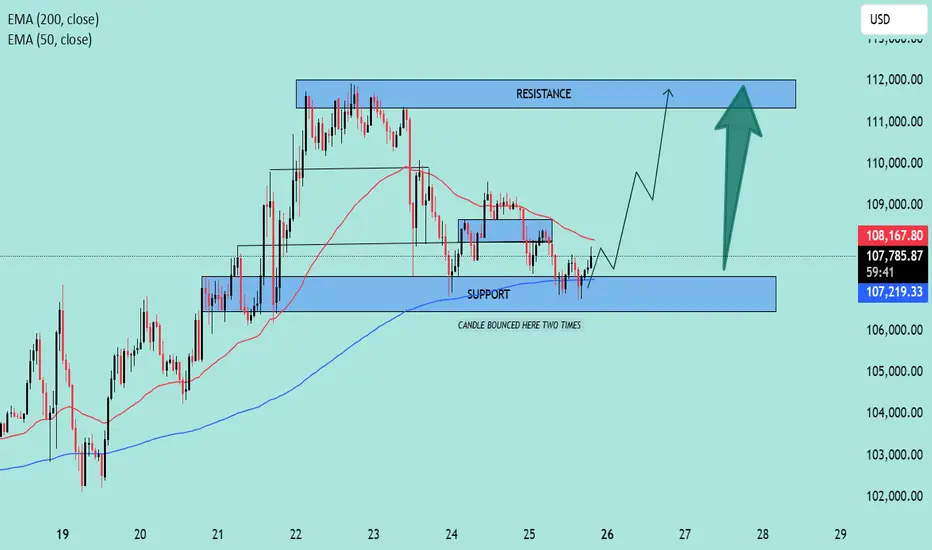
BTC/USD Rebound in Play! | Key Support Holding, Eyes on $112K📊 BTC/USD Technical Analysis
🗓️ Chart Date: May 25, 2025
🔍 Key Levels:
🔵 Support Zone: $106,800 – $107,300
Notably, price bounced twice in this region, indicating strong buying interest.
This area aligns closely with the 200 EMA (currently at $107,213.51), adding further confluence as dynamic support.
🔴 Resistance Zone: $111,800 – $112,300
Previous highs and consolidation make this a significant area where sellers may re-enter the market.
📈 Indicators:
🔵 EMA 200 (Blue): $107,213.51
Acts as a strong dynamic support; price bounced off it recently.
🔴 EMA 50 (Red): $108,182.91
Price is currently below the 50 EMA, suggesting short-term bearish pressure remains until this level is reclaimed.
🧠 Market Structure & Price Action:
After a sharp drop from the resistance zone, price found solid footing at the support zone.
Recent candles show rejection wicks from the downside, hinting at potential bullish reversal.
A breakout above minor consolidation and 50 EMA could trigger a bullish continuation toward the resistance.
📌 Forecast:
✅ If the price holds above the support zone and breaks above $108,200, we can expect a bullish move toward $112,000.
⚠️ However, a failure to break above the 50 EMA could lead to a retest of the support zone.
🧭 Trade Idea (Not Financial Advice):
📥 Long Bias:
Entry: On confirmed breakout above $108,200
SL: Below $107,000
TP: $111,800 – $112,300
📌 Conclusion:
The chart setup suggests a potential bullish reversal 📈 from a key support zone, supported by EMA 200. Watch for a break above the 50 EMA for momentum confirmation.
🧠 Always confirm with volume and wait for confirmation before entering a position.
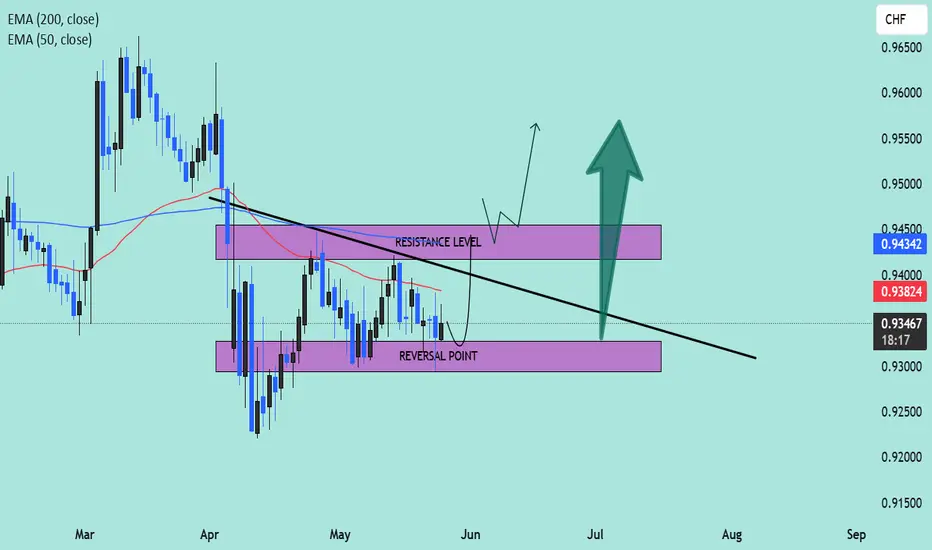
EUR/CHF Technical Outlook – Potential Bullish Reversal Setup📈 Pair: EUR/CHF
📆 Date: May 27, 2025
📊 Timeframe: Daily (D1)
📌 Technical Highlights:
🔹 Current Price: 0.93456
🔹 Key Indicators:
50 EMA (Red): 0.93824
200 EMA (Blue): 0.94342
🧠 Chart Analysis:
🔻 Downtrend Resistance Line: A clear descending trendline is pressing price lower, reinforcing a bearish structure since March.
🟣 Reversal Zone (Support Area):
Price is currently hovering just above the marked Reversal Point, a demand zone between 0.93000–0.93400. Historically, this zone has acted as a launch pad for upward momentum.
🟪 Resistance Level:
Located around 0.94300–0.94600, this zone is reinforced by the 200 EMA, making it a critical breakout area. A strong bullish close above this region could invalidate the downtrend.
🔄 Two Scenarios to Watch:
✅ Bullish Breakout Scenario:
Price may bounce from the reversal zone.
A break and retest above the resistance level could lead to bullish continuation toward 0.9500–0.9550.
Confirmation above the 200 EMA will add confidence to the breakout.
📈 Potential Buy Entry: On breakout and retest of 0.9450
🎯 Target: 0.9550
🛡️ Stop Loss: Below 0.9320
❌ Bearish Continuation Scenario:
If price fails to hold above the reversal point, sellers may regain control.
A breakdown below 0.9300 could trigger further downside toward 0.9200 or lower.
📉 Sell Setup Invalid Until: Price closes below 0.9300 on strong volume.
🧭 Conclusion:
This chart suggests a critical decision point for EUR/CHF. A bounce from the reversal zone followed by a confirmed break above resistance could signal the start of a medium-term uptrend. Traders should monitor price action closely for confirmation signals near the trendline and EMA zones.
🚦 Bias: Neutral to Bullish, awaiting confirmation
🧠 Tip: Watch for candlestick patterns (like bullish engulfing or pin bars) near the support zone for early entries.
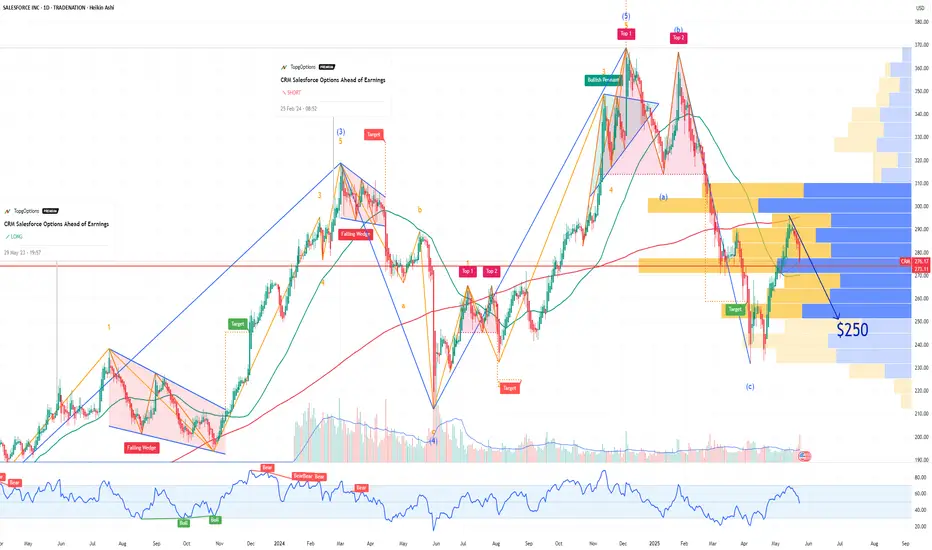
CRM Salesforce Options Ahead of EarningsIf you haven`t bought CRM before this rally:
nor sold this top:
Now analyzing the options chain and the chart patterns of CRM Salesforce prior to the earnings report this week,
I would consider purchasing the 250usd strike price Puts with
an expiration date of 2025-6-20,
for a premium of approximately $5.15.
If these options prove to be profitable prior to the earnings release, I would sell at least half of them.
Disclosure: I am part of Trade Nation's Influencer program and receive a monthly fee for using their TradingView charts in my analysis.
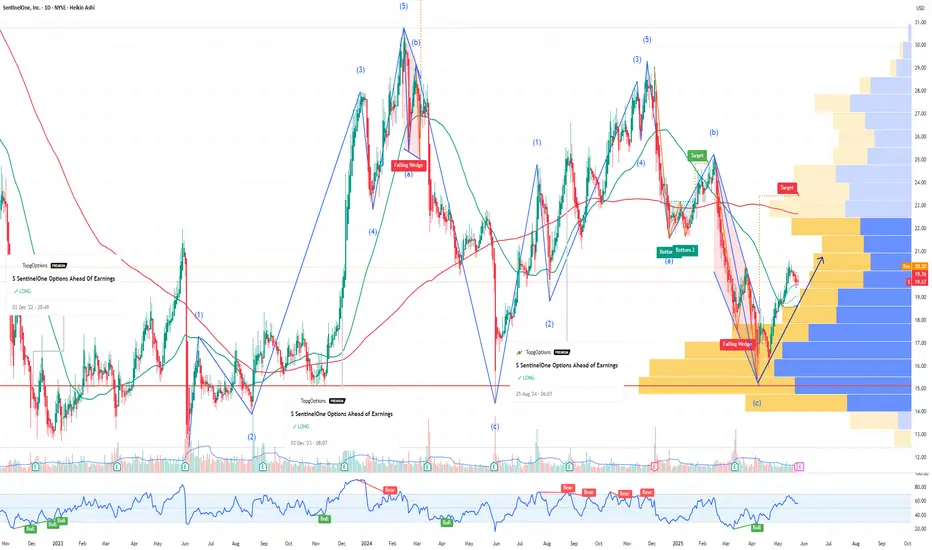
S SentinelOne Options Ahead of EarningsIf you haven`t bought S before the recent rally:
Now analyzing the options chain and the chart patterns of S SentinelOne prior to the earnings report this week,
I would consider purchasing the 20usd strike price Calls with
an expiration date of 2025-9-19,
for a premium of approximately $2.50.
If these options prove to be profitable prior to the earnings release, I would sell at least half of them.
ELF Beauty Options Ahead of EarningsAnalyzing the options chain and the chart patterns of ELF Beauty prior to the earnings report this week,
I would consider purchasing the 85usd strike price Calls with
an expiration date of 2025-5-30,
for a premium of approximately $5.85.
If these options prove to be profitable prior to the earnings release, I would sell at least half of them.
