S LongSentinelOne (S) shows a bullish setup on the 4-hour chart. The stock has recently broken above a downtrend line and is now testing previous resistance around $22. The price action displays higher lows and higher highs, indicating a potential trend reversal. A green uptrend line supports the recent p
Next report date
—
Report period
—
EPS estimate
—
Revenue estimate
—
−1.01USD
−338.69 MUSD
621.15 MUSD
262.98 M
About SentinelOne, Inc.
Sector
Industry
CEO
Tomer Weingarten
Website
Headquarters
Mountain View
Employees (FY)
2.3 K
Founded
2013
FIGI
BBG00B6F2F09
SentinelOne, Inc. engages in the provision of endpoint security software that detects, models, and predicts threat behavior to block attacks on any computing device. Its services include vigilance, support, and training. The company was founded by Tomer Weingarten and Almog Cohen in 2013 and is headquartered in Mountain View, CA.

Make it or break it moment for $SWith the spectacular fall of NASDAQ:CRWD last week I expect to be a decisive week for SentinelOne.
Scenario nr 1
Break out of the correction or for Bill O'Neill followers break out of the base.
Supporting evidence:
1. Fundamental. Better than expected earnings
The biggest competitor is ha

SentinelOne Gains as CrowdStrike Faces Software Update IssuesSentinelOne, Inc. experienced a boost in stock value following a problematic software update by its competitor, CrowdStrike Holdings Inc., which disrupted Microsoft Windows operating systems. The failed patch affected approximately 1% of Windows devices, translating to around 8.5 million units globa

SBought S after it fell on double beat earnings release. Completed a deep zigzag after a clear impulse. Part of my long-term portfolio.

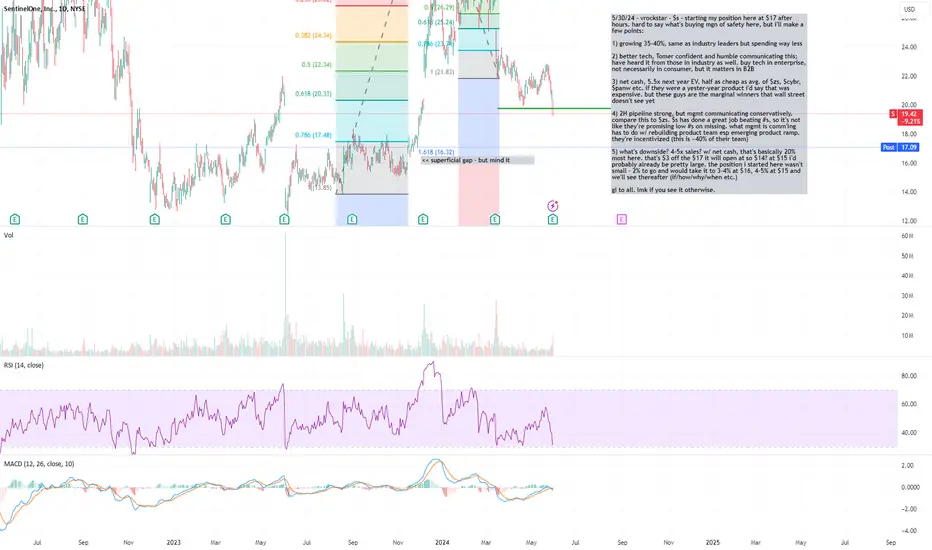
5/30/24 - $s - bot $17 AH. like the entry here. great biz.5/30/24 - vrockstar - NYSE:S - starting my position here at $17 after hours. hard to say what's buying mgn of safety here, but i'll make a few points:
1) growing 35-40%, same as industry leaders but spending way less
2) better tech, Tomer confident and humble communicating this; have heard it fr
Bullish shark Idea - Sentinel OneBullish shark pattern popping up on Sentinel One. Could be the bottom.

$S Potential H2 2024 Breakout After Extended Basing Period$S:1D
HH VWAP (highest high): yellow: 22.87
LL VWAP (lowest low): pink: 19.74
Major Fibs: left side
Minor Fibs: right side
After an extended, multi-year basing period NYSE:S appears ready to breakout to the upside over the remainder of 2024. That being said, the road to a breakout could be a b

SentinelOne's Stock Down 14% on Earnings MissSentinelOne's stock (NYSE: NYSE:S ) fell 14% following its mixed first-quarter financial results, which reported quarterly losses of 23 cents per share, significantly missing the analyst consensus estimate of losses of 5 cents by 360%. However, the company posted quarterly sales of $186.4 million,

Cyber Security NarrativeAs we all know increased chances for cyber warfare and attacks are likely, with advancements in the modern technological age, companies and sovereign states will look to fortify their databases and this chart looks absolutely prime.

Double Bottom on SentinelOne (S)In my analysis, SentinelOne (S) presents a compelling buying opportunity at the moment. The RSI divergence, coupled with the price aligning with the trendline (200 EMA) and support level, indicates a favorable setup.
Additionally, the formation of a double bottom suggests that buyers have regained

See all ideas
An aggregate view of professional's ratings.
Trade directly on the supercharts through our supported, fully-verified and user-reviewed brokers.


Curated watchlists where S is featured.

Frequently Asked Questions
The current price of S is 23.04 USD — it has decreased by 0.30% in the past 24 hours. Watch SentinelOne, Inc. stock price performance more closely on the chart.
Depending on the exchange, the stock ticker may vary. For instance, on NYSE exchange SentinelOne, Inc. stocks are traded under the ticker S.
S stock has risen by 2.63% compared to the previous week, the month change is a 22.81% rise, over the last year SentinelOne, Inc. has showed a 46.66% increase.
We've gathered analysts' opinions on SentinelOne, Inc. future price: according to them, S price has a max estimate of 37.00 USD and a min estimate of 18.00 USD. Watch S chart and read a more detailed SentinelOne, Inc. stock forecast: see what analysts think of SentinelOne, Inc. and suggest that you do with its stocks.
S stock is 5.67% volatile and has beta coefficient of 1.77. Track SentinelOne, Inc. stock price on the chart and check out the list of the most volatile stocks — is SentinelOne, Inc. there?
Today SentinelOne, Inc. has the market capitalization of 7.23 B, it has increased by 15.78% over the last week.
Yes, you can track SentinelOne, Inc. financials in yearly and quarterly reports right on TradingView.
SentinelOne, Inc. is going to release the next earnings report on Aug 30, 2024. Keep track of upcoming events with our Earnings Calendar.
S earnings for the last quarter are −0.01 USD per share, whereas the estimation was −0.05 USD resulting in a 79.81% surprise. The estimated earnings for the next quarter are 0.00 USD per share. See more details about SentinelOne, Inc. earnings.
SentinelOne, Inc. revenue for the last quarter amounts to 186.35 M USD, despite the estimated figure of 181.11 M USD. In the next quarter, revenue is expected to reach 197.26 M USD.
S net income for the last quarter is −70.11 M USD, while the quarter before that showed −71.98 M USD of net income which accounts for 2.61% change. Track more SentinelOne, Inc. financial stats to get the full picture.
No, S doesn't pay any dividends to its shareholders. But don't worry, we've prepared a list of high-dividend stocks for you.
As of Jul 27, 2024, the company has 2.30 K employees. See our rating of the largest employees — is SentinelOne, Inc. on this list?
EBITDA measures a company's operating performance, its growth signifies an improvement in the efficiency of a company. SentinelOne, Inc. EBITDA is −291.16 M USD, and current EBITDA margin is −53.58%. See more stats in SentinelOne, Inc. financial statements.
Like other stocks, S shares are traded on stock exchanges, e.g. Nasdaq, Nyse, Euronext, and the easiest way to buy them is through an online stock broker. To do this, you need to open an account and follow a broker's procedures, then start trading. You can trade SentinelOne, Inc. stock right from TradingView charts — choose your broker and connect to your account.
Investing in stocks requires a comprehensive research: you should carefully study all the available data, e.g. company's financials, related news, and its technical analysis. So SentinelOne, Inc. technincal analysis shows the buy rating today, and its 1 week rating is buy. Since market conditions are prone to changes, it's worth looking a bit further into the future — according to the 1 month rating SentinelOne, Inc. stock shows the buy signal. See more of SentinelOne, Inc. technicals for a more comprehensive analysis.
If you're still not sure, try looking for inspiration in our curated watchlists.
If you're still not sure, try looking for inspiration in our curated watchlists.