BRIEFING Week #49 : Watch Oil & USDJPYHere's your weekly update ! Brought to you each weekend with years of track-record history..
Don't forget to hit the like/follow button if you feel like this post deserves it ;)
That's the best way to support me and help pushing this content to other users.
Kindly,
Phil
Indicators

EURUSD SMC ICT ANALYSISMarket mostly move from external range liquidity to internal range liquidity.
now in eurusd , market has already taken buy side trendline liquidity & form strong bearish reaction which mean we can expect selling move.
4hr bullish ob is unmitigate , which increase the chance of selling.
Currently smc market structure is bearish , which signal selling looks valid.

How to Build a Consistent Execution Checklist on TradingViewMost trading mistakes don’t come from bad strategy, they come from inconsistent execution.
An execution checklist removes guesswork and replaces it with structure.
When your actions follow a routine, your results stabilize.
TradingView gives you everything you need to build a checklist that stays visible, actionable, and tied directly to your chart.
1. Define Your Core Conditions
Before any trade, the bigger picture must be clear.
Start your checklist by answering three questions:
What is the higher-timeframe direction
Where is price relative to key levels
Is price approaching with strength or weakness
Use TradingView’s drawing tools to mark support, resistance, value zones, and session highs and lows.
Add a simple text note on the chart listing your core conditions so they are always visible.
If the market context fails this first screen, the trade is already invalid.
2. Build Confirmation Criteria
Once structure is confirmed, you move to evidence.
Mark confirmation areas directly on your chart:
Liquidity pools
Fair value zones or imbalances
Previous session highs and lows
Asian range or New York open
If your strategy uses indicators, document exact conditions:
Moving average position and slope
Volume behavior
VWAP location
Volatility expansion or contraction
Define rules that don’t change based on emotion.
Confirmation should prove your bias, not justify your urge to trade.
3. Validate Risk Before Execution
Every setup must survive a risk checkpoint before it’s allowed to go live.
Your checklist must answer:
Where is my invalidation level
How much capital am I risking
Does this violate any daily limits
Is the reward worth the risk
Use TradingView’s long or short position tool to visualize risk directly on the chart.
Save it as a template so your risk process stays uniform across all trades.
No trade is valid if risk isn’t clean.
4. Create a Pre-Execution Routine
A checklist only works if you actually follow it.
Add a short pre-trade process directly to your chart notes using checkboxes or bullet points:
Example execution checklist:
Market phase confirmed
Level identified
Confirmation present
Risk valid
Entry condition active
Walk through this list before clicking buy or sell.
If one item fails, the trade fails.
Over time, this routine removes emotional impulse completely.
5. Review and Refine Weekly
Your checklist isn’t static, it evolves.
Every week ask:
Where did I break my rules
What conditions led to losses
Which confirmations work best
What rules saved me from bad trades
Use TradingView’s trade replay and journaling features to review execution quality, not just profit.
Consistency improves when your system evolves with you.
Final Thought
A checklist doesn’t restrict your trading, it frees you from emotion.
When your process is clear, your confidence increases.
When your confidence increases, discipline follows.
Good traders make decisions.
Great traders execute procedures.
Stay Green!
SPX WEEK 48 — Strong Bounce Into Year-End! 2026 BULL RUN COMING?Strong week for the SP:SPX index. After two weeks of hesitation candles, price finally shifted back into strength and pushed decisively higher. This week’s candle not only reclaimed momentum but fully erased last week’s cooling-off behavior.
Price also moved well above the key mid-range levels that traders usually watch to define trend health. It’s now sitting firmly above the major risk zone and continues building distance away from it — a clear sign of strength. From the moment this week’s upside break triggered, the index has gained roughly 1.9%, and that kind of move typically translates into solid returns for options traders playing directional setups.
Major support zones sit lower around 5900, 5100, and the deeper structural support near 4000. As long as price holds above the upper layers of support, momentum remains intact.
On the higher-timeframe monthly chart, the trend has been active for eight straight months with no signs of exhaustion. Price is still far above the level where the monthly trend began, and even further above the long-term midline — showing how dominant the larger trend still is.
The 2-day chart continues to support the overall bullish structure, breaking above short-term levels and maintaining strength after multiple confirmations earlier in the week.
This week was a clean continuation of the broader uptrend — strong candle, strong momentum, and strong positioning above every major structural region.
Elite clarity. Elite precision. More coming soon.

BRIEFING Week #48 : Monthly Hanging ManHere's your weekly update ! Brought to you each weekend with years of track-record history..
Don't forget to hit the like/follow button if you feel like this post deserves it ;)
That's the best way to support me and help pushing this content to other users.
Kindly,
Phil

BBAI BigBear ai Holdings Options Ahead of EarningsIf you haven`t bought BBAI before the massive rally:
Now analyzing the options chain and the chart patterns of BBAI BigBear ai Holdings prior to the earnings report this week,
I would consider purchasing the 3usd strike price Calls with
an expiration date of 2025-12-19,
for a premium of approximately $1.35.
If these options prove to be profitable prior to the earnings release, I would sell at least half of them.

U Unity Potential Buyout Soon?!If you missed my previous signal on U (Unity):
Now Unity Technologies (NYSE: U) just caught fire — surging 12.5% in a single day — on a massive uptick in volume that should have every sharp trader watching closely. With $39.1M in volume against a daily average of 9.4M shares, something is clearly brewing beneath the surface.
But this isn’t just about technicals — the options market is lighting up with unusual activity, and there’s fundamental buyout potential that’s getting harder to ignore.
🔍 Options Traders Are Making Bold Bets
Yesterday: Traders loaded up on January 16 $37 strike calls — deep out-of-the-money, high-risk, high-reward plays.
Today: A massive $3.5 million bet was placed on the $30 strike calls, also expiring January 16.
These aren’t casual bets. This is smart money positioning for a potential takeover or major catalyst, and the timeline is clear: January 2025.
📈 Why a Buyout Could Be Back on the Table
Let’s rewind. On August 9, 2022, AppLovin (APP) made an unsolicited offer to acquire Unity in an all-stock deal worth $17.5B, valuing Unity shares at $58.85 — an 18% premium at the time. Unity rejected the deal.
Fast forward to today:
AppLovin's market cap has exploded — now sitting at a jaw-dropping $127B, up 3,800% since late 2022.
Unity, meanwhile, is a shadow of its former self, trading far below its ATH of $201.12 (November 2021), with ongoing struggles in monetization and competition.
But this disparity creates a prime M&A setup:
AppLovin now has the firepower and strategic incentive to revisit the acquisition — with Unity’s depressed valuation, it’s arguably a bargain.
The AI + gaming narrative is red hot. Combining Unity’s engine with AppLovin’s ad and monetization capabilities could be the synergy Wall Street loves.
🎯 The Trade Setup
Unity just broke out with conviction on high volume — this could be the first leg of a larger move.
Options flow suggests bullish sentiment into early 2025.
A renewed takeover offer could easily push the stock back toward the $50–60 zone, if not higher.
🧠 Final Thoughts
Unity is no stranger to volatility, but when volume spikes, options explode, and a cash-rich suitor like AppLovin is thriving, traders should sit up and pay attention.
We may be watching the early stages of a buyout story 2.0 unfold — and Wall Street might be starting to price it in.
📌 Watch Unity (U) closely in the coming weeks. The market may be whispering — or shouting — "Takeover incoming."

MRK Merck On the Verge of a Breakout? Unusual Calls !!Merck (MRK) is setting up for what could be a high-probability breakout. The stock has been in a falling wedge pattern for several months — a classic technical formation that often precedes sharp upside moves. Price action has now compressed to the end of the wedge, and we may be on the brink of a bullish resolution.
🔍 Technical Setup
Falling Wedge Pattern nearing completion
Price currently hovering near long-term support ($78.25)
Strong bullish divergence forming on momentum indicators (RSI/MACD)
The falling wedge is typically a reversal pattern, and given how deep MRK has pulled back from its highs ($134+), the risk/reward here looks compelling.
🔥 Options Flow
Today’s options market added fuel to the fire:
48,000 call contracts traded expiring this Friday
This sudden surge in short-dated call buying signals aggressive positioning for an imminent move
This kind of volume is not retail-driven — it points to potential institutional interest
💡 The Bullish Case
With the technical breakout structure in place and strong confirmation from options flow, the case for a bullish reversal is growing. If MRK can close above wedge resistance with volume, it opens the door to a quick move toward $85+, possibly even higher in the coming weeks.
Disclosure: I am part of Trade Nation's Influencer program and receive a monthly fee for using their TradingView charts in my analysis.

Bullish Thesis for INTC Intel Stock in 2025If you haven`t bought INTC before the previous earnings:
Now Intel INTC is positioned for a potential turnaround and upside by the end of 2025, driven by strategic leadership changes, foundry business expansion, AI innovation, and favorable geopolitical dynamics. Here’s why INTC could head higher this year:
1. Leadership Transformation and Strategic Vision
The appointment of Lip-Bu Tan as CEO in March 2025 has injected new optimism into Intel’s prospects. Tan is a respected semiconductor industry veteran, and his arrival was met with a 10% jump in INTC’s share price, reflecting renewed investor confidence in the company’s direction.
2. Foundry Business Expansion and Government Support
Intel’s pivot toward a foundry-centric model is gaining momentum. The company is leveraging its U.S.-based manufacturing footprint to attract domestic and international clients, especially as geopolitical tensions and trade restrictions make U.S. chip production more attractive.
There is speculation about strategic partnerships, such as TSMC potentially acquiring a stake in Intel’s foundry operations, which could accelerate technology transfers and client wins.
The U.S. government is likely to continue supporting domestic semiconductor manufacturing through incentives and tariffs, directly benefiting Intel’s foundry ambitions.
3. AI and Next-Gen Product Launches
Intel is aggressively targeting the AI and data center markets. The upcoming Jaguar Shores and Panther Lake CPUs, built on the advanced 18A process node, are set for release in the second half of 2025. These chips will be available not only for Intel’s own products but also for external clients like Amazon and Microsoft, expanding the addressable market.
Intel’s renewed focus on AI accelerators and competitive cost structures could help it regain share in high-growth segments.
4. Financial Resilience and Market Position
Despite recent setbacks, Intel remains a dominant player in the PC CPU market and continues to generate substantial revenue, outpacing some key competitors in the latest quarter.
Analysts have revised their short-term price targets upward, with some projecting INTC could reach as high as $62—a potential upside of over 170% from current levels.
Forecasts for 2025 suggest an average price target in the $40–$45 range, with bullish scenarios pointing even higher if execution on foundry and AI strategies meets expectations.
5. Technical and Sentiment Factors
While technical analysis currently signals caution, the $18.50–$20 zone has provided strong support, and any positive news on foundry contracts or AI wins could catalyze a breakout from current consolidation patterns.
Market sentiment has shifted more positively following the CEO change and strategic announcements, suggesting the potential for a sustained rebound if Intel delivers on its promises.
In conclusion:
Intel’s combination of visionary leadership, foundry expansion, AI innovation, and favorable geopolitical trends sets the stage for a potential stock price recovery by the end of 2025. With analyst targets and investor sentiment turning more bullish, INTC presents a compelling case for upside as it executes its turnaround strategy
Disclosure: I am part of Trade Nation's Influencer program and receive a monthly fee for using their TradingView charts in my analysis.

AAPL Poised for Continued GrowthIf you haven`t bought AAPL before the rally:
What to consider now:
1. AI-Driven iPhone Upgrade CycleApple’s integration of Apple Intelligence, its proprietary AI platform, is set to catalyze a significant iPhone replacement cycle. Posts on X highlight positive sentiment around AI-driven demand, with estimates suggesting a 40% year-over-year surge in iPhone shipments in China during May 2024, signaling strong consumer interest. New AI features, such as on-device processing for enhanced privacy and functionality, are expected to drive accelerated hardware upgrades. Analysts, including Bernstein, project these features could boost upgrade rates, with even a 1% increase in upgrades driving meaningful revenue growth. With the iPhone 15 and future iterations leveraging AI, Apple is likely to capture pent-up demand, as noted by industry observers who see long-term revenue growth from its 7% year-over-year increase in active installed base.
2. Strong Ecosystem and Services GrowthApple’s ecosystem—spanning iPhones, iPads, Macs, and wearables—continues to drive customer loyalty and recurring revenue. The company reported record services growth in Q2 2025, with revenue reaching $95.4 billion, up 5% year-over-year. Services like Apple Music, iCloud, and Apple TV+ benefit from the growing active device base, which ensures sticky, high-margin revenue streams. This ecosystem strength mitigates concerns about short-term iPhone sales fluctuations, as Apple captures upgrade revenue over time. The seamless integration of hardware and services creates a moat that competitors struggle to replicate, reinforcing AAPL’s long-term growth potential.
3. Technical Bullish MomentumFrom a technical perspective, AAPL exhibits strong bullish patterns across multiple timeframes. TradingView analyses point to a rising bullish channel, with higher highs and higher lows signaling sustained upward momentum. Key bullish patterns, such as an ascending wedge and triangle, are forming around current price levels, suggesting potential breakouts. For instance, if AAPL clears $203.21 with volume, it could target $204.98 or higher, with some analyses eyeing $240 as a near-term resistance. Technical indicators like a rising RSI and MACD convergence further support short-term bullish momentum. Despite recent consolidation, reduced volatility and a strong setup pattern indicate AAPL is primed for a breakout.
4. Analyst Optimism and Market SentimentAnalyst sentiment remains overwhelmingly positive, with a consensus “Buy” rating and a 12-month price target of $228.85, implying a 14.05% upside from the current price of $200.66 as of June 2025. Hedge funds like Third Point see “significant” upside, driven by AI features that could meaningfully boost earnings. Bernstein’s raised price target to $240 reflects confidence in Apple’s ability to monetize AI through hardware and services. Posts on X also highlight investor optimism, with AAPL’s $350 billion market cap increase in a single day underscoring strong market confidence in its AI-driven growth chapter.
5. Global Expansion and Emerging MarketsApple’s growth in emerging markets, particularly India and China, bolsters its bullish case. Improved guidance for December 2023, driven by iPhone 15 adoption and India’s market potential, signals untapped opportunities. Apple’s ability to penetrate these high-growth regions, combined with its premium brand appeal, positions it to capture a larger share of global smartphone and tech markets.
Disclosure: I am part of Trade Nation's Influencer program and receive a monthly fee for using their TradingView charts in my analysis.

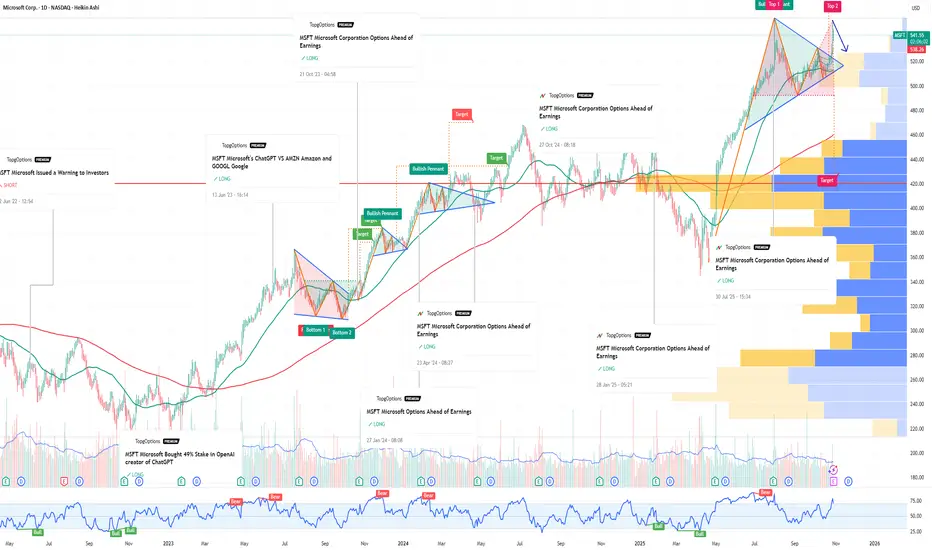
MSFT Microsoft Corporation Options Ahead of EarningsIf you haven`t bought MSFT before the rally:
Now analyzing the options chain and the chart patterns of MSFT Microsoft Corporation prior to the earnings report this week,
I would consider purchasing the 550usd strike price Puts with
an expiration date of 2025-12-19,
for a premium of approximately $26.70.
If these options prove to be profitable prior to the earnings release, I would sell at least half of them.
ONDS Ondas Holdings Options Ahead of EarningsAnalyzing the options chain and the chart patterns of ONDS Ondas Holdings prior to the earnings report this week,
I would consider purchasing the 10usd strike price Calls with
an expiration date of 2028-1-21,
for a premium of approximately $3.95.
If these options prove to be profitable prior to the earnings release, I would sell at least half of them.

NVDA to $170? AI Bubble Risk, Big Money Exits & Heavy Shorts !I f you haven`t bought NVDA before the previous earnings:
Now you need to know that NVIDIA has dominated 2023–2025, becoming the face of the global AI boom. But the higher the climb, the harder the fall. While NVDA is still seen as “untouchable,” several major signals suggest the stock could revisit levels near $170 — a healthy correction of 10–15% from here.
1. Major Investors Are Exiting — SoftBank Dumped Everything
SoftBank, one of Nvidia’s earliest and most influential institutional backers, sold its entire stake in late 2025, worth roughly $5.8 billion.
Smart-money exits near all-time highs should never be ignored.
SoftBank rarely sells unless it believes:
- the sector is overheated
- the valuation has run too far
- risk/reward becomes asymmetric
This mirrors their strategy in 2021–2022 when they unloaded overvalued tech before the correction.
SoftBank’s full exit is a red flag for anyone ignoring the possibility of an AI bubble.
2. Michael Burry Bought Massive Puts — A Direct Bet Against the AI Mania
Michael Burry — famous for predicting the 2008 crisis — has quietly increased his put positions on NVIDIA and other AI names.
Why does this matter?
Because Burry doesn’t short “normal” overvaluations.
He shorts bubbles.
His AI thesis:
- expectations are unrealistic
- revenue growth is priced as infinite
- companies are spending billions on AI with no short-term monetization
- chip demand could normalize faster than markets expect
When a contrarian with Burry’s track record bets against a trend, it’s worth paying attention.
3. NVIDIA’s Valuation Is Stretched Even for a Hyper-Growth Company
Even bulls agree: NVDA’s multiples are once again aggressively priced.
Key issues:
• Price-to-Sales historically elevated
NVDA is trading at a P/S ratio that would be insane for any company approaching a $5 trillion market cap.
• Revenue growth expectations assume perfect long-term AI adoption
If AI monetization slows or plateaus even slightly, NVDA’s valuation collapses fast.
4. Are We in an AI Bubble? Many Indicators Say Yes
Top analysts, academics, and even bullish investors admit:
AI has bubble-like behavior.
Evidence of a bubble:
- Stock prices rising faster than actual earnings growth
- Companies buying GPUs “because everyone else is doing it”
- Zero clarity on monetization for many AI firms
- AI startups valued at billions with no revenue
- Media hype similar to 1999 dot-com sentiment
Harvard Business Review, Wired, and Investopedia already discuss the “AI bubble thesis.”
If AI expectations don’t materialize fast enough, NVDA becomes the single most vulnerable stock on the market.

PLTR to $150: Overvaluation, AI Hype, Slowing Government Growth If you haven`t bought PLTR at $16:
Palantir has become one of the most crowded trades of the AI boom. While the company is strong fundamentally, the stock price has detached from reality. A move toward $150 (post-split) is not only reasonable — it is structurally likely.
1. Extreme Valuation — PLTR Trades Like a Hyper-Growth AI Leader, But Growth Is Slowing
Palantir’s current valuation assumes:
accelerating revenue growth
massive enterprise AI adoption
long-term dominance in the AI/defense space
But real numbers tell a different story:
government revenue growth has slowed
commercial AI revenue is not scaling as fast as expected
current valuation implies “perfection”
PLTR is priced like Nvidia, but grows closer to a legacy enterprise software company.
That gap must eventually close.
2. Government Contracts Are Growing Much Slower Than Expected
Historically, the Gov segment was Palantir’s growth engine. Now:
U.S. federal agencies face budget constraints
large DoD and DHS contracts are delayed or split among competitors
players like Anduril, C3.ai, and smaller defense tech shops are taking share
geopolitical spending doesn’t translate directly into PLTR revenue
Slowing government growth is a major red flag, because it removes the company’s most stable source of revenue.
3. AI Hype in the Commercial Segment Is Not Converting Into Real Revenue (Yet)
Most of the excitement around PLTR in 2024–2025 comes from:
AIP (Artificial Intelligence Platform)
enterprise copilots
generative AI tools
predictive modeling engines
But the commercial AI pipeline suffers from:
too many POCs (proof-of-concepts)
long implementation timelines (6–24 months)
high customer acquisition costs
conservative corporate spending
The hype is real.
The revenue, not so much.
4. Heavy Insider Selling — A Consistent Bearish Signal
Top insiders have repeatedly sold shares into every major rally:
Alex Karp (CEO)
Shyam Sankar (COO)
multiple VPs and directors
Notice what’s missing:
large insider buying.
Insiders consistently cash out when retail enthusiasm peaks, which historically precedes corrections.
Macro Risk: If AI Capex Slows, PLTR Gets Hit Harder Than NVDA
PLTR is far more sensitive to an AI spending slowdown than hardware leaders like Nvidia, which still enjoy massive chip demand.

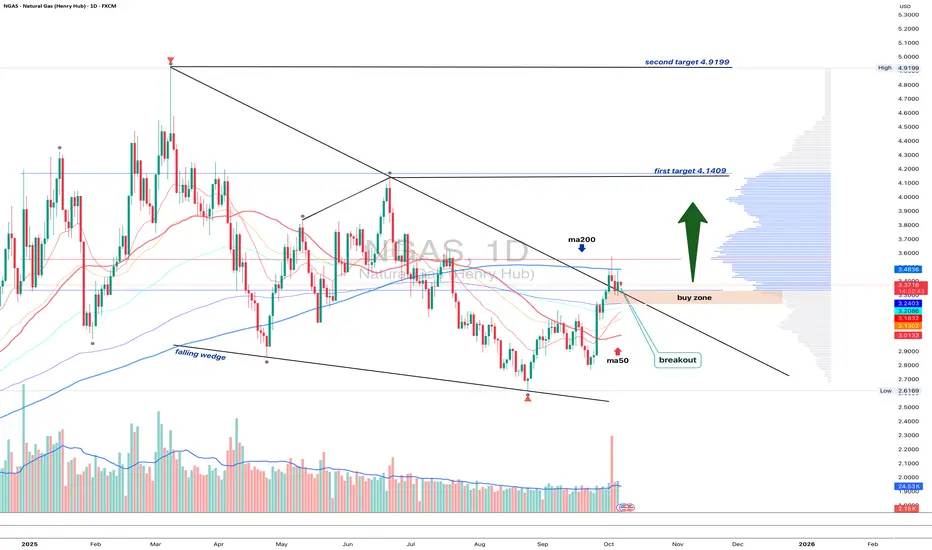
NGAS 1D - bulls waiting for the green lightOn the daily chart, Natural Gas has broken out of a falling wedge, but price remains below the MA200, while EMA still hovers above it - a mixed signal showing short-term hesitation within a longer-term downtrend.
The 3.10–3.20 buy zone remains key - that’s where the retest area aligns with short-term support. If buyers can reclaim the EMA and push above the MA200, the next upside targets are 4.14 and then 4.92.
Volume on the breakout supports growing bullish interest, while fundamentals - like rising seasonal demand - may soon add more fuel to the move.
Tactically , watch how price behaves near MA200. Once EMA flips back on top, momentum could accelerate fast. Until then, the market’s like a gas burner waiting for that click - ignition pending
AI expanded collaboration with MSFT MicrosoftPositioning for the next wave of enterprise AI adoption, rather than the last earnings print:
1. Deepening Microsoft Integration = Real Distribution Power
The most important recent development is C3ai’s expanded collaboration with Microsoft:
C3 ai is now natively integrated across Microsoft Copilot, Microsoft Fabric and Azure AI Foundry, effectively becoming an “intelligence layer” on top of Microsoft’s enterprise stack.
This makes it much easier for large customers already running on Azure and using Copilot to deploy, manage, and scale vertical AI applications from C3ai (manufacturing, energy, financial services, government, etc.).
In simple terms: Microsoft brings the distribution and cloud muscle; C3ai brings vertical AI apps. If this integration starts to convert more pilots into long-term subscriptions, the current depressed valuation may not last.
2. Beaten-Down Expectations + Long Runway
Bears focus on the obvious problems:
Revenue has recently declined and margins are under pressure as C3 ai spends to convert pilots and expand its product suite.
Cash flow is negative, and there’s no GAAP profitability in sight yet.
However, management guides for positive free cash flow by FY26 and non-GAAP profitability in the second half of FY27, with strong revenue growth resuming as production deployments scale.
If those targets prove even roughly correct, the stock today is pricing in a lot of failure. Any upside surprise on:
deal conversions,
operating leverage, or
new, high-profile customer wins via Microsoft’s ecosystem
could trigger a meaningful re-rating from these levels.
3. Macro Headwinds as Future Tailwinds
Recent economic data and rate worries have hit high-growth tech – including C3ai – as investors fled anything with long-dated cash flows.
For a contrarian bull, that’s exactly the kind of environment where:
expectations are low,
sentiment is washed out,
and good news is under-priced.
If the macro picture stabilizes and rate-cut expectations firm up, beaten-down AI names like C3.ai can suddenly look interesting again, especially with a strategic partner like Microsoft in their corner.
AI is a potential buyout candidate, in my opinion.

VKTX Viking Therapeutics Potential Buyout Soon?!If you haven`t bought VKTX before the previous rally:
If GLP-1 obesity drugs are a multi-hundred-billion-dollar opportunity, a successful VK2735 (injectable + oral) could justify a valuation far north of where VKTX trades today—if it makes it to market.
My bullish thesis:
1. GLP-1 Momentum + “Mini Lilly / Novo” Narrative
VKTX is seen as a “pure play” on the global obesity and metabolic-disease boom.
Viking’s lead program, VK2735, is a dual GLP-1/GIP receptor agonist being developed in both injectable and oral form for obesity and related metabolic disorders.
Phase 1 and Phase 2 data for the injectable version have already shown meaningful weight loss with an encouraging safety/tolerability profile, which is why it advanced into large Phase 3 obesity trials.
An oral version of VK2735 is in Phase 2 obesity trials and, in the VENTURE oral study, delivered up to ~12.2% mean weight loss at 13 weeks, with a clear dose response.
2. Rapid Trial Execution = Strong Momentum & Upcoming Catalysts
Another big talking point is how fast Viking is executing on its trials, which bulls see as a leading indicator of future news flow:
Viking recently announced completion of enrollment in its Phase 3 VANQUISH-1 VK2735 obesity trial, with ~4,650 patients (above the original 4,500 target).
The company highlighted VK2735 data at ObesityWeek 2025 and continues to position both injectable and oral formulations as core programs.
Management has reiterated that VK2735 oral and injectable programs are moving forward on schedule, with more data expected as Phase 3 and longer-duration studies mature.
3. Short Interest + “Squeeze Fuel” Angle
VKTX has a high short interest, which Twitter traders love to highlight:
Recent data shows around 22–23% of the float short, with days to cover >5 based on average volume.
For many momentum and options traders, this is exactly the kind of setup they look for:
High short interest = a lot of investors betting against the stock.
Any positive surprise (trial data, partnership, M&A rumor, or a strong breakout on the chart) could force shorts to cover.
If that happens during a period of high retail interest, the price action can get violent to the upside.
4. Analyst Targets + Big Pharma Takeover Speculation
Analyst consensus is currently Strong Buy, with an average price target around $95+.
On top of that, there’s constant speculation that VKTX could become a takeover target:
The GLP-1 market is being dominated by Eli Lilly (Zepbound, Mounjaro) and Novo Nordisk (Wegovy, Ozempic).
Many large pharma companies without a strong obesity franchise might prefer buying a late-stage asset rather than starting from scratch.
VK2735, with Phase 3 obesity trials underway and promising oral data, is the kind of asset that fits that narrative.

HPQ HP Options Ahead of EarningsIf you haven`t sold HPQ before the previous earnings:
Now analyzing the options chain and the chart patterns of HPQ HP prior to the earnings report this week,
I would consider purchasing the 23usd strike price Puts with
an expiration date of 2025-12-19,
for a premium of approximately $0.74.
If these options prove to be profitable prior to the earnings release, I would sell at least half of them.

DE Deere & Company Options Ahead of EarningsAnalyzing the options chain and the chart patterns of DE Deere & Company prior to the earnings report this week,
I would consider purchasing the 510usd strike price Calls with
an expiration date of 2025-12-19,
for a premium of approximately $8.95.
If these options prove to be profitable prior to the earnings release, I would sell at least half of them.

BRIEFING Week #47 : Monthly Reversal in ?Here's your weekly update ! Brought to you each weekend with years of track-record history..
Don't forget to hit the like/follow button if you feel like this post deserves it ;)
That's the best way to support me and help pushing this content to other users.
Kindly,
Phil

AdvancedMA Toolkit: From Building Blocks to StrategyAdvancedMA Toolkit: From Building Blocks to Strategy Optimization
This idea explores the full ecosystem behind the
and — a complete environment
for building, testing, and optimizing moving average-based strategies.
We go beyond signals: this is about understanding market structure, parameter sensitivity, and adaptive risk management .
█ CORE PHILOSOPHY: Beyond Signals, Towards Understanding
The AdvancedMAToolkit is not a "magic indicator". It's a strategy development lab that helps you:
Build complex systems from modular MA blocks
Adapt to changing market regimes via dynamic periods
Simulate virtual trading with real-time statistics
Optimize parameters using Auto-RR and multi-objective logic
Find the best sets of strategy related options and risk/reward
Generate 2nd-layer high-conviction signals from main ones
The goal? Find robust configurations — not just high win rates.
█ THE 14 MOVING AVERAGES: When to Use Each
Each MA type has a unique personality. Here's a practical guide:
SMA — Simple Moving Average. Pure price average. Use for baseline trend in Pine Script strategies.
EMA — Exponential Moving Average. Responsive to recent price. Great for entries and momentum detection.
RMA — Relative Moving Average. Like EMA but smoother, including older data
for stable trends.
WMA — Weighted Moving Average. Weights recent bars more. Good for
momentum confirmation.
VWMA — Volume Weighted Moving Average. Volumes give accurate
market sentiment and trend representation.
DEMA — Double EMA. Effective in consolidated trends.
Used to confirm trading signals in volatile markets.
TEMA — Triple EMA. Reduced lag and noise filtering for scalping and
quick reversals.
HMA — Hull Moving Average. Smoothed EMA that reduces lag in strong trends,
responsive to price changes.
ZLEMA — Zero-Lag EMA. Minimizes delay for earlier signals on trend changes
(use cautiously in noisy markets).
FRAMA — Fractal Adaptive MA. Adapts dynamically to volatility for
adaptive smoothing.
SuperTrend — ATR-based trend filter with dynamic support/resistance.
Ideal for stop placement and trailing.
TMA — Triangular MA. Gives more weight to middle data points,
with added lag for smoother trends.
TRIMA — Weighted Triangular MA. Removes random price fluctuations
for cleaner signals.
T3 — Triple-smoothed EMA. Excellent for swing trading with minimal lag
and clean trend lines.
Pro Tip: Combine fast (HMA/ZLEMA) for entries + slow (T3/FRAMA) for trend confirmation.
█ RETEST SYSTEM: The Quality Gate
Instead of taking every crossover, wait for price to retest the MA zone :
Zone % : Distance from MA (e.g., 1.5% = tight zone)
Min Retests : 1 = quick, 3 = high conviction
Triggers : High/Low for entry, Close for exit
Higher retests = fewer signals, higher probability.
Retest Close-Up: Zone touch + min retests (2+ for conviction).
Zones highlight on touch (more intense color) – but signals only if min retests/trigger match (aside from other filters).
█ FILTER STACK: Multi-Layer Confirmation
Momentum Filter : Catches early trend changes (aggressive = more noise)
Fast MA : Entry timing (ZLEMA on price)
Medium MA : Confirmation (EMA on MA)
Slow MA : Trend direction (T3 on close)
Patterns : Inside Bar = consolidation, Engulfing = reversal
Use OR logic for more signals, AND for quality.
█ AUTO-RR & MULTI-OBJECTIVE OPTIMIZATION
The statistics table is your virtual backtester :
RR Base : Focus on risk/reward ratio
Multi-Objective : Balances 4 metrics (RR, Win Rate, DD, PF)
Calculation Methods : Simple, Weighted, Robust Median
Suggested RR : Auto-optimized for current config
How to read it:
→ Profit Factor > 1.5 + Drawdown < 15% = robust
→ Win Rate 60% with PF 1.8 > 70% with PF 1.2
Data Window Highlights: Dynamic Params & RR
Take a look at this little animation demo showing data window with animated ellipses on key metrics (dynamic period, SL/TP)
█ STRATEGY MODES: Match Your Style
OCO Mode : One trade at a time (traditional)
Hedging : Long + Short simultaneously
Pyramid : "Only in Drawdown" = averaging down
Aggressive : "All Signals" = max opportunities
█ DUAL SIGNAL SYSTEM: Main & Table Explained
Main Signals : Crossover + retest + filters → "UP" (Green) / "DN" (Red).
Table Signals : From stats engine → "T UP" (Green) / "T DN" (Red) for high-conviction.
Some key points for Table Signals :
Trade Management : OCO, pyramiding in drawdown, or all signals — full flexibility.
Auto-RR Optimization : 4 modes to auto-tune SL/TP
Dropdown menus : Allow manual parameters or to display/apply recommended ones.
Note:
The Auto-RR system is completely independent, it doesn't take the parameters from the “statistics section” for calculations, not even as initial values, they are based solely on actual price movements (how much profit/loss an order could have made).
Remember: The stats table doesn’t just analyze — it generates real, actionable 2nd-layer signals, for hedging, swing, or custom strategies.
Dual System in Action: Signal Styles & TP/SL Fade Demo
Watch signals evolve with color/line fades, table compact modes on/off, and live TP/SL levels.
█ PRACTICAL BLUEPRINTS
A. Conservative Swing Trader
→ HMA(150), Retest 2+, Slow MA filter, OCO + First Only
→ Focus: PF > 1.5, DD < 15%
B. Active Day Trader
→ ZLEMA(20), Retest off, Momentum + Fast MA, All Signals
→ Focus: Trade frequency + Win Rate stability
C. Quant Developer
→ Use library in custom strategy:
= AdvancedMAToolkit.trend_and_signals("FRAMA", close, 50, true, 2, 200)
Zone Signals & Suggested RR
See a demo of a scrolling chart in action with highlighted zones and auto-suggested RR in table.
█ POWER COMBOS: Pro Tips for Advanced Users
SuperTrend + 3x ZLEMA : Zero-lag trend filter – responsive, low-noise for perpetuals/DAX.
Trigger as Confirmation Filter : Use 'Open' for exits – confirms at next bar opens.
Chaining MA Outputs : Pass one MA as source to another function – efficient for multi-layer setups (avoid over-chaining for speed).
█ FUTURE ROADMAP (ENHANCEMENTS IDEAS)
Custom Metric Weights: Prioritize Return % while stabilizing other metrics.
Reversal Engine: Detect via zone breaks for trend reversals.
Dynamic Position Sizing: Auto-adjust from stats table.
Multi-timeframe Integration: Use security() for higher TF confirmation.
Additional MA Types:
VIDYA — Volatility Index Dynamic MA. Smooth in choppy markets, fast in trends.
KAMA — Kaufman's Adaptive MA. Efficiency ratio-based for volatility adaptation.
ALMA — Arnaud Legoux MA. Gaussian-weighted for minimal lag + smoothness.
Planned for v3.0 – share your ideas in comments!
█ FINAL NOTE
This is a tool for thinkers . The power lies in your ability to:
Understand parameter trade-offs
Backtest across regimes
Combine with volume/order flow
Manage risk properly
Past performance ≠ future results. Use wisely.
═════════════════════════════════════════════════════════
┌──────────────────────────────────────────┐
Deep Dive: Understanding Dual Signals in AdvancedMA Toolkit
└──────────────────────────────────────────┘
The AdvancedMAToolkit is a comprehensive strategy development lab designed to empower traders with modular tools for creating, testing, and refining moving average-based systems. It goes beyond simple indicators by providing a flexible framework that adapts to real market dynamics, encouraging experimentation while emphasizing the importance of visual confirmation on the chart. Let's dive into its core philosophy and practical applications.
CORE PHILOSOPHY: Beyond Signals, Towards Understanding
This toolkit isn't a "magic indicator" that promises effortless profits—it's a strategy development lab that helps you build and iterate on systems with intention. At its heart is the understanding that trading isn't about forcing patterns but recognizing natural market behaviors. The toolkit encourages a balanced approach: use its components to construct setups, but always keep your eyes on the chart to validate results. No automation can replace human intuition in perceiving shifts in market sentiment or anomalies.
Key ways the toolkit supports this:
Build complex systems from modular MA blocks
Adapt to changing market regimes via dynamic periods, where the period can adjust based on volatility or user-defined clamping (min/max limits to prevent extreme swings).
Simulate virtual trading with real-time statistics
Optimize parameters using Auto-RR and multi-objective logic, focusing on realistic Risk/Reward based on historical price movements rather than arbitrary assumptions.
Find the best sets of options and Risk/Reward, tailored to your trading style—whether conservative hedging or aggressive swing trading.
Generate 2nd-layer high-conviction signals from main ones, where filters refine raw outputs into actionable trades without overcomplicating the core logic.
Remember, the goal is to perceive market "personality" through these tools—price scales influence zone % (e.g., 1% on crypto perpetuals might be tight or loose depending on asset volatility), and experimenting with inversions (e.g., decay/restart logic in dynamic periods) can reveal hidden patterns, like turning regression lines into zig/zag for high-limit scenarios.
CORE COMPONENTS: The Building Blocks
Start with the foundational elements that form the toolkit's backbone. The modular MA rotator allows seamless switching between 14 types, each suited to different market conditions. For instance, HMA or ZLEMA excel in trending environments, while FRAMA or SuperTrend adapt to volatility spikes. The trend_and_signals function generates raw main signals based on crossovers, retests, and filters.
The dynamic period feature is key here: it adjusts MA lengths based on market regimes, with options for exponential growth/decay or clamping to avoid overextension. Inverting decay/restart logic might seem counterintuitive at first, but it can highlight non-linear behaviors—e.g., on DAX or crypto, where price frequency doesn't always form stable patterns, this inversion turns "noise" into insight, like perceiving manipulated liquidity grabs as deviations from natural trends.
Triggers add nuance: use high/low for zone touches (entry/exit on extremes) or open/close for bar confirmation (safer in volatile perpetuals). This flexibility lets you align with asset character—e.g., on high-frequency crypto, open triggers for zones reduce false breaks, while high/low works for directional bias.
PARAMETER TUNING: Finding the Sweet Spot
Tuning is where the toolkit shines, blending manual control with automated insights. Core parameters (e.g., Factor for dynamic period, regression line lookback) interact with stats section for holistic optimization. Start with dynamic period limits: set min/max clamping to bound adaptations – a high-pass/low-pass filter that cuts fast/slow ranges for targeted regime shifts.
The Auto-RR system (4 modes) tunes SL/TP independently, based solely on price movements—not initial stats params. "Suggested" mode displays optimized values (e.g., RR 1:2 for both sides) without applying them progressively – if you insert manually, results differ because it skips bar-by-bar historical recalculation, applying them in a 'static way' at each bar (no historical evolution). In "Auto-Apply" mode, it recalculates dynamically on every bar (e.g., bar 0: 1:2, bar 1: 1.3:2.1, bar 2: 1.2:2.3), ensuring full dataset evolution matches the display.
Experiment with high general periods (e.g., 5000+ lookback): regression lines turn into zig/zag ("clipped waves" like audio peaks beyond scale) – not errors, but insights into deviations or manipulations. Always cross-check with eyes on the chart: tweak % zones for asset scale (e.g., 1% tight on crypto perpetuals, loose on indices) if they feel mismatched (too expanded/contracted) – no auto-scaling yet (future idea?), but visual feedback guides adjustments. Switch MA types (e.g., VWMA for volume-weighted insights) if needed, at the end of the journey, the circle starts at MA and after gradual test of parameters combinations it turns back to MA, that in these cases remain the last tweak when all the rest is properly settled.
FILTERS & COMBINATIONS: Layering for Precision
Filters are the toolkit's secret weapon for refining signals without overwhelming the system. The fast filter (price-based) pairs well with momentum for quick momentum plays, while medium holds up in combos with fast + momentum. Slow adds stability but can over-filter if not lightened.
Key combos to test:
Fast + Momentum: Lightweight, ideal for high-frequency assets like crypto perpetuals – use for initial signal pruning.
Fast + Momentum + Patterns: Holds in volatile markets; patterns add robustness without excess lag.
All Filters (Fast + Medium + Slow + Patterns): Reduces signals drastically – use sparingly, as ❝too much is less❞ (over-filtering). On DAX, medium + slow might outperform full stack; on crypto, fast + momentum often suffices.
Standalone Patterns: Surprisingly effective alone for visual confirmation – experiment by disabling others.
Associate with dynamic period: lighter filters (fast/momentum) pair with aggressive dynamic settings; heavier (medium/slow) with clamped periods. The goal? Balance: too many filters choke opportunities, but strategic combos (e.g., fast + slow without medium) can surprise. Always monitor core signals as "raw" baseline – filters refine, but don't replace chart intuition.
Pro Tip for Power Users: SuperTrend is the star here (ATR-based levels for dynamic support/resistance). Pair it with ZLEMA in all 3 filters for low-lag setups – e.g., SuperTrend + 3x ZLEMA creates a "zero-lag trend filter" that's responsive without noise, perfect for perpetuals or DAX. Triggers enhance this: use 'Open' for exits to confirm if the next bar opens in the signal zone, acting as a built-in validation filter.
ADVANCED EXPERIMENTATION: Unlocking Hidden Dynamics
Push the toolkit further with targeted tweaks. Invert dynamic period decay/restart for non-standard insights: on high lookback, regression becomes zig/zag – intentional "volume up" to spot peaks/outliers, revealing liquidity grabs or manipulations as deviations from natural patterns.
Scale awareness is crucial: % zones vary by asset (1% tight on crypto, loose on indices like DAX) – no auto-scaling yet, but manual adjustment + chart eyes spot mismatches (zones too stretched/contracted = tweak % or MA type). Frequency/TF influence: high-frequency perpetuals favor fast triggers (open for zones), while lower TF need high/low for extremes.
Combine with volumetrics (future integration): use gravity centers from higher TF as retest zones – if prices bounce/break, it's a signal. Add volatility auto-correlations for "perceiving" present moves (vol real = money), vs technical as "past photo". This hybrid turns the toolkit into a full strategy lab.
For Quantum Developers: Chain MA outputs as source to another function call – e.g., use one MA result as input for a second trend_and_signals(). It's efficient (no major speed hit), but avoid over-chaining to keep performance crisp.
Experimentation Fade: Zig/Zag & Variant Entries
See a fade through preset changes, regression zig/zag, and entry variations on same chart.
INTEGRATION WITH REAL-TIME ANALYSIS: The Volumetric Bridge
While the toolkit excels in technical "past photos" (patterns, trends), pair it with volumetrics/order-flow for "present" edge. Find volumetric gravity centers on higher TF – use as additional retest: bounce = confirmation, break = reversal. Auto-correlate volatility to gauge market character – smooth for chop, fast for trends.
This synergy: toolkit for setup/optimization, volumetrics for execution. No gaps in order-flow = precise entries; toolkit's stats refine MM (OCO for hedging, pyramiding in drawdown for recovery). Result: perceive manipulations (liquidity grabs as "unnatural" deviations) and trade with conviction.
CONCLUSION: Empower Your Trading
The AdvancedMAToolkit is your lab for crafting strategies – experiment freely, but always verify on the chart. From core MA to filtered signals, it's designed for flexibility without forcing trades. Future volumetric integration will elevate it further. Share your setups in comments!
(For the Auto-RR: 4 modes tune SL/TP based on price alone – independent, forward-looking. Test on perpetuals for scale insights.)
══════════════════════════════════════════════════════════
🛡️ Essential Disclaimer & Final Note
This is a sophisticated analytical tool for education, research, and strategy development. The statistics are based on historical data and virtual trading. Past performance is not indicative of future results.
You must do the following:
Understand the logic behind every setting you change.
Thoroughly backtest across different market conditions (trending, ranging, volatile).
Practice sound risk management, including appropriate position sizing, before ever considering live trading.
The power of this tool is directly proportional to the understanding and discipline of the user. It is designed not to give you easy answers, but to help you ask better questions and find robust, personalized trading solutions.

Risk Management for Automated SystemsAutomation gives you speed, consistency, and emotionless execution, but it also has a dark side.
A bot can follow rules perfectly, but if the rules are risky, it will amplify the danger with mechanical precision.
That’s why risk management is the backbone of every successful automated strategy.
It doesn’t matter how good your code is — without proper risk control, even the smartest system can fail fast.
Below are five core pillars of risk management that every trader should build into their automation framework.
1. Know Your Maximum Drawdown
Every trading system, even the best one, goes through losing streaks.
What matters isn’t avoiding them, but controlling how deep they cut.
Setting a maximum drawdown limit defines the exact point where your bot pauses or shuts down.
Whether it’s 5%, 10%, or 20%, this boundary protects your capital and your mindset.
Why it matters:
Prevents “death spirals” during high volatility
Stops the system if market conditions change
Forces you to step back and evaluate logic
Protects the account from black swan trends
A bot that can’t stop itself, is a bot that will eventually blow up.
A bot that knows when to stop, survives.
2. Position Sizing Is Everything
You can have the best entry logic in the world, but if your position sizes are inconsistent or too large, the system becomes unstable.
Smart position sizing adapts to:
Account balance
Market volatility
Asset liquidity
A fixed-percentage model, such as risking 1–2% per trade, keeps performance steady even during rough periods.
It also allows your system to grow naturally without taking oversized risks.
Think of sizing as the volume knob of your bot — turn it too high, and you distort everything.
3. Avoid Correlated Exposure
Running several bots doesn’t automatically mean you are diversified.
Many traders make the mistake of running multiple strategies that all rely on the same market behavior.
For example:
Three momentum bots on BTC, ETH, and SOL are still highly correlated
Two trend systems may fail at the same time if the market suddenly ranges
Several “dip-buying” strategies will all get hit hard during a crash
True diversification means mixing:
Uncorrelated assets
Different signal types
Varying timeframes
Both trend and mean-reversion logic
The goal is for your bots to perform differently, not identically.
4. Review Your System’s Risk Profile
Markets change, and so should your risk model.
Volatility increases and decreases, spreads widen, volume dries up, and certain assets become more unpredictable.
Regular reviews ensure your system stays aligned with real conditions.
What to check:
Has drawdown increased over the last quarter?
Are trades becoming larger than planned due to volatility shifts?
Has your system entered a new market phase it wasn’t designed for?
Are win rates or profit factor weakening?
A quarterly or monthly audit reveals issues before they explode.
Risk management isn’t a one-time setup — it’s a continuous process.
A strategy tester can be very good tool to help you manage risk properly and evaluate risk.
Here is an example from one of our strategies.
5. Let Risk Management Be Automated Too
If your entries are automated but your risk controls aren’t, you’re only half-protected.
Risk management logic you can automate:
Stop-loss placement
Progressive stop tightening
Position scaling
Reducing size after a losing streak
Pausing after reaching a daily or weekly limit
Complete shutdown at max drawdown
This turns your bot into a self-regulating system that responds to both opportunity and danger.
The more risk rules you automate, the less emotional interference you’ll face — and the more consistent your results become.
What will be the next gold trend on November 18th?1. Trend and Trend Lines
Prices are trading below a major descending trend line.
→ The overall trend remains down.
The long-term ascending trend line (red) has already broken out,
signaling weakening buying pressure and increased downward pressure.
2. Key Resistance
4.103 – 4.105:
Strong resistance zone where the Fibonacci (0.618–0.5), horizontal resistance, and EMA overlap.
→ Selling is likely to reassert itself in this price range.
3. Key Support
3.932 – 3.940:
This is the strongest support zone, overlapping the Fibonacci extension at 2.618.
This is an important low point in the bearish structure.
4. Price Scenario
If prices fail to retest the resistance at 4.103,
→ A continued decline along the downward trend is likely.
The next target is around 3.932 – 3.950.
Summary
Major Trend: Downward
Strong Resistance: 4.103 – 4.105
Target Support: 3.932 – 3.950
Structure: Trendline Break + Fibo Extension → Prefer Downward Scenario
BUY GOLD: 3932 – 3930
Stop Loss: 3922
Take Profit: 100–300–500 pips
SELL SCALP GOLD: 4064 – 4066
Stop Loss: 4073
Take Profit: 100–300–500 pips
SELL GOLD: 4103 – 4105
Stop Loss: 4115
Take Profit: 100–300–500 pips
