NAS100 QQQ CRACKING! AGAIN!NASDAQ has been CRACKING everywhere, structure after structure. Now it's forming a major double top.
What we need to see now is lower lows and highs in a commanding way. If it continues this back-filling, then I would call this a High base for more upside.
This is a simple, low-risk, short setup. Trading it against previous highs. (even if it breaks a bit above it) with a lot of downside potential!
This is the cost of doing business the right way. Be willing to take the small hits until you get PAID! WELL!
So I would forget about this trade if I were planning to jump in and out. I would hold it, giving time to PAY ME!
If you enjoy the work:
👉 Drop a solid comment
Let’s push it to 6,000 and keep building a community grounded in raw truth, not hype.
Indices

GER30 H4 | Bearish Reversal Off 61.8% Fib ResistanceBased on the H4 chart analysis, we can see that the price has rejected off our sell entry level at 24,979.14, which is a pullback resistance that aligns with the 50% Fibonacci retracement.
Our stop loss is set at 25,258.58, which is a pullback resistance that aligns with the 78.6% Fibonacci retracement.
Our take profit is set at 24,453.48, which is an overlap support.
High Risk Investment Warning
Stratos Markets Limited fxcm.com Stratos Europe Ltd fxcm.com
CFDs are complex instruments and come with a high risk of losing money rapidly due to leverage. 69% of retail investor accounts lose money when trading CFDs with this provider. You should consider whether you understand how CFDs work and whether you can afford to take the high risk of losing your money.
Stratos Global LLC fxcm.com Losses can exceed deposits.
Please be advised that the information presented on TradingView is provided to FXCM (‘Company’, ‘we’) by a third-party provider (‘TFA Global Pte Ltd’). Please be reminded that you are solely responsible for the trading decisions on your account. Any information and/or content is intended entirely for research, educational and informational purposes only and does not constitute investment or consultation advice or investment strategy. The information is not tailored to the investment needs of any specific person and therefore does not involve a consideration of any of the investment objectives, financial situation or needs of any viewer that may receive it. Past performance is not a reliable indicator of future results. Actual results may differ materially from those anticipated in forward-looking or past performance statements. We assume no liability as to the accuracy or completeness of any of the information and/or content provided herein and the Company cannot be held responsible for any omission, mistake nor for any loss or damage including without limitation to any loss of profit which may arise from reliance on any information supplied by TFA Global Pte Ltd.
Stratos Trading Pty. Limited fxcm.com
Trading FX/CFDs carries significant risks. FXCM AU (AFSL 309763), please read the Financial Services Guide, Product Disclosure Statement, Target Market Determination and Terms of Business at fxcm.com

Bullish bounce off?Dow Jones (US30) is falling towards the pivot, which acts as an overlap support that aligns with the 61.8% Fibonacci projection and could bounce to the 1st resistance.
Pivot: 48,706.08
1st Support: 48,065.48
1st Resistance: 49,361.57
Disclaimer:
The opinions given above constitute general market commentary and do not constitute the opinion or advice of IC Markets or any form of personal or investment advice.
Any opinions, news, research, analyses, prices, other information, or links to third-party sites contained on this website are provided on an "as-is" basis, are intended to be informative only, and are not advice, a recommendation, research, a record of our trading prices, an offer of, or solicitation for, a transaction in any financial instrument and thus should not be treated as such. The information provided does not involve any specific investment objectives, financial situation, or needs of any specific person who may receive it. Please be aware that past performance is not a reliable indicator of future performance and/or results. Past performance or forward-looking scenarios based upon the reasonable beliefs of the third-party provider are not a guarantee of future performance. Actual results may differ materially from those anticipated in forward-looking or past performance statements. IC Markets makes no representation or warranty and assumes no liability as to the accuracy or completeness of the information provided, nor any loss arising from any investment based on a recommendation, forecast, or any information supplied by any third party

AUS200 H4 | Bullish Continuation SetupBased on the H4 chart analysis, we can see that the price has bounced off our buy entry level at 8,850.90, which is a pullback support.
Our stop loss is set at 8,750.57, which is a pullback support.
Our take profit is set at 9,066.44, which aligns with the 161.8% Fibonacci extension.
High Risk Investment Warning
Stratos Markets Limited fxcm.com Stratos Europe Ltd fxcm.com
CFDs are complex instruments and come with a high risk of losing money rapidly due to leverage. 69% of retail investor accounts lose money when trading CFDs with this provider. You should consider whether you understand how CFDs work and whether you can afford to take the high risk of losing your money.
Stratos Global LLC fxcm.com Losses can exceed deposits.
Please be advised that the information presented on TradingView is provided to FXCM (‘Company’, ‘we’) by a third-party provider (‘TFA Global Pte Ltd’). Please be reminded that you are solely responsible for the trading decisions on your account. Any information and/or content is intended entirely for research, educational and informational purposes only and does not constitute investment or consultation advice or investment strategy. The information is not tailored to the investment needs of any specific person and therefore does not involve a consideration of any of the investment objectives, financial situation or needs of any viewer that may receive it. Past performance is not a reliable indicator of future results. Actual results may differ materially from those anticipated in forward-looking or past performance statements. We assume no liability as to the accuracy or completeness of any of the information and/or content provided herein and the Company cannot be held responsible for any omission, mistake nor for any loss or damage including without limitation to any loss of profit which may arise from reliance on any information supplied by TFA Global Pte Ltd.
Stratos Trading Pty. Limited fxcm.com
Trading FX/CFDs carries significant risks. FXCM AU (AFSL 309763), please read the Financial Services Guide, Product Disclosure Statement, Target Market Determination and Terms of Business at fxcm.com

Bullish bounce off?S&P500 (US500) has bounced off the pivot and could potentially rise to the 1st resistance.
Pivot: 6,953.78
1st Support: 6,888.85
1st Resistance: 7,054.81
Disclaimer:
The opinions given above constitute general market commentary and do not constitute the opinion or advice of IC Markets or any form of personal or investment advice.
Any opinions, news, research, analyses, prices, other information, or links to third-party sites contained on this website are provided on an "as-is" basis, are intended to be informative only, and are not advice, a recommendation, research, a record of our trading prices, an offer of, or solicitation for, a transaction in any financial instrument and thus should not be treated as such. The information provided does not involve any specific investment objectives, financial situation, or needs of any specific person who may receive it. Please be aware that past performance is not a reliable indicator of future performance and/or results. Past performance or forward-looking scenarios based upon the reasonable beliefs of the third-party provider are not a guarantee of future performance. Actual results may differ materially from those anticipated in forward-looking or past performance statements. IC Markets makes no representation or warranty and assumes no liability as to the accuracy or completeness of the information provided, nor any loss arising from any investment based on a recommendation, forecast, or any information supplied by any third party

Bearish reversal off 61.8% Fib resistance?DAX40 (DE40) has rejected off the pivot, which aligns with the 61.8% Fibonacci retracement and could drop to the overlap support.
Pivot: 25,044.65
1st Support: 24,419.65
1st Resistance: 25,454.88
Disclaimer:
The opinions given above constitute general market commentary and do not constitute the opinion or advice of IC Markets or any form of personal or investment advice.
Any opinions, news, research, analyses, prices, other information, or links to third-party sites contained on this website are provided on an "as-is" basis, are intended to be informative only, and are not advice, a recommendation, research, a record of our trading prices, an offer of, or solicitation for, a transaction in any financial instrument and thus should not be treated as such. The information provided does not involve any specific investment objectives, financial situation, or needs of any specific person who may receive it. Please be aware that past performance is not a reliable indicator of future performance and/or results. Past performance or forward-looking scenarios based upon the reasonable beliefs of the third-party provider are not a guarantee of future performance. Actual results may differ materially from those anticipated in forward-looking or past performance statements. IC Markets makes no representation or warranty and assumes no liability as to the accuracy or completeness of the information provided, nor any loss arising from any investment based on a recommendation, forecast, or any information supplied by any third party

US30 H1 | Bullish Bounce Off Overlap SupportBased on the H1 chart analysis, we can see that the price has bounced off our buy entry level at 48,897.36, which is an overlap support.
Our stop loss is set at 48,664.86, which is a pullback support level.
Our take profit is set at 49,263.62, which is a pullback resistance.

US2000 H1 | Bullish Bounce OffThe price has bounced off our buy entry level at 2,641.87, which is a pullback support.
Our stop loss is set at 2,600.84, which is a pullback support that aligns with the 78.6% Fibonacci retracement.
Our take profit is set at 2,708.35, which is a pullback resistance.
High Risk Investment Warning
Stratos Markets Limited fxcm.com Stratos Europe Ltd fxcm.com
CFDs are complex instruments and come with a high risk of losing money rapidly due to leverage. 69% of retail investor accounts lose money when trading CFDs with this provider. You should consider whether you understand how CFDs work and whether you can afford to take the high risk of losing your money.
Stratos Global LLC fxcm.com Losses can exceed deposits.
Please be advised that the information presented on TradingView is provided to FXCM (‘Company’, ‘we’) by a third-party provider (‘TFA Global Pte Ltd’). Please be reminded that you are solely responsible for the trading decisions on your account. Any information and/or content is intended entirely for research, educational and informational purposes only and does not constitute investment or consultation advice or investment strategy. The information is not tailored to the investment needs of any specific person and therefore does not involve a consideration of any of the investment objectives, financial situation or needs of any viewer that may receive it. Past performance is not a reliable indicator of future results. Actual results may differ materially from those anticipated in forward-looking or past performance statements. We assume no liability as to the accuracy or completeness of any of the information and/or content provided herein and the Company cannot be held responsible for any omission, mistake nor for any loss or damage including without limitation to any loss of profit which may arise from reliance on any information supplied by TFA Global Pte Ltd.
Stratos Trading Pty. Limited fxcm.com
Trading FX/CFDs carries significant risks. FXCM AU (AFSL 309763), please read the Financial Services Guide, Product Disclosure Statement, Target Market Determination and Terms of Business at fxcm.com

FTSE 100 Maintains Uptrend Structure Within Rising ChannelThe FTSE 100 continues to trade within a well-defined ascending channel, reflecting a broader bullish structure that has been in place for several months. Price remains above both the 50-period and 200-period simple moving averages, with the 50 SMA tracking closely beneath recent candles, suggesting sustained medium-term trend support while the 200 SMA reinforces longer-term bullish conditions.
In the most recent sessions, price action appears to be consolidating near the upper half of the channel, forming a short-term bullish flag or tight consolidation pattern. This behavior often reflects temporary digestion following a strong impulse move rather than a clear trend reversal. The rising channel boundaries remain respected, and no decisive breakdown has occurred so far.
Momentum indicators show mixed but constructive signals. The MACD remains above the zero line, indicating bullish momentum is still present, although the histogram has started to flatten, suggesting some loss of upside momentum in the near term. Meanwhile, RSI is hovering in the low 60s, staying above the neutral 50 level without reaching extreme overbought conditions, which supports the idea of controlled strength rather than exhaustion.
Overall, the technical structure favors a bullish bias while price holds above the channel midline and key moving averages. However, the ongoing consolidation highlights the importance of monitoring momentum and trend structure for confirmation of continuation versus deeper consolidation within the broader uptrend.
-MW

US2000 H1 | Bearish Reversal SetupBased on the H1 chart analysis, we could see the price rise towards our sell entry level at 2,692.02, which is a pullback resistance that aligns with the 50% Fibonacci retracement.
Our stop loss is set at 2,738.46, which is a swing high resistance.
Our take profit is set at 2,626.00, which is a multi swing low support.
High Risk Investment Warning
Stratos Markets Limited fxcm.com Stratos Europe Ltd fxcm.com
CFDs are complex instruments and come with a high risk of losing money rapidly due to leverage. 69% of retail investor accounts lose money when trading CFDs with this provider. You should consider whether you understand how CFDs work and whether you can afford to take the high risk of losing your money.
Stratos Global LLC fxcm.com Losses can exceed deposits.
Please be advised that the information presented on TradingView is provided to FXCM (‘Company’, ‘we’) by a third-party provider (‘TFA Global Pte Ltd’). Please be reminded that you are solely responsible for the trading decisions on your account. Any information and/or content is intended entirely for research, educational and informational purposes only and does not constitute investment or consultation advice or investment strategy. The information is not tailored to the investment needs of any specific person and therefore does not involve a consideration of any of the investment objectives, financial situation or needs of any viewer that may receive it. Past performance is not a reliable indicator of future results. Actual results may differ materially from those anticipated in forward-looking or past performance statements. We assume no liability as to the accuracy or completeness of any of the information and/or content provided herein and the Company cannot be held responsible for any omission, mistake nor for any loss or damage including without limitation to any loss of profit which may arise from reliance on any information supplied by TFA Global Pte Ltd.
Stratos Trading Pty. Limited fxcm.com
Trading FX/CFDs carries significant risks. FXCM AU (AFSL 309763), please read the Financial Services Guide, Product Disclosure Statement, Target Market Determination and Terms of Business at fxcm.com

UK100 H1 | Bullish RiseBased on the H1 chart analysis, we can see that the price is reacting off our buy entry level at 10,183.34, which is an overlap support.
Our stop loss is set at 10,132.53, which is a pullback support.
Our take profit is set at 10,272.06, which is a swing high resistance that aligns with the 127.2% Fibonacci extension.
High Risk Investment Warning
Stratos Markets Limited fxcm.com Stratos Europe Ltd fxcm.com
CFDs are complex instruments and come with a high risk of losing money rapidly due to leverage. 69% of retail investor accounts lose money when trading CFDs with this provider. You should consider whether you understand how CFDs work and whether you can afford to take the high risk of losing your money.
Stratos Global LLC fxcm.com Losses can exceed deposits.
Please be advised that the information presented on TradingView is provided to FXCM (‘Company’, ‘we’) by a third-party provider (‘TFA Global Pte Ltd’). Please be reminded that you are solely responsible for the trading decisions on your account. Any information and/or content is intended entirely for research, educational and informational purposes only and does not constitute investment or consultation advice or investment strategy. The information is not tailored to the investment needs of any specific person and therefore does not involve a consideration of any of the investment objectives, financial situation or needs of any viewer that may receive it. Past performance is not a reliable indicator of future results. Actual results may differ materially from those anticipated in forward-looking or past performance statements. We assume no liability as to the accuracy or completeness of any of the information and/or content provided herein and the Company cannot be held responsible for any omission, mistake nor for any loss or damage including without limitation to any loss of profit which may arise from reliance on any information supplied by TFA Global Pte Ltd.
Stratos Trading Pty. Limited fxcm.com
Trading FX/CFDs carries significant risks. FXCM AU (AFSL 309763), please read the Financial Services Guide, Product Disclosure Statement, Target Market Determination and Terms of Business at fxcm.com

Nasdaq — Quiet Start to the Year, But the Structure Is Building.The first month of the year was unusually quiet for the Nasdaq, with price contained inside a tight 1,000-point range, roughly 4% of value.
That calm, however, is starting to fade.
🔎 Signs of Life Since Last Week
Since last week, the index has begun to show clear bullish intent:
- a bullish engulfing candle on Wednesday
- followed by another bullish engulfing yesterday, which pushed price directly into resistance
- This sequence suggests buyers are no longer passive — they are stepping in with intent.
📐 Bigger Picture: A Clean Technical Structure
Looking at the broader context:
After the ATH at the end of October, the correction that followed stopped almost perfectly at the August ATH
From there, price began to compress higher, forming an ascending triangle on the daily chart
This is a textbook continuation pattern:
✔️ rising lows
✔️ flat resistance
✔️ tightening price action
🌍 Macro Noise Didn’t Break the Trend
Despite ongoing geopolitical tensions, the Nasdaq structure remained intact.
In fact, rather than breaking the trend, the volatility reinforced the compression, which often precedes expansion.
🎯 Outlook & Target
With such a clear technical setup and sustained structural strength, it is reasonable to expect:
➡️ a break above resistance
➡️ followed by continuation toward new ATHs
The measured move target for the ascending triangle comes in around:
🎯 27,800
That level could represent a realistic swing target for traders aligned with the trend.
✅ Conclusion
Nasdaq spent a month consolidating
With momentum returning and structure tightening, the market is positioning itself for resolution to the upside.

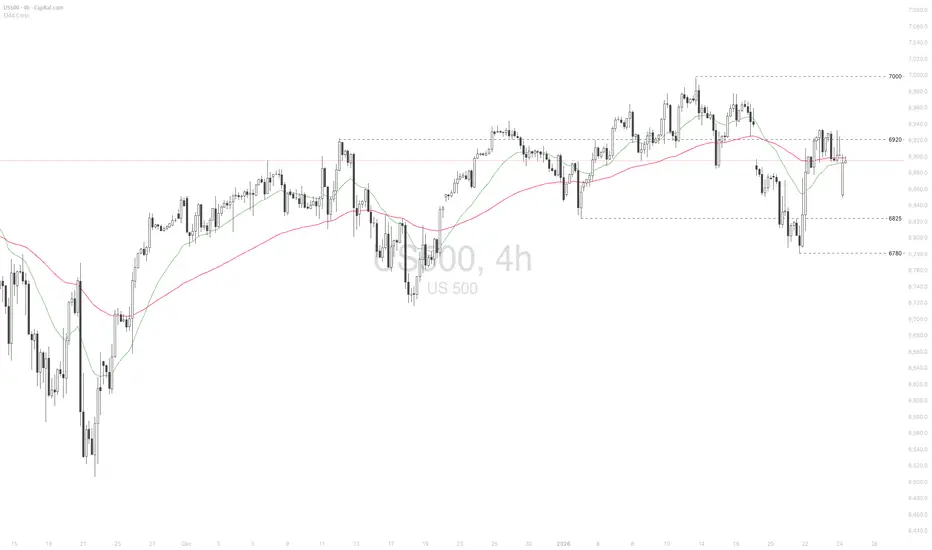
US500 range-bounded amid unresolved geopolitical uncertainty
Lingering geopolitical risks and a packed earnings calendar kept markets range-bound last week. However, easing concerns over potential US military action related to Greenland, alongside solid US economic data, helped limit downside pressure.
Intel (INTC) reported 4Q results in line with consensus, but weak 1Q guidance weighed on sentiment. While CPU demand remained strong, production and supply constraints persisted, and yields for the 18A foundry process fell short of expectations.
Despite ongoing geopolitical risks, confidence in US equities remains intact. Goldman Sachs (GS) noted a strong risk appetite extending into 1H2026, with client equity buying positions remaining solid.
US500 briefly held above the resistance at 6920 before pulling back to around the 6900 area. The index remains between both EMAs, with an unclear price structure, indicating potential consolidation within the range of 6825–6920. If the US500 breaches above EMA78 and the resistance at 6920, the index may advance toward the previous high at 7000. Conversely, if US500 fails to close above EMA21, the index may retreat further toward the next support at 6825.
Bullish bounce off 61.8% Fib support?DX40 (DE40) has bounced off the pivot which is a pullback support that aligns with the 61.8% Fibonacci retracement and could potentially rise to the 1st resistance.
Pivot: 24,412.21
1st Support: 23,886.70
1st Resistance: 25,503.46
Disclaimer:
The opinions given above constitute general market commentary and do not constitute the opinion or advice of IC Markets or any form of personal or investment advice.
Any opinions, news, research, analyses, prices, other information, or links to third-party sites contained on this website are provided on an "as-is" basis, are intended to be informative only, and are not advice, a recommendation, research, a record of our trading prices, an offer of, or solicitation for, a transaction in any financial instrument and thus should not be treated as such. The information provided does not involve any specific investment objectives, financial situation, or needs of any specific person who may receive it. Please be aware that past performance is not a reliable indicator of future performance and/or results. Past performance or forward-looking scenarios based upon the reasonable beliefs of the third-party provider are not a guarantee of future performance. Actual results may differ materially from those anticipated in forward-looking or past performance statements. IC Markets makes no representation or warranty and assumes no liability as to the accuracy or completeness of the information provided, nor any loss arising from any investment based on a recommendation, forecast, or any information supplied by any third party

Potential bearish drop off?US30 is reacting off the resistance level, which is an overlap resistance that aligns with the 23.6% Fibonacci retracement, and could drop from this level to our take profit.
Entry: 49,141.49
Why we like it:
There is an overlap resistance level that aligns with the 23.6% Fibonacci retracement.
Stop loss: 49,346.59
Why we like it:
There is a pullback resistance that aligns with the 50% Fibonacci retracement.
Take profit: 48,647.57
Why we like it:
There is a pullback support level that aligns with he 78.6% Fibonacci retracement.
Enjoying your TradingView experience? Review us!
Please be advised that the information presented on TradingView is provided to Vantage (‘Vantage Global Limited’, ‘we’) by a third-party provider (‘Everest Fortune Group’). Please be reminded that you are solely responsible for the trading decisions on your account. There is a very high degree of risk involved in trading. Any information and/or content is intended entirely for research, educational and informational purposes only and does not constitute investment or consultation advice or investment strategy. The information is not tailored to the investment needs of any specific person and therefore does not involve a consideration of any of the investment objectives, financial situation or needs of any viewer that may receive it. Kindly also note that past performance is not a reliable indicator of future results. Actual results may differ materially from those anticipated in forward-looking or past performance statements. We assume no liability as to the accuracy or completeness of any of the information and/or content provided herein and the Company cannot be held responsible for any omission, mistake nor for any loss or damage including without limitation to any loss of profit which may arise from reliance on any information supplied by Everest Fortune Group.

S&P 500 Daily Chart Analysis For Week of Jan 23, 2026Technical Analysis and Outlook:
The S&P 500 Index declined substantially during this week's trading session, eliminating both Mean Support levels at 6,902 and 6,850. Following this decline, the Index has demonstrated a striking rebound, stabilizing above the newly established Mean Support level at 6,897. It is projected that the Index will continue its upward trajectory towards the subsequent target of the Outer Index Rally at 7,026, via Key Resistance at 6,977.
However, it is essential to recognize that, given prevailing market conditions, there is a significant likelihood of a study to lower pullbacks that may retest the Mean Support at 6,897 before the Index returns to bullish sentiment and achieves the Outer Index Rally target of 7,026. At this stage, a renewed In Force retracement is anticipated to initiate from that level.

Bullish bounce off key support?Dow Jones (US30) could fall towards the pivot, which has been identified as an overlap support that aligns with the 61.8% Fibonacci retracement and could bounce to the 1st resistance, which is a multi-swing high resistance.
Pivot: 48,844.50
1st Support: 48,330.52
1st Resistance: 49,617.45
Disclaimer:
The opinions given above constitute general market commentary and do not constitute the opinion or advice of IC Markets or any form of personal or investment advice.
Any opinions, news, research, analyses, prices, other information, or links to third-party sites contained on this website are provided on an "as-is" basis, are intended to be informative only, and are not advice, a recommendation, research, a record of our trading prices, an offer of, or solicitation for, a transaction in any financial instrument and thus should not be treated as such. The information provided does not involve any specific investment objectives, financial situation, or needs of any specific person who may receive it. Please be aware that past performance is not a reliable indicator of future performance and/or results. Past performance or forward-looking scenarios based upon the reasonable beliefs of the third-party provider are not a guarantee of future performance. Actual results may differ materially from those anticipated in forward-looking or past performance statements. IC Markets makes no representation or warranty and assumes no liability as to the accuracy or completeness of the information provided, nor any loss arising from any investment based on a recommendation, forecast, or any information supplied by any third party

Falling towards 61.8% Fib support?US30 could fall towards the support level, which acts as an overlap support that aligns with the 61.8% Fibonacci retracement and could bounce from this level to our take profit:
Entry: 48,895.77
Why we like it:
There is an overlap support that aligns with the 61.8% Fibonacci retracement.
Stop loss: 48,436.19
Why we like it:
There is a pullback support level.
Take profit: 49,603.65
Why we like it:
There is a multi-swing high resistance.
Enjoying your TradingView experience? Review us!
Please be advised that the information presented on TradingView is provided to Vantage (‘Vantage Global Limited’, ‘we’) by a third-party provider (‘Everest Fortune Group’). Please be reminded that you are solely responsible for the trading decisions on your account. There is a very high degree of risk involved in trading. Any information and/or content is intended entirely for research, educational and informational purposes only and does not constitute investment or consultation advice or investment strategy. The information is not tailored to the investment needs of any specific person and therefore does not involve a consideration of any of the investment objectives, financial situation or needs of any viewer that may receive it. Kindly also note that past performance is not a reliable indicator of future results. Actual results may differ materially from those anticipated in forward-looking or past performance statements. We assume no liability as to the accuracy or completeness of any of the information and/or content provided herein and the Company cannot be held responsible for any omission, mistake nor for any loss or damage including without limitation to any loss of profit which may arise from reliance on any information supplied by Everest Fortune Group.

Bullish bounce off overlap support?Based on the H1 chart analysis, we could see the price fall to our buy entry level at 25,307.06, which is an overlap support that aligns with the 38.2% Fibonaci retracement.
Our stop loss is set at 25,110.69, which is an overlap support that is slightly below the 61.8% FIbonacci retracement.
Our take profit is set at 25,576.74, which is a pullback support.
High Risk Investment Warning
Stratos Markets Limited fxcm.com Stratos Europe Ltd fxcm.com
CFDs are complex instruments and come with a high risk of losing money rapidly due to leverage. 69% of retail investor accounts lose money when trading CFDs with this provider. You should consider whether you understand how CFDs work and whether you can afford to take the high risk of losing your money.
Stratos Global LLC fxcm.com Losses can exceed deposits.
Please be advised that the information presented on TradingView is provided to FXCM (‘Company’, ‘we’) by a third-party provider (‘TFA Global Pte Ltd’). Please be reminded that you are solely responsible for the trading decisions on your account. Any information and/or content is intended entirely for research, educational and informational purposes only and does not constitute investment or consultation advice or investment strategy. The information is not tailored to the investment needs of any specific person and therefore does not involve a consideration of any of the investment objectives, financial situation or needs of any viewer that may receive it. Past performance is not a reliable indicator of future results. Actual results may differ materially from those anticipated in forward-looking or past performance statements. We assume no liability as to the accuracy or completeness of any of the information and/or content provided herein and the Company cannot be held responsible for any omission, mistake nor for any loss or damage including without limitation to any loss of profit which may arise from reliance on any information supplied by TFA Global Pte Ltd.
Stratos Trading Pty. Limited fxcm.com
Trading FX/CFDs carries significant risks. FXCM AU (AFSL 309763), please read the Financial Services Guide, Product Disclosure Statement, Target Market Determination and Terms of Business at fxcm.com

UK100 H1 |Falling Towards Key SupportBased on the H1 chart analysis, we could see the price fall to our buy entry level at 10,180.09, which aligns with the 38.2% Fibonacci retracement.
Our stop loss is set at 10,122.34, which is a pullback support that is slightly below the 61.8% Fibonacci retracement.
Our take profit is set at 10,272.06, which is a swing high resistance.
High Risk Investment Warning
Stratos Markets Limited fxcm.com Stratos Europe Ltd fxcm.com
CFDs are complex instruments and come with a high risk of losing money rapidly due to leverage. 69% of retail investor accounts lose money when trading CFDs with this provider. You should consider whether you understand how CFDs work and whether you can afford to take the high risk of losing your money.
Stratos Global LLC fxcm.com Losses can exceed deposits.
Please be advised that the information presented on TradingView is provided to FXCM (‘Company’, ‘we’) by a third-party provider (‘TFA Global Pte Ltd’). Please be reminded that you are solely responsible for the trading decisions on your account. Any information and/or content is intended entirely for research, educational and informational purposes only and does not constitute investment or consultation advice or investment strategy. The information is not tailored to the investment needs of any specific person and therefore does not involve a consideration of any of the investment objectives, financial situation or needs of any viewer that may receive it. Past performance is not a reliable indicator of future results. Actual results may differ materially from those anticipated in forward-looking or past performance statements. We assume no liability as to the accuracy or completeness of any of the information and/or content provided herein and the Company cannot be held responsible for any omission, mistake nor for any loss or damage including without limitation to any loss of profit which may arise from reliance on any information supplied by TFA Global Pte Ltd.
Stratos Trading Pty. Limited fxcm.com
Trading FX/CFDs carries significant risks. FXCM AU (AFSL 309763), please read the Financial Services Guide, Product Disclosure Statement, Target Market Determination and Terms of Business at fxcm.com

Pullback resistance?DAX40 (DE40) is rising towards the pivot, which aligns with the 61.8% Fibonacci retracement and could reverse to the 1st support.
Pivot: 25,044.65
1st Support: 24,501.58
1st Resistance: 25,454.88
Disclaimer:
The opinions given above constitute general market commentary and do not constitute the opinion or advice of IC Markets or any form of personal or investment advice.
Any opinions, news, research, analyses, prices, other information, or links to third-party sites contained on this website are provided on an "as-is" basis, are intended to be informative only, and are not advice, a recommendation, research, a record of our trading prices, an offer of, or solicitation for, a transaction in any financial instrument and thus should not be treated as such. The information provided does not involve any specific investment objectives, financial situation, or needs of any specific person who may receive it. Please be aware that past performance is not a reliable indicator of future performance and/or results. Past performance or forward-looking scenarios based upon the reasonable beliefs of the third-party provider are not a guarantee of future performance. Actual results may differ materially from those anticipated in forward-looking or past performance statements. IC Markets makes no representation or warranty and assumes no liability as to the accuracy or completeness of the information provided, nor any loss arising from any investment based on a recommendation, forecast, or any information supplied by any third party

Could we see a reversal?Dow Jones (US30) has rejected off the pivot and could drop to the 1st support, which aligns with the 61.8% Fibonacci retracement.
Pivot: 49,323.36
1st Support: 48,718.35
1st Resistance: 49,582.90
Disclaimer:
The opinions given above constitute general market commentary and do not constitute the opinion or advice of IC Markets or any form of personal or investment advice.
Any opinions, news, research, analyses, prices, other information, or links to third-party sites contained on this website are provided on an "as-is" basis, are intended to be informative only, and are not advice, a recommendation, research, a record of our trading prices, an offer of, or solicitation for, a transaction in any financial instrument and thus should not be treated as such. The information provided does not involve any specific investment objectives, financial situation, or needs of any specific person who may receive it. Please be aware that past performance is not a reliable indicator of future performance and/or results. Past performance or forward-looking scenarios based upon the reasonable beliefs of the third-party provider are not a guarantee of future performance. Actual results may differ materially from those anticipated in forward-looking or past performance statements. IC Markets makes no representation or warranty and assumes no liability as to the accuracy or completeness of the information provided, nor any loss arising from any investment based on a recommendation, forecast, or any information supplied by any third party

DJI H4 HTF Pullback and Bearish Continuation Setup📝 Description
CAPITALCOM:US30 on the H4 timeframe is reacting after a strong impulsive bullish leg into premium pricing. Recent price action shows loss of upside momentum and a corrective distribution phase near HTF resistance, suggesting a potential bearish continuation toward lower PD arrays.
________________________________________
📈 Signal / Analysis
Primary Bias: Bearish while price remains below the recent H4 lower high and supply reaction zone
Preferred Setup:
• Entry: 48,514
• Stop Loss: Above 48,640
• TP1: 48,422
• TP2: 48,304
• TP3: 48,062 (HTF draw / deeper liquidity)
________________________________________
🎯 ICT & SMC Notes
• Rejection from HTF premium and structural resistance
• Current move classified as a corrective pullback within a bearish leg
• H4 FVG and OB below act as natural draw targets
________________________________________
🧩 Summary
As long as price fails to reclaim the recent H4 supply zone, the expectation remains a continuation to the downside toward stacked HTF liquidity levels and unmitigated PD arrays.
________________________________________
🌍 Fundamental Notes / Sentiment
Ongoing global policy uncertainty, resurfacing trade-tariff risks, and rising bond yields are tightening financial conditions and weighing on equities. With risk appetite fragile and macro headlines driving volatility, Dow Jones faces downside pressure, and rallies are likely corrective rather than trend-changing.
________________________________________
⚠️ Risk Disclosure
Trading involves substantial risk and may result in capital loss. This analysis is for educational purposes only and does not constitute financial advice. Always apply proper risk management, predefined stop-loss levels, and disciplined position sizing aligned with your trading plan.
