NAS100 Bearish Continuation SetupNAS100 shows a clear transition from bullish expansion into a distribution phase, followed by an impulsive bearish breakdown. Price previously respected an ascending channel, but strong rejection from the premium supply zone signaled institutional selling pressure.
After sweeping internal liquidity near the highs, the index printed a sharp displacement move to the downside, breaking structure and invalidating the bullish trend. This move confirms a market structure shift (MSS) and suggests that smart money has exited long positions.
Currently, NAS100 is trading below a key supply / mitigation zone, where multiple pullbacks have failed. Price action shows weak bullish attempts, indicating that rallies are being sold into rather than accumulated.
The projected path suggests a bearish corrective retracement, followed by continuation toward the higher-timeframe demand zone below. This area aligns with prior accumulation and remains the most probable downside liquidity target.
As long as price remains below the marked supply zone, bearish bias remains dominant. Only a strong reclaim and hold above resistance would invalidate this scenario.
Market Bias:
Short-term: Bearish
Structure: Distribution → Breakdown → Continuation
Key Concept: Supply rejection, liquidity grab, bearish displacement
⚠️ Wait for confirmation on lower timeframes and manage risk accordingly.
Indicestrading

SPX500 H4 Buy Setup Bullish Channel Hold + Order Block RejectionSPX500 – H4 BUY Analysis (Bullish Continuation)
Market Context:
Price is moving within a well-defined bullish channel, keeping the higher-timeframe bias bullish as long as the channel low holds. Previously, price respected an internal bullish Order Block, from which strong bullish displacement was observed, confirming institutional buying interest.
Smart Money Structure:
After the Order Block retest, price delivered a strong bullish reaction, confirming active buyers. A CHOCH (Change of Character) followed, indicating a shift of short-term control to the buyers. This was further validated by a clear BOS (Break of Structure), confirming bullish continuation.
Current Price Action:
Following the BOS, price pulled back into a fresh bullish Order Block. At this zone, a clear rejection is visible, highlighting a high-probability demand area.
Trade Plan – BUY:
Buy from the Order Block rejection zone, with the stop loss placed below the Order Block. The upside target is 7050.0, aligned with the channel upper boundary and previous highs.
Why This Setup Is High Probability:
The bullish channel remains intact, Order Block retest and reaction are confirmed, CHOCH and BOS support trend continuation, price has pulled back into demand, and rejection shows buyers are active.
Invalidation:
If an H4 candle closes below the Order Block, the setup becomes invalid.
Disclaimer
This analysis is for educational purposes only and does not constitute financial advice. Market conditions can change at any time. Always manage risk properly and make trading decisions based on your own analysis and risk tolerance.

Nasdaq — Quiet Start to the Year, But the Structure Is Building.The first month of the year was unusually quiet for the Nasdaq, with price contained inside a tight 1,000-point range, roughly 4% of value.
That calm, however, is starting to fade.
🔎 Signs of Life Since Last Week
Since last week, the index has begun to show clear bullish intent:
- a bullish engulfing candle on Wednesday
- followed by another bullish engulfing yesterday, which pushed price directly into resistance
- This sequence suggests buyers are no longer passive — they are stepping in with intent.
📐 Bigger Picture: A Clean Technical Structure
Looking at the broader context:
After the ATH at the end of October, the correction that followed stopped almost perfectly at the August ATH
From there, price began to compress higher, forming an ascending triangle on the daily chart
This is a textbook continuation pattern:
✔️ rising lows
✔️ flat resistance
✔️ tightening price action
🌍 Macro Noise Didn’t Break the Trend
Despite ongoing geopolitical tensions, the Nasdaq structure remained intact.
In fact, rather than breaking the trend, the volatility reinforced the compression, which often precedes expansion.
🎯 Outlook & Target
With such a clear technical setup and sustained structural strength, it is reasonable to expect:
➡️ a break above resistance
➡️ followed by continuation toward new ATHs
The measured move target for the ascending triangle comes in around:
🎯 27,800
That level could represent a realistic swing target for traders aligned with the trend.
✅ Conclusion
Nasdaq spent a month consolidating
With momentum returning and structure tightening, the market is positioning itself for resolution to the upside.

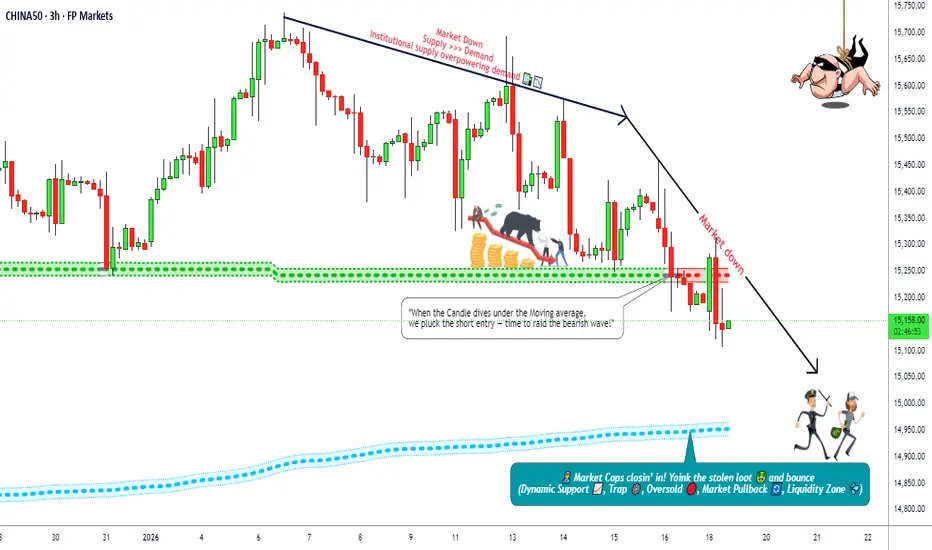
China A50 Market Analysis | Downtrend Confirmation🔥 China A50 (CHINA50) Short Bias Set-up | MA Breakout Confirmed 📉 + Correlation Watchlist + Macro Fuel
📌 DESCRIPTION — Pro Traders + OGs Only 🔓
Market: China A50 Index CFD (Trading Benchmark — top 50 A-shares listed Shanghai & Shenzhen).
Timeframe: Day / Swing Trade
🧠 TRADE STRUCTURE 📊
📉 Bias: Bearish — Confirmed MA Breakout (Price cracked dynamic zone)
🎯 Entry: Any logical price break / retest — flexibility preferred
🛑 Stop Loss:
“Thief SL” @ 15400 — Risk Protect Zone (manage risk, not hope)
📍 Target:
First Profits: ~14950 zone — confluence with dynamic support fade
(Remember: price can overshoot; scale profit taking)
🔥 RISK DISCLOSURE
Dear Ladies & Gentlemen (Thief OG’s) — this is trade guidance only. Set your own SL/TP based on your risk tolerance — not only mine. Trade smart, take profits, protect capital.
📌 PAIRS & CORRELATIONS TO WATCH 👀
Strong / relevant correlations with China equity sentiment:
• USD/CNH — rising USD against CNH usually pressures Chinese equities
• CSI 300 / HSI — if broader China large caps weaken, A50 often follows
• ASX200 / Hang Seng Tech — regional risk appetite bleed confirms gravity
• AUD/JPY / Nikkei 225 — Asia risk proxy; risk-off often means equities slide
Why watch these? Greater macro forces ripple across Asian/China markets and confirm momentum.
📊 FUNDAMENTAL & ECONOMIC CONTEXT (Latest + Upcoming)
🔎 China growth slowing but resilient: GDP forecast ~4.8% in 2026 (slightly below last year) with export strength supporting macro growth.
📈 Tech & ETF flows — institutions increasing exposure, tech earnings gaining momentum — positive undercurrent.
🏙️ Domestic weakness + property drag — ongoing property price declines and weak consumption could weigh on broader sentiment.
📰 Market oversight tightened — regulators vow stricter supervision to curb speculative excess; margin requirements rising.
⏰ Upcoming Macro Drivers:
✔ PMI/services releases
✔ China trade data (exports/imports)
✔ PBOC policy stance — interest rate / RRR actions
✔ US macro (PPI/CPI) impacting China export demand via currency flows
🛠 TECHNICAL EDGE
✔ MA breakout suggests bleeding momentum
✔ Dynamic MA acts as pseudo resistance
✔ Oversold zones + trap signals warrant profit realization
✔ Risk clusters / support confluence near target zone
📌 NEWS IMPACT SUMMARY (London Time)
• China met growth targets despite challenges, but domestic demand remains weak.
• Property sector softness risking broader economic drag.
• Regulatory tightening to curb speculation could pressure markets.
(All news interpreted in London time market context.)
🔔 LESSON IN A LINE
Price respects structure more than direction — trade levels with confirmation, not emotions.
Risk-Off Mode: Indices Under Pressure, VIX Breakout in Play!🌍 Indices Under Pressure as Volatility Spikes – Market Analysis (May 22, 2025) 🚨
My TradingView multi-chart workspace is tracking major global indices alongside the VIX (bottom right). The visual tells the story: broad-based selling is hitting equities, and the VIX is on the rise, signaling a clear risk-off environment.
Key Observations:
Indices in the Red:
All major indices in my workspace are under pressure, with sharp declines across the S&P 500, NASDAQ, Dow, DAX, and others. This aligns with today’s global heatmaps, which are flashing red across sectors and regions. The selling is broad, not just isolated to tech or cyclicals.
VIX Volatility Index Elevated:
The VIX (CBOE Volatility Index) is spiking, up over 15% today and holding above the 20 level (FXEmpire). This “fear gauge” confirms that traders are hedging aggressively and bracing for more turbulence. Historically, a rising VIX alongside falling indices is a classic sign of heightened uncertainty and potential for further downside.
Macro & Geopolitical Backdrop:
The selling pressure is fueled by persistent US-China trade tensions, new tariffs, and a lack of clear central bank support. The White House remains firm on its trade stance, while the Fed is not signaling imminent rate cuts (VT Markets). This policy vacuum is amplifying volatility and risk aversion.
Global Sentiment:
Asian and European markets are also deep in the red, with historic single-day losses in some indices. The “Magnificent Seven” US tech stocks have entered bear market territory, and even traditional safe havens like gold are seeing some liquidation as investors scramble for cash.
What’s Next?
Short-Term Outlook:
With the VIX elevated and indices breaking key support levels, expect continued choppiness and possible further downside. Macro data releases and any shift in trade rhetoric will be key catalysts. Defensive positioning and risk management are crucial in this environment.
Potential for Rebound:
If we see a de-escalation in trade tensions or dovish signals from central banks, a relief rally is possible. But for now, the path of least resistance appears lower, with volatility likely to remain high.
Summary:
The charts don’t lie – indices are under heavy selling pressure, and the VIX is confirming a risk-off mood. Stay nimble, watch for headline risks, and be prepared for more volatility in the days ahead. 📉🟥⚡

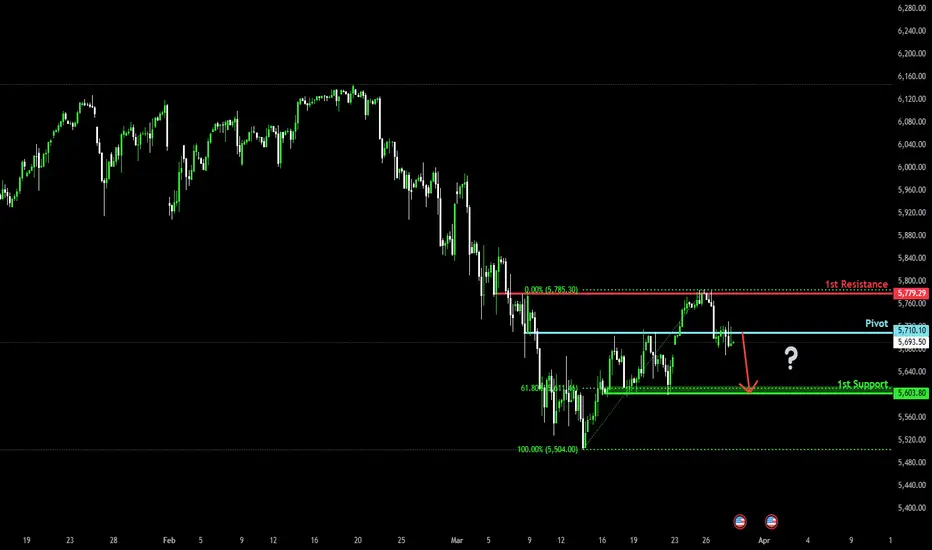
Bearish drop?S&P500 (US500) is reacting off the pivot which acts as a pullback resistance and could drop to the 1st support which has been identified as a pullback support.
Pivot: 5,710.10
1st Support: 5,603.80
1st Resistance: 5,778.29
Risk Warning:
Trading Forex and CFDs carries a high level of risk to your capital and you should only trade with money you can afford to lose. Trading Forex and CFDs may not be suitable for all investors, so please ensure that you fully understand the risks involved and seek independent advice if necessary.
Disclaimer:
The above opinions given constitute general market commentary, and do not constitute the opinion or advice of IC Markets or any form of personal or investment advice.
Any opinions, news, research, analyses, prices, other information, or links to third-party sites contained on this website are provided on an "as-is" basis, are intended only to be informative, is not an advice nor a recommendation, nor research, or a record of our trading prices, or an offer of, or solicitation for a transaction in any financial instrument and thus should not be treated as such. The information provided does not involve any specific investment objectives, financial situation and needs of any specific person who may receive it. Please be aware, that past performance is not a reliable indicator of future performance and/or results. Past Performance or Forward-looking scenarios based upon the reasonable beliefs of the third-party provider are not a guarantee of future performance. Actual results may differ materially from those anticipated in forward-looking or past performance statements. IC Markets makes no representation or warranty and assumes no liability as to the accuracy or completeness of the information provided, nor any loss arising from any investment based on a recommendation, forecast or any information supplied by any third-party.
Nasdaq - Another +50% From Here!Nasdaq ( TVC:NDQ ) just broke out of a major channel:
Click chart above to see the detailed analysis👆🏻
It really seems like the Nasdaq is about to repeat the breakout behaviour of 2020. However, last month the Nasdaq showed some significant signs of weakness and vulnerability. The next couple of months will be very decisive, but the past of least resistance still seems towards the upside.
Levels to watch: $20.000, $25.000, $16.000
Keep your long term vision,
Philip (BasicTrading)

Bearish reversal?S&P500 is rising towards the resistance level which is a pullback resistance and could reverse from this level to our take profit.
Entry: 5,673.69
Why we like it:
There is a pullback resistance level.
Stop loss: 5,738.69
Why we like it:
There is a resistance level at the 127.2% Fibonacci extension.
Take profit: 5,548.54
Why we like it:
There is an overlap support level which aligns with the 38.2% Fibonacci retracement.
Enjoying your TradingView experience? Review us!
Please be advised that the information presented on TradingView is provided to Vantage (‘Vantage Global Limited’, ‘we’) by a third-party provider (‘Everest Fortune Group’). Please be reminded that you are solely responsible for the trading decisions on your account. There is a very high degree of risk involved in trading. Any information and/or content is intended entirely for research, educational and informational purposes only and does not constitute investment or consultation advice or investment strategy. The information is not tailored to the investment needs of any specific person and therefore does not involve a consideration of any of the investment objectives, financial situation or needs of any viewer that may receive it. Kindly also note that past performance is not a reliable indicator of future results. Actual results may differ materially from those anticipated in forward-looking or past performance statements. We assume no liability as to the accuracy or completeness of any of the information and/or content provided herein and the Company cannot be held responsible for any omission, mistake nor for any loss or damage including without limitation to any loss of profit which may arise from reliance on any information supplied by Everest Fortune Group.

S&P500 - Was this already the all time high?SP:SPX is still massively bullish on the smaller timeframes despite retesting strong resistance.
Sometimes trading can be soo simple but yet rewarding. You simply have to buy the S&P500 at support and sell your position at resistance. At the moment, the S&P500 is once again retesting a resistance trendline, which has been pushing price lower for more than 14 years and there is just an extraordinary high chance that we will again see a rejection. Don't say I did't warn you!
Levels to watch: $5.600, $4.800
Keep your long term vision,
Philip - BasicTrading

Nasdaq - (Bullish) Clarity in two days!TVC:NDQ is now retesting a very important inflection level and maybe attempting a breakout.
Parabolic rise or -20% correction over the next couple of months. So far there is a lot of uncertainty as to whether the Nasdaq will manage to break above the current resistance trendline. We simply have to wait for this monthly candle closure as well as the monthly candle closure of July until we can make a clear prediction. So far, everything is still possible!
Levels to watch: $20.000, $16.000
Keep your long term vision,
Philip - BasicTrading

Dow Jones - All time high and 20% rally?Hello Traders and Investors, today I will take a look at the Dow Jones .
--------
Explanation of my video analysis:
For more than a decade, the Dow Jones has been trading in a rising channel formation. We had the first retest of support and resistance back in 2011 and ever since this was a massively profitable channel pattern. With the recent breakout above the $35.000 resistance level, the Dow Jones clearly looks like the next target is once again the upper resistance of the channel.
--------
Keep your long term vision,
Philip (BasicTrading)

Dow Jones - Textbook trading setup!Hello Traders and Investors, today I will take a look at the Dow Jones.
--------
Explanation of my video analysis:
There is one major long term pattern which we have been looking at for a very long time - a rising channel formation. Just a couple of months ago the Dow Jones retested the lower support trendline and created a beautiful triangle breakout while rejecting towards the upside. If we now get a retest of the breakout level which is then acting as support, a major continuation higher is quite likely.
--------
Keep your long term vision,
Philip (BasicTrading)

HK50 / HongKong50 Bullish plan to RobberyOla Chicos,
This is our master plan to Rob HK50 in Bullish side am currently Looting some profits in Hongkong50. Guys U can enter at any time any point before the high voltage electric trap area, Our target is Trap area. We can escape before the area its very safe.

US30: Thoughts and Analysis post-CPIToday's focus: US30
Pattern – Consolidation range
Support – 38,550
Resistance – 39,165
Hi, traders; thanks for tuning in for today's update. Today, we are looking at the US30 daily.
Yesterday's CPI didn't cause any serious moves but did show that inflation remains stubborn. Today, we have run over what we are watching on the US30 and the current main levels that are forming a price pattern.
Will we see a new test and break of resistance, or could we be in for further consolidation?
Good trading.

Nasdaq - Now Is The TimeHello Traders, welcome to today's analysis of Nasdaq.
--------
Explanation of my video analysis:
For more than 10 years the Nasdaq has been trading in an obvious rising channel formation and retested the lower support the last time in 2023. This retest was followed by an expected 65% pump. Considering that Nasdaq is now retesting resistance as mentioned in the analysis, I do expect a short term pullback to retest the next support level below current market price.
--------
I will only take a trade if all the rules of my strategy are satisfied.
Let me know in the comment section below if you have any questions.
Keep your long term vision.

DOW JONES: Still bullish inside the Channel Up.Dow Jones has turned neutral on the 1D technical outlook (RSI = 53.990, MACD = 135.700, ADX = 29.049) as it crossed under the 4H MA50 and is on a lengthy consolidation phase inside the two month Channel Up. The 4h RSI is on a Bearish Divergence, which doesn't mean much unless the 4H MA200 breaks, as the very same divergence emerged during the December - January consolidation. If the 4H MA200 breaks, we will prepare our short under the S1 level and target the top of the S2 zone (TP = 37,200). Until then, the Channel Up favors buying (TP = 39,500).
## If you like our free content follow our profile to get more daily ideas. ##
## Comments and likes are greatly appreciated. ##

NASDAQ: Short term sell initiatedNasdaq is approaching technical neutrality on the 1D timeframe (RSI = 57.511, MACD = 191.510, ADX = 25.356) as it got rejected near the top of a Double Channel Up pattern. The 1D RSI is printing a technical sequence resembling the July 31st 2023 LH, which was the start of a short term correction. Along those lines, we are opening a short, aimed at the 1D MA100 (TP = 16,850).
## If you like our free content follow our profile to get more daily ideas. ##
## Comments and likes are greatly appreciated. ##

DAX: Channel Up keeps it bullish. Strong correction if it breaksDAX is trading inside a Channel Up pattern since October 27th and it has been intact for so long that the 1D timeframe remains overbought (RSI = 78.050, MACD = 373.200, ADX = 82.264). Since it is holding the 4H MA50 over the bottom of the Channel Up, we remain bullish aiming at a +4.66% rise (TP = 17,400), which is the lowest it has registered inside this pattern. If the price crosses under the Channel Up however, we will short aiming near the S1 level (TP = 16,000), which can test the 1D MA50.
## If you like our free content follow our profile to get more daily ideas. ##
## Comments and likes are greatly appreciated. ##

S&P500: Ascending Triangle trading plan.S&P500 is trading inside an Ascending Triangle pattern with the price over the July 27th Top (R1) and bullish on the 4H technical outlook (RSI = 63.128MACD = 5.390, ADX = 23.122). Until the HH and more importantly the R2 level break, we will be bearish, targeting the S1 (TP = 4,550). Below the S1, the 4H MA200 is the target (TP = 4,480). If the price crosses over the R2 level, be ready for an end of year rally to the January 12th 2022 Top (TP = 4,749.50).
## If you like our free content follow our profile to get more daily ideas. ##
## Comments and likes are greatly appreciated. ##

RUSSELL 2000: Short term pullback possible but buy for 1910.Russell 2000 crossed again today overo the 1D MA200 and it remains to be seen if it succeeds at closing above it. After the November 15th crossing but failure to close over it, a repeat may materialize a pullback of at least -4.50%, in similar fashion as the 1D MA200 rejections of May 23rd 2023 and November 1st 2022.
Technically that's possible as on the greater picture, the index is still neutral on the 1W technical outlook (RSI = 50.610, MACD = -19.910, ADX = 34.284) sitting almost halfway of the giant consolidation/ Rectangle pattern of the past year and a half.
Consequently, we will welcome any pullback as a buy opportunity, but we are already bullish, aiming at the R1 level (TP = 1,910).
## If you like our free content follow our profile to get more daily ideas. ##
## Comments and likes are greatly appreciated. ##

DOW JONES showing a Bearish Divergence. Expect correction soon.Dow Jones is extending the rally since the October 27th bottom, which was a HL of the dominant Channel Up pattern. The 1D technical outlook is overbought (RSI = 71.474, MACD = 390.490, ADX = 67.776) but the difference maker on the technical field is the CCI metric. Being also overbought over 100.00, it is showing a Bearish Divergence, which was present on the last three short term corrections since the March 15th Channel Up HL.
Common characteristic on all three was that the High was formed halfway through the CCI Bearish Divergence and the correction that followed always hit the 1D MA50. Consequently, we expect a correction to start as soon as next week, that will target the 1D MA50, before the Christmas rally begins.
Currently the estimated pullback target is at 34,450.
See how our prior idea has worked:
## If you like our free content follow our profile to get more daily ideas. ##
## Comments and likes are greatly appreciated. ##

NASDAQ: Final phase of rise is starting. Santa's rally.Nasdaq has been rising since October 26th and the bottom on the HL trendline of the year long Channel Up. The 1D technical outlook is bullish after turning overbought on Monday (RSI = 68.584, MACD = 265.250, ADX = 67.453). So far its structure is much like the rise at the start of the Channel Up during the whole month of January.
That one peaked on the 1.5 Fibonacci extenstion from the last LH, while the 1D RSI turned flat above the overbought margin and reversed. However the 1.5 Fib made a +20% rise. The November rally is already fractionally over the 1.5 Fib with the RSI also reversed after being overbought but the +20% extension is far from being completed. It will be done at 16,870. Consequently if we don't get a strong rejection by Monday (tomorrow is early close), we will buy any 1D candle closing over the 1.5 Fib and aim at near +20% (TP = 16,850).
## If you like our free content follow our profile to get more daily ideas. ##
## Comments and likes are greatly appreciated. ##

DOW JONES: The top is close. Pullback expected.Dow Jones is unfolding the second rally sequence of the 1 year Channel Up and has reached today the 0.786 Fibonacci level of July's High. The 1D technical outlook is about to turn overbought (RSI = 68.650, MACD = 236.580, ADX = 32.415) and as the rally approaches the R1 level (35,100) as well as being almost on the +9.05% range from the bottom, we are looking towards a late April peak formation and pullback.
The pullback is expected to be at a -2.75% minimum, like June 23rd that reached the 1D MA50. Sell, TP = 34,300.
See how our prior idea has worked:
## If you like our free content follow our profile to get more daily ideas. ##
## Comments and likes are greatly appreciated. ##
