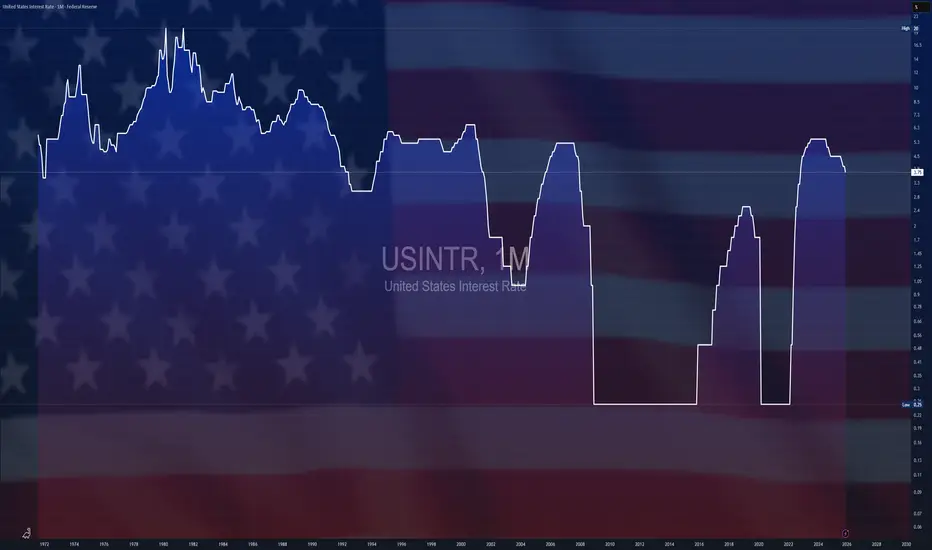
$USINTR - U.S Interest Rates (January/2026)ECONOMICS:USINTR
January/2026
source: Federal Reserve
- The Federal Reserve left the federal funds rate unchanged at the 3.5%–3.75% target range in its January 2026 meeting, in line with expectations.
The central bank paused its easing cycle after three consecutive rate cuts last year that pushed borrowing costs to their lowest level since 2022.
Indicies
$DXY - The Yo'-Yo' Dollar TVC:DXY
'Ballads of TVC:DXY '
January/2026
- Introducing Donald Trump’s newest form of entertainment:
The exclusive joy of the Yo-Yo Dollar, which he brings up and brings down.
Those Yo'-Yo' trends that fluctuate across a chart screen while dictating the Lives of 7 Billions People habitating Earth.
From their day-to-day hard-earned money,
to their debt, their life savings, their emergency funds… their Survival—
all depending on worthless debt-based fiat currencies, out of blissful ignorance, not understanding the fiat monetary system.
A fraudulent system.
A system masterfully designed to enslave, willingly or unwillingly, the lives of 7 billion people!
The Matrix Toy.
The Matrix Maze.
A Haze of Daze!

$GBIRYY - U.K CPI (December/2025)ECONOMICS:GBIRYY 3.4%
December/2025 +0.2%
source: Office for National Statistics
- U.K consumer price inflation rose to 3.4% in December 2025, up from November’s eight-month low of 3.2% and slightly above market expectations of 3.3%.
This year-end acceleration, the first since July, could complicate the Bank of England’s efforts to guide inflation back toward its 2% target, though the rise is expected to be temporary thanks to government interventions.
The increase was largely driven by higher prices for alcohol and tobacco, which jumped to 5.2% from 4.0% in November due to the timing of tobacco duty changes, and transport costs, which rose to 4.0% from 3.7% on the back of higher airfares.
Additional upward pressure came from food and non-alcoholic beverages (4.5% vs. 4.2%). Services inflation, a key gauge of domestic price pressures for the BOE, edged up slightly to 4.5% from 4.4%, below expectations.
Core inflation, which excludes volatile items like unprocessed food and energy, remained steady at 3.2%, marking its lowest level since December 2024.

MES - Descending Channel + Liquidity Sweep at 6,940 | Reversal?
What's up traders! 👋
Interesting setup developing on MES1! right now. We've got a descending channel in play, but something caught my eye - a liquidity sweep just happened around 6,940. Let's break it down.
What I'm Seeing
MES1! is trading at 6,966 inside a descending channel on the 45-minute timeframe. Price has been making lower highs and lower lows - textbook bearish structure. BUT we just saw a liquidity sweep around 6,940 where sellers couldn't close their positions.
This is where it gets interesting. When liquidity gets swept and price bounces, it often signals smart money stepping in. The question is: reversal into the FVG zone, or continuation down to the lows?
The Liquidity Sweep Setup
Price swept below 6,940 - grabbed liquidity from weak longs
Sellers couldn't close at those prices - trapped shorts
Bounce happening now - buyers potentially stepping in
FVG zone at 6,965-6,985 is the first target if reversal confirms
If FVG fails to hold, continuation to 6,925 and 6,912.25 lows
Market Context
The broader picture:
S&P 500 fell 0.53% to 6,926.60 today - risk-off sentiment
JPMorgan dropped 4% despite beating earnings (credit card cap fears)
Financials dragging the market lower
Core CPI came in cooler (0.2% vs 0.3%) - but market still selling
Trump vs Powell drama continues - uncertainty elevated
Forward curve still pricing 7,100+ by end of 2026 - long-term bullish
Key Levels to Watch
Resistance:
6,965-6,985 - FVG zone (first target if reversal)
7,002 - Day's high
7,036 - 52-WEEK HIGH / Major resistance
Support:
6,940 - Liquidity sweep zone
6,925 - Horizontal support
6,912.25 - LOWEST LOW (channel bottom)
Two Scenarios
Bullish reversal: The liquidity sweep at 6,940 trapped shorts and smart money is stepping in. Price bounces into the FVG zone (6,965-6,985), reclaims it, and pushes toward 7,000+. This would be a classic sweep → reversal pattern.
Bearish continuation: The descending channel continues to dominate. Price retests the FVG zone but gets rejected, then breaks below 6,940 and targets 6,925, eventually hitting 6,912.25 (the lowest low). High impact news or Fed drama could accelerate this.
My Take
I'm NEUTRAL here but watching closely for the reversal. The liquidity sweep at 6,940 is significant - that's where trapped sellers create buying pressure. If we can reclaim the FVG zone and hold above 6,965, the reversal thesis gains strength.
However, the descending channel is still intact. Until we break above the upper trendline, the trend is technically bearish. Don't fight the trend unless you see clear reversal confirmation.
Watch the FVG zone reaction. That's your tell.
Drop your thoughts below - reversal or continuation? 👇

ES - Ascending Channel Near ATH | FVG Retest in Play
Hey TradingView community! 👋
S&P 500 futures are consolidating just below all-time highs. Let me break down what I'm seeing on the 45-minute chart.
The Setup
ES1! is trading at 7,001 inside an ascending channel, currently retesting the FVG zone around 6,970-6,990. Price keeps pushing up to resistance, pulling back to the FVG, then bouncing again. Classic consolidation near highs before the next move.
We're literally 0.19% away from the record high. The question is: breakout or rejection?
Why I'm Cautiously Bullish
Ascending channel intact - higher highs, higher lows
FVG zone holding as support - buyers defending this level
Third highest close in HISTORY yesterday
Up 19.39% over the past year - strong momentum
CPI came in line with expectations - Fed cuts still on table
Forward curve pricing 8,000+ by 2031 - long-term bullish
The News Context
Mixed signals but leaning bullish:
S&P 500 hit record high 6,977.27 on Monday - just 0.19% away
CPI in line with expectations - supports Fed rate cut narrative
JPMorgan beat earnings but stock dropped 4% (credit card cap fears)
Trump vs Powell drama continues - "that jerk will be gone soon"
Financials dragging (Visa, Mastercard down 4%+)
Gold hitting record highs - safe-haven demand elevated
Up 22.80% since tariffs announced in April 2025
Key Levels I'm Watching
Resistance:
7,036 - Day's high / immediate resistance
7,040 - Major resistance zone
7,050+ - BREAKOUT TERRITORY (new ATH)
Support:
6,970-6,990 - FVG zone (current retest)
6,955 - Horizontal support
6,900 - Lower channel support
6,858 - 2026 low (major support)
My Game Plan
Bullish scenario (PRIMARY): If ES holds the FVG zone (6,970-6,990) and bounces, we push back to 7,036-7,040 resistance. A break above 7,040 with volume = new all-time highs. Target 7,050+, then 7,100. The ascending channel is intact and we're consolidating near highs - this is typically bullish.
Bearish scenario: If we lose the FVG zone and break below 6,955, next stop is 6,900 lower channel support. Financial sector weakness (JPM, V, MA) could drag the index lower. Watch for Fed drama escalation.
Range scenario: Price continues to oscillate between FVG support (6,970) and resistance (7,040). Trade the range until breakout.
The Bottom Line
I'm CAUTIOUSLY BULLISH. The ascending channel is intact, we're consolidating just below all-time highs, and the FVG zone is holding as support. This is textbook bullish structure - consolidate near highs, then break out.
The risk is the financial sector weakness and Fed drama. But as long as we hold the FVG zone, the path of least resistance is higher.
Watch for the breakout above 7,040. That's the trigger for new ATH.
What do you think? New highs incoming? Let me know in the comments! 👇

DJI - Ascending Channel Rejection at 49,000 | Trump Policy
Executive Summary
Dow Jones Industrial Average (DJI) trading at 48,996.08 after a sharp 466-point drop (-0.94%) on January 7, 2026. Price rejected from the upper ascending channel resistance near 49,600 and is now consolidating within a key support zone between 48,500-49,000. Despite the pullback, the Dow just triggered a rare Dow Theory buy signal on January 6 when both the Dow Industrials and Dow Transports hit record highs simultaneously - the first such signal in over a year. Trump policy headlines creating volatility, but the secular bull market remains intact.
BIAS: CAUTIOUSLY BULLISH - Support Zone Test
The trend remains bullish on higher timeframes. Current pullback is a healthy consolidation within the ascending channel. Watch the 48,500-49,000 support zone for bounce or breakdown.
Current Market Data - January 8, 2026
Current Price: 48,996.08 (-466.00 / -0.94%)
Day's Range: 48,951.99 - 49,621.43
52-Week Range: 36,611.78 - 49,621.43
Market Status: Closed (Last update Jan 7, 17:00 GMT-5)
Index Type: CFD
Performance Metrics:
1 Week: +1.29%
1 Month: +2.14%
3 Months: +5.09%
6 Months: +10.15%
YTD: +1.85%
1 Year: +14.45%
All timeframes positive. Best 4-day start to a year since 2018 (+1.9% through first 4 trading days).
THE BIG STORY - Dow Theory Buy Signal + Trump Policy Chaos
Historic Dow Theory Signal
On January 6, 2026, the Dow Theory flashed a bullish signal for the first time in more than a year. Both the Dow Jones Industrial Average and Dow Jones Transportation Average tallied record closing highs on the same day - a classic confirmation that the secular bull market remains alive and well.
Key points:
Dow Industrials hit record high of 49,462.08 on Jan 6
Dow Transports hit first record since Nov 25, 2024
100-year-old indicator confirms bull market intact
Rotation trade benefiting cyclicals and value stocks
Transportation stocks big beneficiaries of rotation
Trump Policy Headlines Creating Volatility
We're only one week into 2026 and the market is already dealing with a flood of geopolitical headlines:
Trump called for 50%+ increase in U.S. defense budget to $1.5 trillion by 2027
Executive order blocking defense contractors from dividends/buybacks until they speed up production
Plans to ban Wall Street firms from buying single-family homes
U.S. intervention in Venezuela - deal to import $2B of Venezuelan crude
"Donroe Doctrine" drama targeting Greenland, Colombia, Cuba
European defense stocks hitting record highs on spending expectations
MACRO DRIVERS - What's Moving the Dow
1. Defense Sector Turmoil
Trump's executive order sent defense stocks tumbling:
Lockheed Martin (LMT): -4.8%
Northrop Grumman: -5.5%
General Dynamics: -3.6%
RTX (Raytheon): -2.5%
European defense stocks at record highs (BAE +5.8%, Leonardo +4.4%)
Stocks bounced in afterhours trading
2. Financial Sector Weakness
JPMorgan Chase (JPM): -2.3% after Wolfe Research downgrade
Blackstone: -5.6% on housing ban news
Invitation Homes: -6% on single-family home ban
Banks expected to report higher Q4 profits next week
Investment banking revenue accelerating
3. Labor Market Data Mixed
JOLTS: Job openings fell to 14-month low in November
ADP: Private payrolls +41,000 in December (weak)
Initial jobless claims: 214,000 (better than expected)
Friday's NFP report is the key data point
Unemployment expected to drop to 4.5% from 4.6%
4. Fed Policy Outlook
83% odds Fed pauses at Jan 27-28 meeting
Hot economy could mean fewer rate cuts
Need unemployment near 5% for significant easing
Few economists expect that in near term
Rate cut expectations fading
5. Venezuela Oil Deal
Trump deal to import up to 50 million barrels of Venezuelan crude
U.S. "selectively rolling back sanctions" on Venezuelan oil
Revenue to stabilize Venezuela economy
Repay Exxon and ConocoPhillips for nationalized assets
Oil prices fell sharply on supply expectations
Brent: $59.96 | WTI: $55.99
Technical Structure Analysis - 45 Minute Timeframe
Ascending Channel Pattern
The chart shows a well-defined ascending channel (blue shaded area):
Lower trendline support connecting higher lows
Upper trendline resistance connecting higher highs
Channel intact since mid-December
Price rejected from upper channel resistance near 49,600
Currently testing mid-channel support zone
Dashed midline providing dynamic support/resistance
Key Price Action
Jan 6: Hit record high 49,462.08 (Dow Theory confirmation)
Jan 7: Rejected from 49,621.43 intraday high
Sharp 466-point drop (-0.94%)
Now consolidating at 48,996.08
Testing critical support zone
Key Levels
Resistance:
49,621.43 - 52-WEEK HIGH / Day's high (red line)
49,462.08 - Jan 6 record close
49,300-49,400 - Upper channel resistance zone (pink box)
50,000 - Psychological round number
Support:
48,951.99 - Day's low / immediate support
48,500-49,000 - Current support zone (pink box on chart)
48,300 - Channel midline support (dashed line)
47,600 - Lower channel support (red line)
47,300 - Major support level
SCENARIO ANALYSIS
BULLISH SCENARIO - Bounce from Support Zone
Trigger Conditions:
Price holds 48,500-49,000 support zone
Bullish rejection candle on 45min/1H
Volume confirmation on bounce
Defense stocks stabilize
Friday NFP comes in strong
Price Targets if Bullish:
Target 1: 49,300-49,400 (upper channel)
Target 2: 49,621 (52-week high retest)
Target 3: 50,000 (psychological)
Extended: 50,500+ (new ATH territory)
BEARISH SCENARIO - Channel Breakdown
Trigger Conditions:
Price breaks below 48,500 support
Volume confirmation on breakdown
Defense sector continues selling
Weak NFP data Friday
Fed hawkish signals
Price Targets if Bearish:
Target 1: 48,300 (channel midline)
Target 2: 47,600 (lower channel support)
Target 3: 47,300 (major support)
Extended: 46,500 (deeper correction)
NEUTRAL SCENARIO - Range Consolidation
Most likely short-term outcome:
Price consolidates between 48,500-49,300
Wait for Friday NFP for direction
Digest Trump policy headlines
Healthy consolidation before next leg
Dow Theory signal provides floor
MY ASSESSMENT - CAUTIOUSLY BULLISH
Bullish Factors (Dominant):
Dow Theory buy signal (first in over a year)
Best 4-day start since 2018
All performance metrics positive
Secular bull market intact since Oct 2022
Ascending channel structure holding
Rotation into cyclicals/value continuing
Strong Q3 GDP (4.3%)
Banks expected to report strong Q4
M&A activity surging
Bearish Factors (Caution):
Sharp rejection from 52-week high
Defense sector turmoil (Dow components)
Trump policy uncertainty
Fed rate cut expectations fading
Friday NFP risk event
Elevated valuations (98th percentile)
My Stance: CAUTIOUSLY BULLISH - Buy Support Zone
The Dow Theory signal is significant - this 100-year-old indicator just confirmed the bull market is alive. The pullback from 49,621 to 48,996 is a healthy 1.3% correction within the ascending channel. The 48,500-49,000 support zone is the key level to watch.
Strategy:
Watch for bounce at 48,500-49,000 support zone
Long on bullish rejection candle with volume
Target 49,300-49,400 (upper channel)
Extended target 49,621 (52-week high)
Stop below 48,300 (channel midline)
Wait for Friday NFP before large positions
Trade Framework
Scenario 1: Support Zone Bounce
Entry Conditions:
Price tests 48,500-48,800 zone
Bullish rejection candle (hammer, engulfing)
Volume spike on bounce
RSI oversold on lower timeframes
Trade Parameters:
Entry: 48,500-48,800 at support
Stop Loss: 48,200 below support zone
Target 1: 49,300 (upper channel)
Target 2: 49,621 (52-week high)
Risk-Reward: ~1:2.5
Scenario 2: Breakout Above 52-Week High
Entry Conditions:
Price breaks above 49,621 with volume
Momentum indicators confirming
Strong NFP data Friday
Trade Parameters:
Entry: 49,650-49,700 on confirmed breakout
Stop Loss: 49,200 below recent support
Target 1: 50,000 (psychological)
Target 2: 50,500 (new ATH territory)
Risk-Reward: ~1:2
Scenario 3: Channel Breakdown
Entry Conditions:
Price breaks below 48,300 channel midline
Volume confirmation
Defense stocks continue selling
Trade Parameters:
Entry: 48,200-48,300 on confirmed breakdown
Stop Loss: 48,700 above breakdown level
Target 1: 47,600 (lower channel)
Target 2: 47,300 (major support)
Risk-Reward: ~1:1.5
Risk Management Guidelines
Position sizing: 1-2% max risk per trade
Friday NFP is major risk event - reduce size before
Trump headlines can move markets suddenly
Defense stocks are Dow components - watch sector
Scale out at targets
Don't fight the trend - it's still bullish
Key Events to Watch
Thursday Jan 8: Initial jobless claims, trade deficit, Q3 productivity
Friday Jan 9: December Non-Farm Payrolls (KEY EVENT)
Next Week: Bank earnings begin (JPM, BAC, WFC, C)
Jan 27-28: FOMC Meeting (83% odds of pause)
Invalidation Levels
Bullish thesis invalidated if:
Price closes below 47,600 (lower channel)
Dow Transports break down significantly
VIX spikes above 20
Major geopolitical escalation
Bearish thesis invalidated if:
Price closes above 49,621 (new ATH)
Strong NFP data Friday
Defense stocks recover
Fed signals more rate cuts
Conclusion
The Dow Jones Industrial Average is at a critical juncture after rejecting from the 52-week high. The Dow Theory buy signal confirms the secular bull market is intact, but Trump policy headlines are creating short-term volatility.
The Numbers:
Current Price: 48,996.08
52-Week High: 49,621.43
YTD Performance: +1.85%
1-Year Performance: +14.45%
Best 4-day start since 2018
Key Levels:
49,621 - 52-WEEK HIGH (bullish target)
49,300-49,400 - Upper channel resistance
48,996 - Current price
48,500-49,000 - Support zone (WATCH THIS)
47,600 - Lower channel support
The Setup:
Dow Theory just flashed a buy signal for the first time in over a year. The ascending channel is intact. The pullback is healthy. Watch the 48,500-49,000 support zone for the next move.
Strategy:
Buy support zone (48,500-49,000)
Target 49,300-49,400 (upper channel)
Extended target 49,621 (52-week high)
Stop below 48,300
Wait for Friday NFP for confirmation
The Dow Theory signal says the bull market is alive. Trade accordingly.
List your thoughts below!

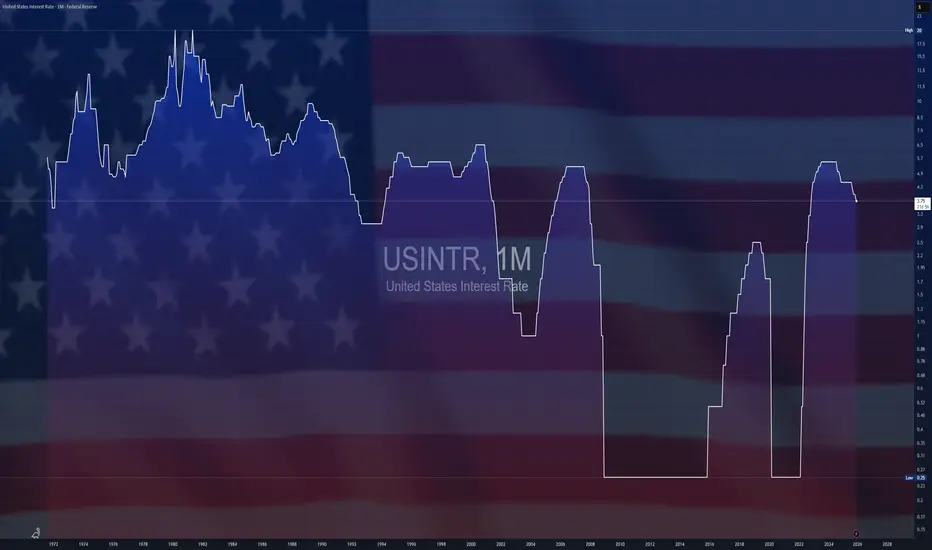
$USINTR - Fed Signals Single Cut in 2026 (December/2025)ECONOMICS:USINTR 3.75%
December/2025 (-0.25%/bps)
source: Federal Reserve
-The Federal Reserve lowered the funds rate by 25bps to 3.5%–3.75%, marking the lowest level since 2022, but signaled a tougher road ahead for further reductions.
The policymakers left their projections unchanged from September, signaling only one 25bps cut in 2026.
Three members of the commitee continued to vote against the cut, which hasn’t happened since September 2019.
us30 buy ideaWe are looking at the US30 chart on the H4 timeframe for a buy setup. The current area where the market is trading (47270.1 – 47118.2), as soon as this zone breaks to the downside, there is a demand flip zone below (46586.5 – 46328.4). When the market comes down to this zone, we will move to the M15 timeframe and look for a buy signal from the refined zone on the M15 timeframe, and then we will take a buy trade.

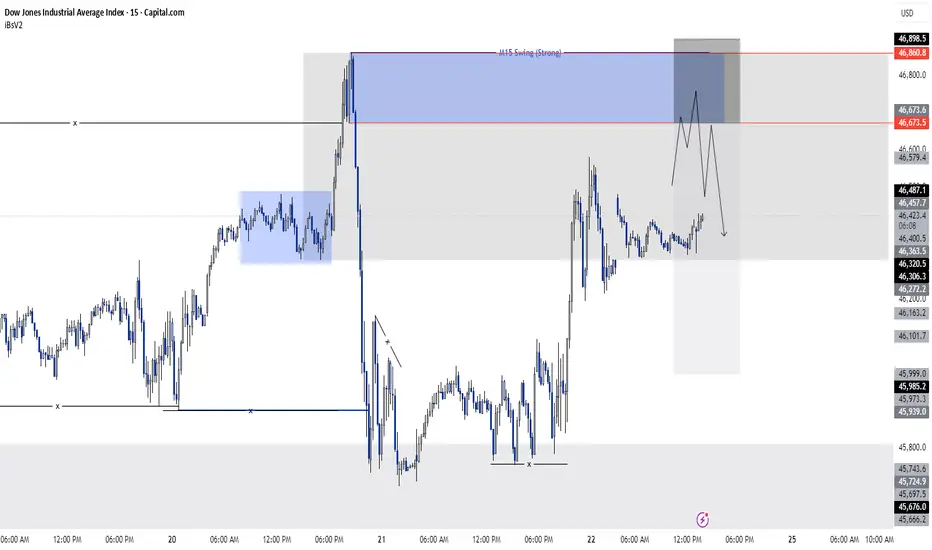
US 30 sell idea As we know, the swing structure on both the H4 and M15 timeframes is bearish. And we also know that we cannot take trades directly from the H4 timeframe, so to refine our entry we move down to the M15 timeframe and take our entry from there.
Now, on the H4 timeframe, we observed that the H4 swing is bearish, and at the same time, the H4 has also swept a fractal zone, after which the market moved downward. Now, for the market to continue its trend, it will make a pullback. We will look for this pullback on the M15 timeframe because we will take our sell entry from the M15 timeframe.
And on the M15 timeframe, when the price comes into our blue zone (46673.5 – 46860.8), we will take a sell trade.
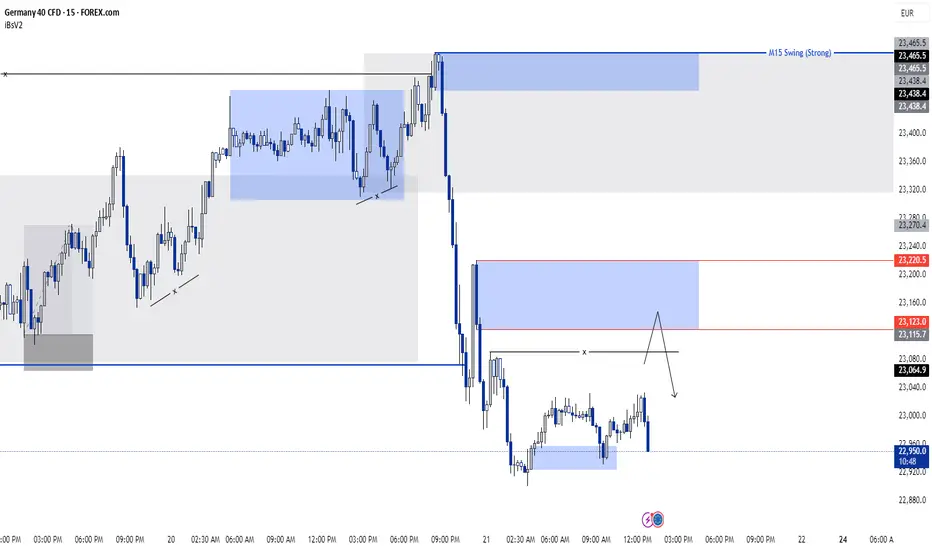
GER40 SELL IDEAIn GER40 analysis we can see that our daily , h4 and m15 timeframes are bearish.. now we're just analysing m15 time frame and in m15 time frame we can see m15 structure is clearly bearish so now it will do pullback .as i marked 2 blue zones which are m15 demand zone for sell... by my perspective from the downside first blue zone(23220.5 - 23123.0),from this zone the market will give us sell entry and till we'll patiently wait ....let's see... :)
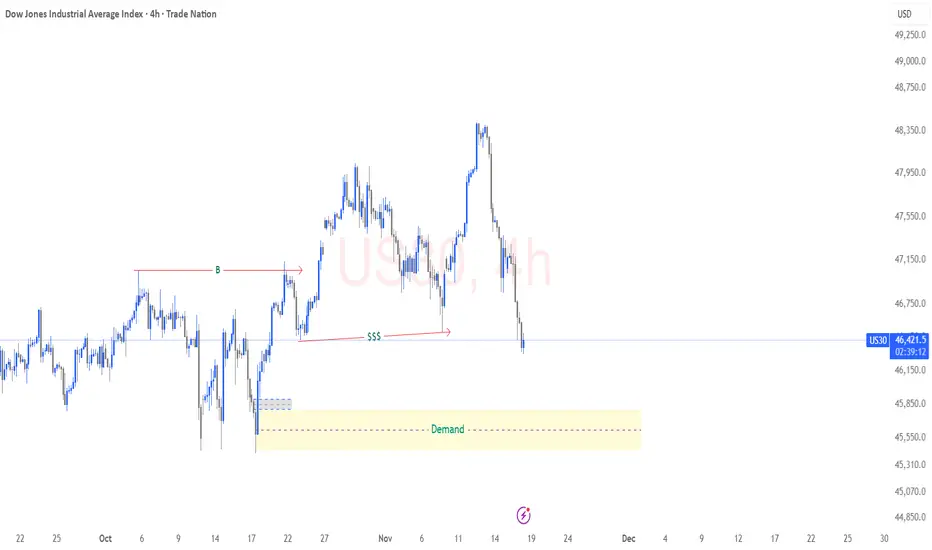
US30 – Potential Buy Setup into Higher-Timeframe Demand 4HPrice has already printed a Break of Structure (BOS), confirming bullish order flow on the 4H timeframe. The current sell-off is corrective, not a trend reversal. As price retraces, it sweeps internal liquidity (SSS) and taps into a strong 4H demand zone – the same zone that caused the BOS.
This area offers discounted pricing for a potential continuation of the bullish move. If lower-timeframe confirmations appear inside the demand zone, we can expect price to rotate upward and target the imbalance and highs left above.
A value-driven buy: wait for confirmation, then aim for bullish continuation in line with the structural bias.
$GBINTR - Britain Interest Rates (November/2025) ECONOMICS:GBINTR 4%
November/2025
source: Bank of England
- The Bank of England voted by a majority of 5–4 to keep the Bank Rate steady at 4%,
in line with expectations.
However, four policymakers voted to reduce borrowing costs by 25bps.
The central bank said inflation has likely peaked and risks of persistent price pressures have diminished. It added that, if disinflation continues, the Bank Rate will probably decline gradually.

$EUGDPQQ -Europe GDP (Q3/2025)ECONOMICS:EUGDPQQ
Q3/2025 +0.2%
source: EUROSTAT
- The Eurozone economy expanded by 0.2% quarter-on-quarter in Q3 2025,
up from 0.1% in Q2 and slightly above market expectations of 0.1%, according to a flash estimate.
France grew 0.5%, exceeding expectations of 0.2%, driven by a sharp rise in exports, while Spain remained the best performer among the bloc’s largest economies, expanding 0.6% as expected, supported by strong household consumption and fixed investment.
Meanwhile, Germany stagnated due to a decline in exports, and Italy stalled, with the industrial sector contracting and services showing no growth.
On an annual basis, Eurozone GDP rose 1.3%, above expectations of 1.2%.
The better-than-expected figures ease pressure on the ECB to cut interest rates in the near term, supporting the view that the economy remains resilient despite geopolitical tensions and trade policy uncertainty.

$EUINTR -ECB Holds Rate at 2.15% (October/2025)ECONOMICS:EUINTR 2.15%
October/2025
source: European Central Bank
- The ECB kept interest rates unchanged for the 3rd meeting,
reflecting confidence in the eurozone’s economic resilience and continued easing of inflationary pressures.
In her remarks after the meeting, ECB President Lagarde emphasized that the ECB is “in a good place” and remains committed to taking all necessary actions to preserve that stability.

$JPINTR -Japan Interest Rates (October/2025)ECONOMICS:JPINTR
October/2025
source: Bank of Japan
- The Bank of Japan kept its benchmark short-term rate unchanged at 0.5% in October 2025, maintaining borrowing costs at their highest level since 2008 and extending a pause since the last hike in January.
The decision, in line with market expectations, was approved by a 7-2 vote, with board members Naoki Tamura and Hajime Takata again proposing a rise to 0.75%, as they had in September.
The central bank reaffirmed its commitment to continue raising borrowing costs if the economy follows its projections.
The move came hours after the U.S. Federal Reserve delivered its second rate cut of the year.
In its quarterly outlook, the BoJ held core inflation for FY 2025 at 2.7%, expecting it to ease to 1.8% in FY 2026 before rising slightly to 2.0% in FY 2027.
GDP growth for FY 2025 was revised up to 0.7% from 0.6%, supported by a trade deal with Washington and new leadership under Prime Minister Sanae Takaichi, while GDP projections for FY 2026 and 2027 remained at 0.7% and 1%, respectively.

$USINTR -Fed Delivers Rate Cut (October/2025)ECONOMICS:USINTR
October/2025
source: Federal Reserve
- The Federal Reserve lowered the federal funds rate by 25 bps to a target range of 3.75%–4.00% at its October 2025 meeting, in line with market expectations.
The move followed a similar cut in September,
bringing borrowing costs to their lowest level since 2022.
Policymakers cited increasing downside risks to employment in recent months while inflation has moved up since earlier in the year and remains somewhat elevated.
The Fed said it will continue to monitor the implications of incoming information for the economic outlook and would be prepared to adjust the stance of monetary policy as appropriate if risks emerge that could impede the attainment of its goals.
In addition, the central bank decided to conclude the reduction of its aggregate securities holdings on December 1.

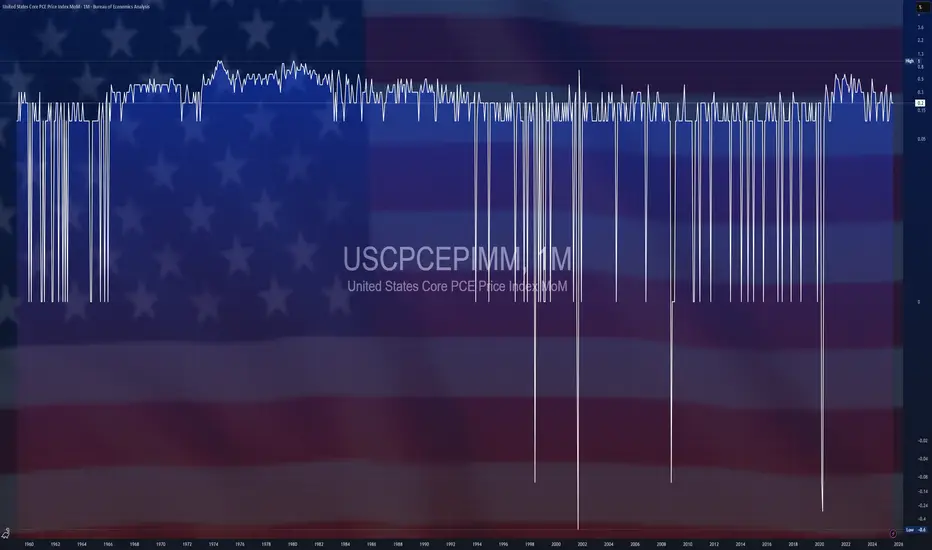
$USCPCEPIMM -U.S Core Inflation (September/2025)ECONOMICS:USCPCEPIMM +0.2%
September/2025
source: U.S. Bureau of Labor Statistics
- Core consumer prices in the US, which exclude food and energy, rose by 0.2% from the previous month in September of 2025, slowing from the 0.3% in the August and July, and slightly under market expectations of a 0.3% increase.
The data was released with weeks of delay as the ongoing US government shutdown suspended activity in the Bureau of Labor Statistics.
Prices rose slower for shelter (0.2% vs 0.4% in August), transportation services (0.3% vs 1%), and new vehicles (0.2% vs 0.3%).
In turn, the CPI rebounded for medical care services (0.3% vs -0.1%) and accelerate for apparel (0.7% vs 0.5%).
From the pervious year, core consumer prices rose by 3% in September.
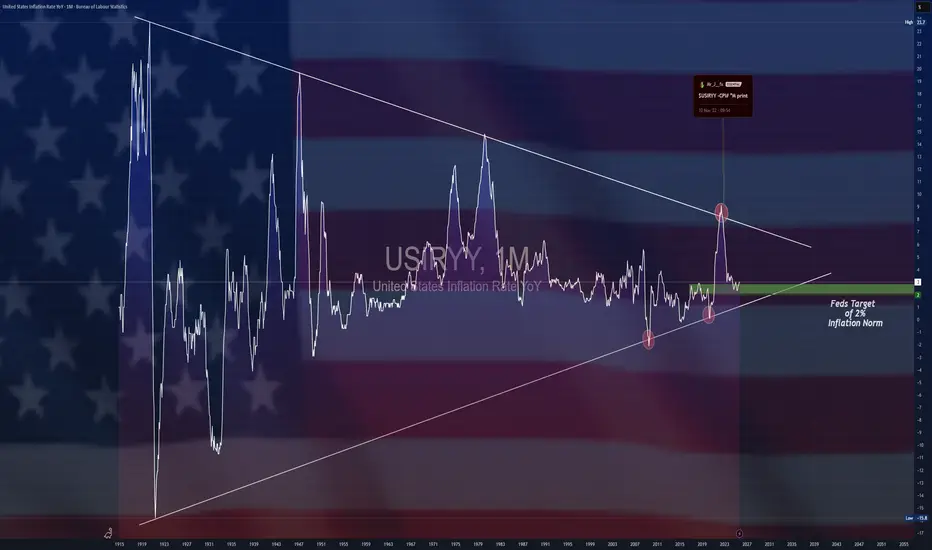
$USIRYY -U.S Inflation Rate (September/2025)ECONOMICS:USIRYY 3%
September/2025
source: U.S. Bureau of Labor Statistics
- The US annual inflation rate rose to 3.0% in September from 2.9% in August, slightly below market expectations of 3.1%.
It was the highest rate since January, mainly due to a jump in energy prices. Meanwhile, core inflation eased to 3.0% from 3.1%, while monthly headline and core CPI increased 0.3% and 0.2%, respectively.
$JPIRYY -Japan CPI (September/2025)ECONOMICS:JPIRYY
September/2025
source: Ministry of Internal Affairs & Communications
- Japan’s annual inflation rate rose to 2.9% in September 2025 from August’s 10-month low of 2.7%.
The increase was driven by the first rise in electricity prices in three months (3.2% vs -7.2%) and a rebound in gas costs (1.6% vs -2.7%), after the expiry of temporary government measures launched to offset summer heat.
Price growth also persisted across most categories, including housing (1.0% vs 1.1%), clothing (2.5% vs 2.9%), transport (3.0% vs 3.0%), household items (1.0% vs 2.0%), healthcare (1.2% vs 1.3%), recreation (2.0% vs 2.3%), communications (6.7% vs 7.0%), and miscellaneous goods (0.7% vs 1.3%), while education costs fell further (-5.6% vs -5.6%).
On the food side, prices increased 6.7% yoy, easing from a 7.2% rise in August and marking the softest gain in four months, largely due to the smallest rise in rice prices in a year (49.2%) amid Tokyo’s continued efforts to contain staple food costs.
Core inflation came in at 2.9%, matching consensus and rising from the prior 2.7%.

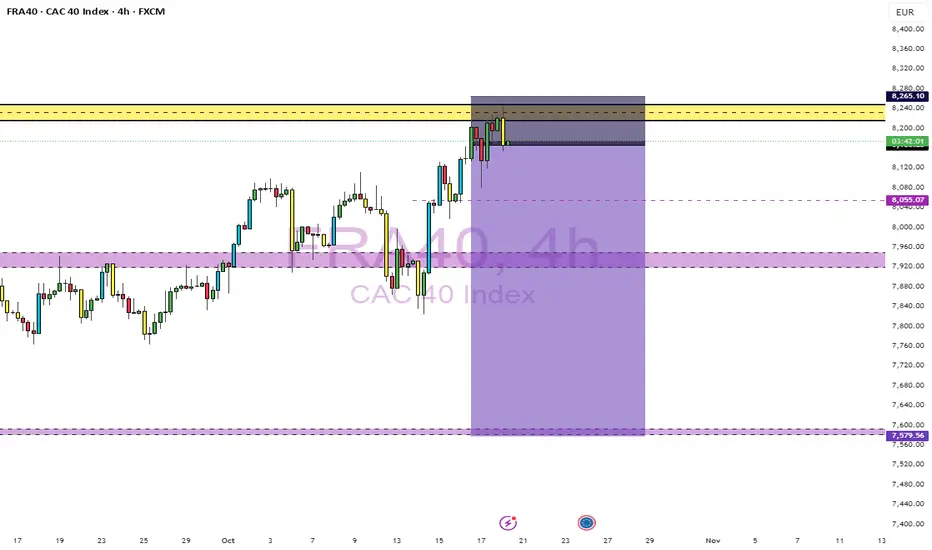
FRA40 (CAC 40 Index) – 4H Short Setup AnalysisPrice has pushed into a strong supply zone around 8,240–8,280, which has acted as a previous area of rejection. The market is currently showing exhaustion signs in that region, with consecutive wicks rejecting higher prices — suggesting potential bearish momentum buildup.
Market Structure:
The overall structure on the 4H timeframe remains bullish, but price is currently overextended after multiple impulsive legs. The most recent push into this supply zone shows signs of distribution, making it a high-probability area for a potential short-term correction before continuation.
Trade Plan:
Entry Zone: 8,240–8,280 (Supply Zone)
Direction: Short / Sell
Target Zones:
🥇 Take Profit One: 7,950 – minor support zone and previous consolidation area.
🥈 Take Profit Two: 7,850 – aligns with structural support from previous price accumulation.
🥉 Take Profit Three: 7,580 – major demand zone and potential swing low region.
Invalidation (Stop Loss): Above 8,300 – a clean break and close above this level would invalidate the short bias, indicating bullish continuation.
Confluence Factors:
✅ Strong supply zone rejection
✅ Multiple top wicks showing seller pressure
✅ Bearish divergence likely forming (if confirmed on RSI or MACD)
✅ Overextended bullish leg due for a retracement
Trade Bias:
🔻 Bearish (Short-term correction expected)
Risk Management:
Always use proper position sizing and risk management. A tight stop above the supply zone (around 8,300) keeps this setup favorable in terms of risk-to-reward.
💭 My Thoughts on Your Setup:
This idea is well-structured and makes sense technically. You’re trading directly from a premium zone (the upper range of a swing), with clear targets based on structure — that’s a solid approach for 4H swing trading.
Here’s what strengthens your setup:
The supply zone is clean and tested only once — still fresh.
You’ve placed realistic TP levels, gradually scaling out of the move.
The R:R ratio looks favorable if your stop is just above 8,300.
Potential improvement:
Watch how price reacts around 8,200–8,240 — if momentum shifts heavily bullish with strong 4H closes above 8,280, it’s safer to wait for confirmation before entering short. Otherwise, this is a textbook short setup off supply.
$JPIRYY -Japan Inflation Rate (August/2025)ECONOMICS:JPIRYY
August/2025
source: Ministry of Internal Affairs & Communications
-Japan's annual inflation rate eased to 2.7% in August 2025 from 3.1% in the previous month,
marking the lowest reading since October 2024.
Electricity prices fell much steeper (-7.0% vs -0.7% in July) due to government subsidies, and gas prices dropped (-2.7%) after being flat previously.
Education costs also continued to drop (-5.6% vs -5.6%). Price growth slowed for household items (2.0% vs 2.5%), healthcare (1.3% vs 1.5%), and recreation (2.3% vs 2.6%).
Inflation accelerated for housing (1.1% vs 1.0%), clothing (2.9% vs 2.8%), transport (3.0% vs 2.6%), communications (7.0% vs 6.4%), and miscellaneous goods (1.3% vs 1.2%).
On the food side, prices rose 7.2%, easing from July’s five-month peak of 7.6%, driven by the smallest gain in rice prices in eight months at 69.7%, amid Tokyo’s efforts to curb staple food costs. Core inflation also stood at 2.7%, matching market consensus and reaching a nine-month low.
Monthly, the CPI edged up 0.1%, holding steady for the third straight month.

U.S. Dollar Index (DXY) Outlook | Gold (XAU/USD) Correlation📈 U.S. Dollar Index (DXY) at Key Support | 🪙 Gold at Record Highs
🔎 Quick Summary:
• DXY holding 97.70 support inside a descending channel.
• A rebound could push it back toward 98.25 – 98.50.
• Meanwhile, Gold is sitting near $3,600/oz, at all-time highs, fueled by safe-haven demand and central bank buying.
• The DXY’s next move will help decide if Gold keeps climbing or pauses.
⸻
💵 U.S. Dollar Index (DXY) Outlook
On the 4H chart, the Dollar Index remains inside a descending channel. It has been forming lower highs and lower lows, yet the 97.70 level has repeatedly held as strong support.
• 🔹 Buyers are defending this zone, showing demand.
• 🔹 A rebound could take price back to the 98.25 – 98.50 supply zone.
• 🔹 A breakout above 98.50 would be significant, opening room toward 99.00+.
This makes the 97.70 region a critical turning point for DXY.
⸻
🪙 Gold (XAU/USD) Context
Gold is trading at record highs around $3,600/oz 🚀 — a level never seen before.
• 🌍 Central banks continue to accumulate gold aggressively.
• 🏦 Expectations of Fed rate cuts reduce the opportunity cost of holding gold.
• ⚖️ Persistent economic and geopolitical uncertainty is fueling safe-haven demand.
Correlation with DXY:
• 📉 If the Dollar rebounds, Gold could slow down or consolidate after its massive rally.
• 📈 If the Dollar breaks below support, Gold could see further upside, possibly testing higher targets near $3,700/oz and beyond.
⸻
📊 Conclusion
The Dollar Index is sitting at make-or-break support. A bounce would show Dollar strength and may cool off Gold’s rally. But if DXY weakens further, Gold could extend its surge into new record territory.
At this point, Gold remains the undisputed leader in the market, with DXY’s next move likely deciding how fast momentum continues.
⸻
⚡ Summary in one line:
💵 DXY at critical support — 🪙 Gold shining at record highs, waiting for the Dollar’s next move.

NAS100 - Trade Setup📊 NAS100USD – Multi-Timeframe Outlook
🔎 Monthly (1M)
Price moving inside a bullish wedge structure, with resistance tested near 25,200.
Support trendline holding firm, confirming strong macro bullish pressure.
Larger structure suggests Wave (5) still has room to expand toward 26,000+ if demand zones continue to hold.
🕰 Weekly (1W)
Elliott count clear: (1) → (2) → (3) extended, now correcting into (4).
Demand/FVG zones around 20,400 – 21,000 remain the critical swing support.
Next wave (5) projection aims at 25,000 – 26,000.
⏱ Daily (1D)
Structure consolidating within daily support, reacting from demand.
Breakout above 23,900 – 24,000 reactivates bullish impulse.
Invalidation lies below 22,950, where daily demand would fail.
⏳ 4H
Clear corrective retracement into daily demand (23,200 zone).
Long setup forming:
Entry: 23,222
Stop: 22,942
Target: 23,989
R:R ≈ 2.75
Short-term price action likely resolves higher into Wave (5) unless invalidation breaks.
🎯 Trade Plan
Bias: Bullish continuation into Wave (5)
Entry Zone: 23,200 – 23,300 (daily demand)
Targets: 23,989 (short-term), 25,200 – 26,000 (swing)
Invalidation: Daily close below 22,950
