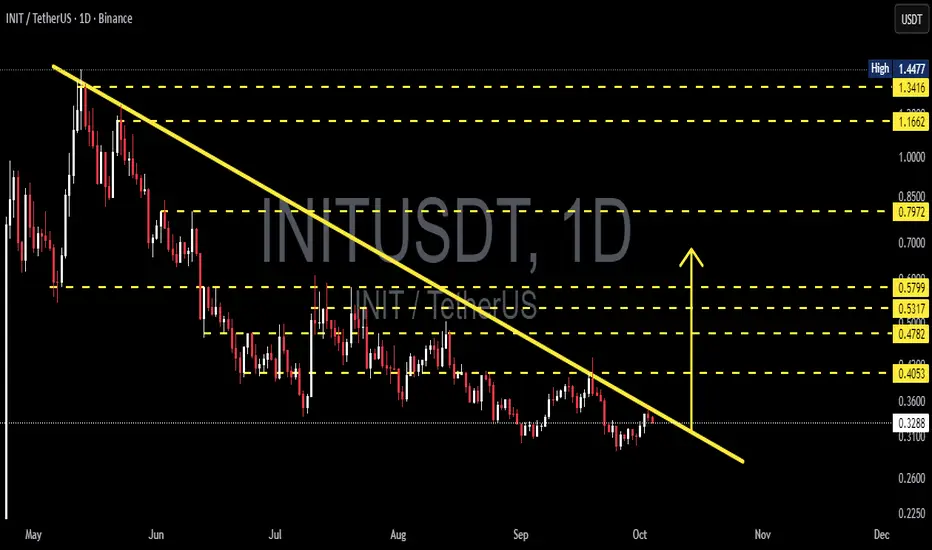
INIT/USDT — Breakout or Continuation of Downtrend?🔎 Chart Analysis
INIT/USDT has been in a clear downtrend since its peak earlier this year. The yellow descending trendline connecting the series of lower highs continues to act as a major dynamic resistance. Current price is trading around $0.3295, right at a critical decision zone.
Key elements on the chart:
Main Trend: Bearish (lower highs & lower lows).
Dynamic Resistance: Descending trendline (yellow).
Horizontal Resistances: $0.4053 – $0.4782 – $0.5317 – $0.5799 – $0.7972 – $1.1662 – $1.3416 – $1.4477.
Nearest Support: Consolidation zone around $0.3000 – $0.3100.
The price is now pressing against the trendline. A decisive move (breakout or rejection) will determine the next major direction.
---
📈 Bullish Scenario
1. Breakout Confirmation: Daily close above the descending trendline is required.
2. Retest Validation: A successful retest of the broken trendline turning into support would strengthen the bullish case.
3. Upside Targets:
First target: $0.4053 (+23%)
Next levels: $0.4782 (+45%), $0.5317, $0.5799
Extended targets: $0.7972, $1.1662, $1.3416, up to $1.4477 if a trend reversal solidifies.
4. Risk Management: Stop loss can be placed slightly below the retest level or below the $0.31 support zone.
---
📉 Bearish Scenario
1. Rejection at Trendline: If price gets rejected at the yellow line, the downtrend remains intact.
2. Breakdown of Support: A daily close below $0.30–$0.31 support zone could trigger a move to new lows.
3. Trading Plan: Aggressive traders may short at trendline rejection with stops above the rejection candle; conservative traders may wait for a breakdown + retest confirmation.
---
📊 Pattern & Structure
The chart highlights a descending trendline pattern, typical of bearish market conditions. However, the longer the price tests this resistance, the higher the chance of a breakout. At this stage, INIT is clearly at a make-or-break level.
---
📝 Conclusion
A confirmed breakout above the trendline could trigger a trend shift to bullish.
A rejection at the trendline confirms further downside pressure.
Horizontal levels act as step-by-step targets/resistances.
Risk management is crucial here due to the high probability of false breakouts.
---
#INITUSDT #INIT #Crypto #Breakout #Downtrend #BullishScenario #BearishScenario #TechnicalAnalysis #SwingTrading
Initial
INIT/USDT — The Big Battle at the Trendline!Is it time for a breakout and reversal, or just another false hope before the downtrend continues?
---
🔎 Overview
INIT/USDT is currently trading around 0.3626 USDT, after a prolonged downtrend since its peak in May. Price has formed a series of lower highs & lower lows, with the yellow descending trendline acting as the main “wall” suppressing every rally.
Interestingly, the market is now approaching a critical test at the trendline. From here, the market will reveal its true intention:
If it breaks above, a major reversal could begin.
If it fails and gets rejected, the downtrend may continue, retesting lower supports.
---
🧩 Pattern Analysis
1. Dominant Descending Trendline
The psychological barrier for sellers since the top.
As long as this trendline holds, the primary trend remains bearish.
2. Local Base / Consolidation
Price has recently formed a local bottom around 0.28–0.32.
This zone serves as the current foundation for potential upside.
3. Key Horizontal Levels (Dashed Lines)
0.4053 → nearest resistance and first “gate” to bullish bias.
0.4782 → next resistance, momentum confirmation.
0.5317 & 0.5799 → mid-term upside targets.
0.7972 → key psychological area if a full reversal unfolds.
---
🚀 Bullish Scenario
Key trigger: Daily close above trendline + 0.4053.
Confirmation: Breakout supported by higher volume + successful retest of trendline as new support.
Upside targets:
0.4782 → +31.9% from current price.
0.5317 → +46.6%.
0.5799 → +59.9%.
Longer-term potential: If momentum builds, price could aim for 0.7972 up to 1.1662.
---
🩸 Bearish Scenario
Rejection at the trendline: Reversal candles here would signal sellers remain in control.
Downside targets:
Retest support at 0.32–0.28.
If this zone breaks, likely move down to historical low at 0.20 (−44.8% from current price).
False breakout risk: A breakout without volume could turn into a bull trap.
---
📌 Strategy & Risk Management
Conservative entry (low risk): Wait for daily close above 0.4053 + retest → enter with staged profit-taking.
Aggressive entry: Buy directly on breakout above trendline with tight stop-loss under recent swing low.
Short plan: Enter on strong rejection at the trendline, with first target near 0.28 support.
Stop-loss: Always place SL based on structure (e.g., under 0.28 for longs, above rejection high for shorts).
Money management: Risk ≤ 1–2% of capital per trade.
---
⚖️ Conclusion
INIT is at a critical juncture.
Breakout above the trendline + 0.4053 = early reversal signal with multi-stage upside potential.
Rejection at trendline = continuation of downtrend toward 0.28–0.20 support.
In this condition, discipline is key: don’t FOMO, wait for confirmation, and stick to strict risk management.
---
#INIT #INITUSDT #CryptoAnalysis #TechnicalAnalysis #Breakout #SupportResistance #Trendline #CryptoTrading #MarketUpdate

INITUSDT at a Crossroads: Bounce or Break Break Down?📊 Comprehensive and Relevant Analysis
On the 12-hour timeframe, the INIT/USDT pair is currently retesting a crucial demand zone between $0.3500 – $0.3685. This zone previously acted as a strong support that triggered a sharp upward move in mid-July.
Now, price is sitting just above the lower edge of that demand box — a critical moment that could dictate the short- to mid-term trend.
---
🐂 Bullish Scenario (Potential Rebound):
Price has tested the $0.35 - $0.3685 zone multiple times and continues to reject further downside.
A micro higher low structure is forming inside the demand zone, indicating that buyers may be regaining control.
If a bounce occurs and price breaks above the minor resistance at $0.4045, the next upside targets are:
$0.4805 – previous consolidation area
$0.5843 to $0.6421 – historical high-volume zones
Confirmation will be stronger if a bullish engulfing, hammer, or volume spike candle forms at this level.
---
🐻 Bearish Scenario (Breakdown of Support):
If price closes convincingly below $0.35, the demand zone will be invalidated.
This could trigger a continuation of the downtrend toward:
$0.3000 – next psychological support
Possibly as low as $0.2650 – the major long-term support
A breakdown will confirm a new lower low structure, validating seller dominance and increasing bearish momentum.
---
📐 Visible Patterns and Structures:
Range Consolidation between $0.35 – $0.48: suggests either accumulation or distribution before a breakout.
Descending Channel on the mid-term structure: indicates a controlled bearish trend.
Potential Double Bottom: if the price bounces and reclaims $0.48, a reversal pattern may play out.
Support Zone Compression: repeated hits to the same support often lead to a break if buyers lose strength.
---
📌 Key Takeaway:
INIT is currently at a decision point. This level is known to precede large directional moves — either a strong bounce or a significant breakdown.
📉 A confirmed breakdown below the demand zone = a strong short setup.
📈 A bullish reaction with volume and reversal signals = a potential buy opportunity.
Traders should wait for confirmation from the next few candles and watch for reaction volume before committing to a position.
#INITUSDT #CryptoAnalysis #DemandZone #BreakoutOrBreakdown #AltcoinWatch #SupportAndResistance #VolumeAnalysis #TechnicalOutlook #PriceActionSetup #CryptoTrend

INIT/USDT Potential Bullish Reversal After Falling Wedge Break📊 Chart Pattern & Structure
Descending Trendline (Yellow Line): From early May to late June, INIT/USDT formed consistent lower highs and lower lows, creating a strong downtrend structure.
Accumulation Phase: In late June, the price consolidated around the $0.40 – $0.48 range, forming a base and is now attempting a breakout above the descending trendline.
Key Horizontal Resistance Levels (Yellow Dashed Lines):
$0.5843
$0.6421
$0.7546
$0.9193
$1.1766
$1.3828
🚀 Bullish Scenario
If INIT confirms a breakout above the descending trendline, it signals a potential trend reversal from bearish to bullish momentum.
📌 Short to Mid-Term Bullish Targets:
1. $0.5843 – Initial resistance.
2. $0.6421 – Previous support/resistance zone.
3. $0.7546 – Strong resistance with historical significance.
4. $0.9193 – $1.1766 – Mid-term upside targets.
5. $1.3828 – $1.4477 – Long-term target and previous high zone.
📈 Bullish Confirmation Signs:
Increased breakout volume.
Successful retest of the trendline as support.
🐻 Bearish Scenario
If the breakout fails and price falls back below the trendline:
⚠️ Possible Downside Risks:
Rejection back to the $0.4200 – $0.4800 range.
If $0.4200 breaks, price may retest deeper support around $0.3500 – $0.3000.
Breakdown below $0.3000 could lead to a move toward $0.2600 (historical demand).
📐 Pattern Analysis
Falling Wedge / Descending Channel: A typical bullish reversal pattern.
The breakout indicates accumulation and potential impulse movement to the upside.
Aligns with the beginning of a new Elliott Wave cycle (Wave 1 formation).
📝 Strategy Summary
Bullish Setup: Look for a pullback to retest the trendline for a potential long entry, targeting resistance levels step by step.
Bearish Setup: Watch out for a false breakout followed by a breakdown back below the trendline.
#INIT #INITUSDT #CryptoBreakout #FallingWedge #AltcoinAnalysis #TrendReversal #TechnicalAnalysis #CryptoTrading #BullishSetup #CryptoSignals #PriceAction

Sessions Future/Past Initial BalanceGood afternoon all,
This video is a trailer to a script that I will soon be publishing.
The script allows you to display:
1. Future days of the week vertical lines.
2. Future session opening vertical lines (plus additional future lines, for if you notice a trend at a certain time).
3. Session boxes, boxes are built using the high and low of a user configurable time.
4. Session Initial Balance or Brinks boxes.
5. Extendable function for the current and previous Initial Balance/Brinks box.
6. User customizable settings: gradient of box background / box outline options.
This indicator will be released in Dec 21, I will release early if the community show interest for early release.
Thank you for your time and support.

Short-term trade // building a new positionStart building position again here, about 10-15% of the intended one. Waiting to dip lower when markets do, otherwise i am expecting a strong buy signal.

Initial Balance Test w/ 10% Volatilty Filter Running a test of Initial Balance based on NY Open, for BFX :BTC/USD with 10% daily atr vola filter. Protected candles noted in both directions. Watching for break above or below 10% levels to gauge intraday market move and direction.
Daily ATR at time of post 1627; cme and 1602; bfx
Appreciate the risk.

An Ethereum Startup Just Vanished After People Invested $374K ICO = Coin backed by a promise ( A Debt)
Cryptocurrency = Coin backed by the energy it took to secure it.
A startup on the Ethereum platform vanished from the internet on Sunday after raising $374,000 USD from investors in an Initial Coin Offering (ICO) fundraiser.
Confido is a startup that pitched itself as a blockchain-based app for making payments and tracking shipments. It sold digital tokens to investors over the Ethereum blockchain in an ICO that ran from November 6 to 8. During the token sale, Confido sold people bespoke digital tokens that represent their investment in exchange for ether, Ethereum’s digital currency.
But on Sunday, the company unceremoniously deleted its Twitter account and took down its website.
A consensus algorithm, like bitcoin's proof of work (the one we hear about most often), does two things: it ensures that the next block in a blockchain is the one and only version of the truth, and it keeps powerful adversaries from derailing the system and successfully forking the chain.
In proof of work, miners compete to add the next block (a set of transactions) in the chain by racing to solve a extremely difficult cryptographic puzzle. The first to solve the puzzle, wins the lottery. As a reward for his or her efforts, the miner receives 12.5 newly minted bitcoins – and a small transaction fee.
Common criticisms include that it requires enormous amounts of computational energy, that it does not scale well (transaction confirmation takes about 10-60 minutes) and that the majority of mining is centralized in areas of the world where electricity is cheap.
Bitcoin creator Satoshi Nakamoto woke us up to the potential of the blockchain, but that doesn't mean we can't keep searching for faster, less centralized and more energy-efficient consensus algorithms like CryptoNight in Monero to carry us into the future.
Cryptoeconomics is about using a collection of cryptographic and economic building blocks in order to build systems that have some desirable informational security properties not just printing a token and expecting people to trust that you will deliver value.
