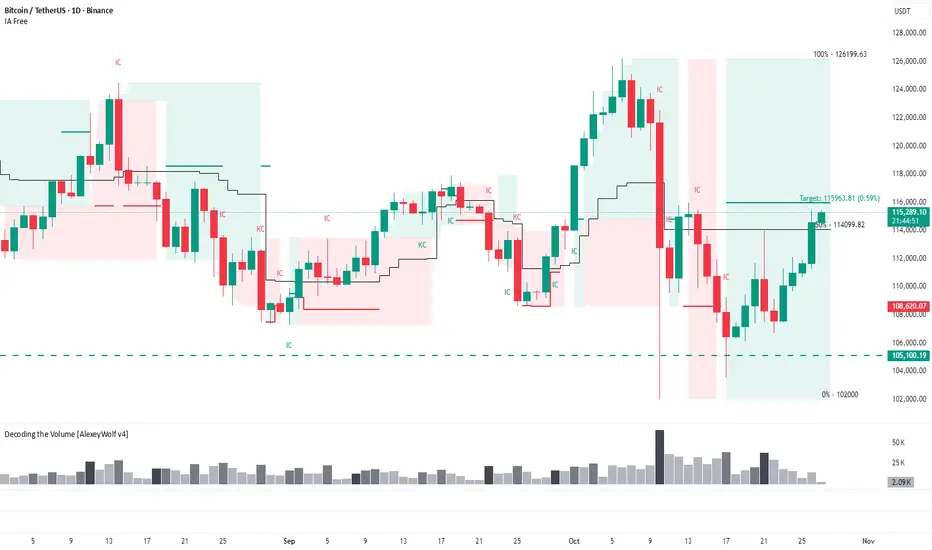
BTC Daily: Sellers react from 115,963The market is in a sideways range with an active seller initiative targeting 103,528.
Hey traders and investors!
This analysis is based on the Initiative Analysis (IA) method.
On the daily timeframe, the market is in a sideways range with an active seller initiative targeting 103,528.
After the rise to 115,963, we see a seller reaction accompanied by increased volume.
Look for buy setups only when the buyer shows strength — so far, that hasn’t happened.
Wishing you profitable trades!
Initiativeanalysis

Gold: A False Breakout Pattern Is FormingThe buyer needs to absorb the attack candle at 4023 to confirm a reversal and open the path toward 4154–4185.
This analysis is based on the Initiative Analysis (IA) concept.
On the 1-hour timeframe, the market is in a sideways range.
Sellers attacked the lower boundary of the range — the 4004 level — with increased volume.
This is the candle with the highest volume inside the seller’s initiative (IC on the chart).
Looking at the daily timeframe, we can see that most of the volume was accumulated below 4004, which looks very much like a false breakout.
A false breakout pattern on the hourly chart will be considered confirmed once the buyer absorbs the seller’s attack candle, meaning the buyer’s candle closes above the high at 4023.
If the buyer manages to absorb the attack candle at the lower boundary of the range,
the next steps to watch are:
whether the price can pass 4050 and the 50% level of the trading range at 4066; be especially cautious around this area, since 4059 is also a daily level where the buyer might face resistance and trigger a short reaction.
and whether the movement stalls near the high of yesterday’s daily candle at 4109.
If these levels are successfully passed, the buyer targets are located at 4154 and 4185.
Wishing you profitable trades!

Gold: Balance of power between buyers and sellersKey levels 4004 and 3944 remain areas of interest for buyers, while sellers aim for 4011
Daily Timeframe
On the daily chart, the buyer initiative remains active.
The price has corrected below the 50% level of the initiative, and accumulation is currently taking place in this zone.
Key levels from the buyers’ perspective are 4004 and 3944,
while from the sellers’ side, the main resistance level is 4185, where we may see their reaction.
1-Hour Timeframe
On the hourly chart, the price has formed a sideways range, and the seller initiative is now active with a target at 4011.
It makes sense to look for long setups from a false breakout of the lower boundary of the range, around 4004.
If buyers defend the 4004 level, potential targets are 4160 and 4185, where seller reactions should be watched.
If buyers fail to hold 4004, then attention should shift to 3944, where another buyer response may appear.
Wishing you profitable trades!

BTC Daily: Time to watch the reactionWatching for the seller’s reaction at the 115,963 level.
Hey traders and investors!
This analysis is based on the Initiative Analysis (IA) concept.
Price is approaching the buyer’s target at 115,963 within an active buyer initiative on the daily timeframe.
The key now is to observe how sellers react at this level — after assessing their response, we’ll decide whether it’s a setup for selling or a continuation of the uptrend.
Wishing you profitable trades!
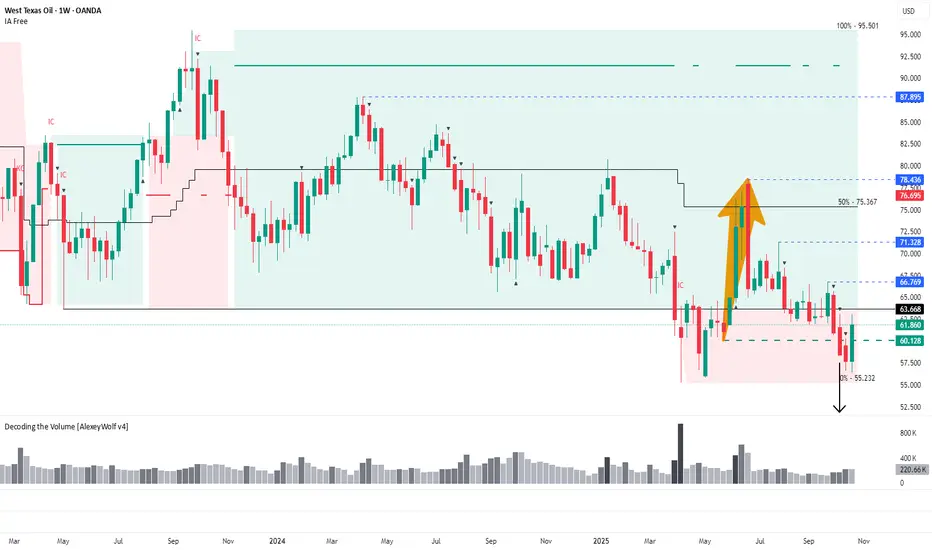
WTI: Possible reversal after false breakout of 60.128Weekly range structure may define oil’s direction for the coming months — buyers defend key support, while targets above 66.769 remain in focus.
Hi traders and investors!
This analysis is based on the Initiative Analysis (IA) concept.
On the weekly timeframe, a sideways range has been in place since April 2023, followed by a transitional phase.
Sellers managed to push the price below the lower boundary of this range — the first breakout occurred in March 2025.
After that, buyers brought the price back inside the range and reached the 50% level of the trading zone, from where sellers resumed control and once again pushed the price below the lower boundary at 63.668.
What’s interesting here is that earlier there was a buyer’s move returning the price into the range, with its base around 60.128.
We now see a seller candle attacking this level on high volume, followed by another seller candle with even higher volume, after which the price returned above 60.128.
This behavior may signal a false breakout (manipulation) of that level.
If this interpretation holds, the next potential upside targets are:
66.769 — first target,
71.328 — second target,
78.436 — third target,
followed by 87.895 and possibly 95.501.
Key points to watch:
whether buyers defend the 60.128 level if the price pulls back,
and whether they manage to break through the range boundary at 63.668, and then 66.769
.
If buyers succeed in holding above these two levels, the buyer’s vector is likely to continue developing toward the mentioned upside targets.
Wishing you profitable trades!
Gold buyers showing signs of activityHi traders and investors!
This analysis is based on the Initiative Analysis (IA) concept.
Daily Timeframe
We can see that volume is starting to appear from the buyer zone located at the base of the last buyer initiative.
Yesterday’s seller activity didn’t bring any visible result — the candle closed inside the previous one.
Still, this leaves hope that there is a buyer active in this area, and we may soon see a move from their side.
1-hour timeframe
On the 1-hour timeframe, a sideways range has formed.
The buyer initiative currently has a target at 4127 — let’s watch how this movement develops.
Inside this initiative, we now have a key seller bar - IC on the chart, which was absorbed by the buyer.
There has already been a first attempt of a rebound from this buyer zone, and it’s currently unfolding. We’ll see how it plays out.
If the first attempt fails, we can look for local long opportunities from the support level around 4065 or 4004.
Wishing you profitable trades!

Double Fakeout on GoldHi traders and investors!
This analysis is based on the Initiative Analysis (IA) concept.
Gold has corrected by 6.5% from its peak and so far shows no signs of recovery.
On the 1-hour timeframe, the market is in a sideways range.
First, there was a false breakout below the lower boundary, and then a false breakout above the upper boundary of the range.
Now the seller has broken through the lower boundary of the sideways range, and the price has dropped below the 50% level of the daily buyer initiative.
At the base of the last buyer initiative on the daily timeframe, there is a buyer zone between 4058 and 3944 — a good area to look for potential trade setups.
Wishing you profitable trades!

Gold: First signs of a correction after a strong rallyHi traders and investors!
This analysis is based on the Initiative Analysis (IA) concept.
For the past nine weeks, gold has been flying upward — and now we’re starting to see signs of a pause in growth or even the beginning of a correction.
Friday’s candle showed very high volume, and this volume came from the seller side.
A similar, though smaller, volume was seen on August 8.
This could indicate that we may enter a correction or sideways phase.
The range of the most recent buyer initiative on the daily timeframe is quite wide.
Yesterday, the price came close to the 50% level of that initiative, but didn’t quite reach it.
The key levels to watch for potential buys are:
50% level of the buyer initiative — 4162,
upper boundary of the previous buyer initiative — 4059.
By the way, on the weekly timeframe, last week’s trading volume was the highest since March 2022.
All these signs point to a possible pause in growth.
Wishing you profitable trades!

Bitcoin: key buyer levels may lie lowerHi traders and investors!
This analysis is based on the Initiative Analysis concept (IA).
Let me remind you that on the weekly timeframe, Bitcoin still hasn’t managed to launch an upward trend after breaking out of the sideways range. The market is currently in a transitional phase, with buyer initiative above and seller initiative below.
Price has already attempted to break upward from the buyer initiative twice — during the weeks of August 11 and September 29. Now, the price has returned back into the range.
We also see declining volumes on the monthly chart, showing that the buyer clearly lacks strength.
At the moment, sellers are facing support around 105,100 — the base of the July 2025 monthly candle. It’s not a bad context for looking for buys, if only the candle had strong volume.
We’ll see how things develop on the daily timeframe. If the price consolidates below 107,255 (the breakout test level on the weekly TF) and then buyers absorb the seller’s candle from October 17, that could create a reason to look for longs.
On the weekly timeframe, there are also interesting levels to watch for potential buys:
— 50% of the trading range — 100,353 (which also aligns with the 50% monthly level);
— the base of the breakout move from the range — 98,200.
Of course, this all depends on whether the buyer actually shows up — with volume and spread.
This 100,500–98,000 zone remains an important buyer defense area if they intend to keep the price from dropping below 90,000.
Wishing you profitable trades!

DXY: Sellers Take ControlHi traders and investors!
This analysis is based on the Initiative Analysis concept (IA).
The US Dollar Index (DXY) formed a sideways range on the daily timeframe at the end of June. The seller’s initiative is now active, with a target at 96.767.
Before that, there was a buyer initiative, and we can see that at the end of it, there was a manipulation around the 98.640 level.
A buyer attack occurred on high volume, but the sellers absorbed the buyer’s attack candle and pushed the price downward on October 15.
The price may return to retest either 98.65 - 98.35 area. However, the main movement on the Dollar Index remains downward.
Wishing you profitable trades!

Ethereum: false breakout confirmed — buyers target higher levelsHi traders and investors!
This analysis is based on the Initiative Analysis concept (IA).
On the daily timeframe, there is a sideways range with boundaries marked by black lines.
The price has returned inside the range. Buyers absorbed the seller’s candle that interacted with the lower boundary on increased volume (see the related post) — a classic false breakout pattern.
Now, with strong daily candles on rising volume, the buyer is pushing toward the upper boundary of the range. The price has already reached 4500, and next I expect 4800, 5000, and eventually 5,600 (see related posts).
Wishing you profitable trades!

EURUSD: 1.1754/1.1820 Resistance — Sell BiasHi traders and investors!
This analysis is based on the Initiative Analysis concept (IA).
On the daily timeframe, a sideways range has formed; the active vector is the seller’s with a target at 1.15278 (see the related post for details).
Buyer recovery starts right from the 50% level. So it was a reasonable spot to take partial profits—e.g., close half the position—if you entered a full-size short on the sell signal.
As for longs, we’re not considering them yet for two reasons:
On the 1H chart the price broke out of the range to the downside and hasn’t returned inside yet; the range boundaries are marked with black lines.
There are strong daily levels that could trigger a strong seller reaction: 1.17540 and 1.18200.
Wishing you profitable trades!

Ethereum. Watching the 3,880–4,060 Zone: Setup for a New ATH?Hi traders and investors!
This analysis is based on the Initiative Analysis concept (IA).
The price has entered the 3,880–4,060 range — the scenario I was waiting for in the related post.
The September 25 seller candle is an IC candle and shows the highest volume since August 22.
And with September — typically a weak month for asset growth — coming to an end, we watch closely.
On the daily timeframe, the price is in a sideways range. The black lines mark the boundaries of this range. We’re waiting for the price to return back inside, absorb the seller’s candle that broke the lower boundary, and then it will be possible to look for buy setups targeting a new local ATH.
Wishing you profitable trades!

Gold Buyers Face ResistanceHi traders and investors!
This analysis is based on the Initiative Analysis concept (IA).
The last daily candle showed strong volume and a long upper wick — indicating that the buyer met resistance from the seller.
Looking at the 1-hour timeframe, the price has formed a sideways range.
It’s better to look for long setups after the buyer defends the lower boundary of this range - 3736.
However, it’s also possible that the price will drop lower — down to the 50% level of the daily buyer initiative, which is 3709.608.
This expectation is based on several factors:
the extended buyer trend on the daily timeframe (a pause might be needed),
signs of seller resistance (as shown by the long upper wick on the last daily candle),
and the fact that the sideways range on the 1H chart has expanded significantly to the upside — ideally, the price would move just as far below the range for balance.
By the way, the 50% level of the daily buyer initiative almost coincides with the level of the last breakout on the daily chart.
Wishing you profitable trades!

EURUSD: 1.19 Hit — Sellers Step In?Hi traders and investors!
This analysis is based on the Initiative Analysis concept (IA).
Buy patterns formed in the 1.1835–1.1830 zone, and then price reached 1.1900, as anticipated in the previous review. Got lucky on this one (see previous post).
Let’s take a closer look—this is an interesting setup.
Weekly chart
The last three buyer bars showed elevated volume but no result — the closes are inside the wicks.
Daily chart
The buyer broke above the initiative’s upper boundary at 1.18299 with a wide-spread, high-volume candle, but the seller pushed price back below 1.18299 and engulfed the buyer’s candle.
A sideways range is likely forming; a seller initiative is projected with a target at 1.15278.
There’s a sell signal on the chart — very interesting.
The Dollar Index, by the way, is turning in a mirror image.
Wishing you profitable trades!

Buyer Initiative Confirmed — Waiting for the PullbackHi traders and investors!
This analysis is based on the Initiative Analysis concept (IA).
Yesterday, silver formed a new buyer initiative, with a new high at 42.972.
Since we don't see clear volume signals on the daily candles that would suggest where a buyer might reappear after a pullback, we’ll rely on the 1-hour timeframe and key daily levels instead.
Ideally, we’d want to see a correction down to the 41.8–41.4 zone. That’s where it would make sense to look for potential buy patterns.
Wishing you profitable trades!

WTI: weekly seller targets reached, monthly targets still lowerHi traders and investors!
This analysis is based on the Initiative Analysis concept (IA).
The sellers have reached the targets mentioned in the previous review (65.628 and 64.378).
What to expect next.
Daily timeframe
On the daily timeframe (D1) for WTI, we see a manipulation of the 65.771 level, which may indicate that the market is moving toward the monthly targets I mentioned earlier — 61.818 and 58.504.
Hourly timeframe
On the hourly timeframe (H1), this manipulation appeared as a false breakout of the upper boundary of a sideways range. The range boundaries are clearly defined: the upper boundary at 65.771 and the lower boundary at 63.580.
Wishing you profitable trades!

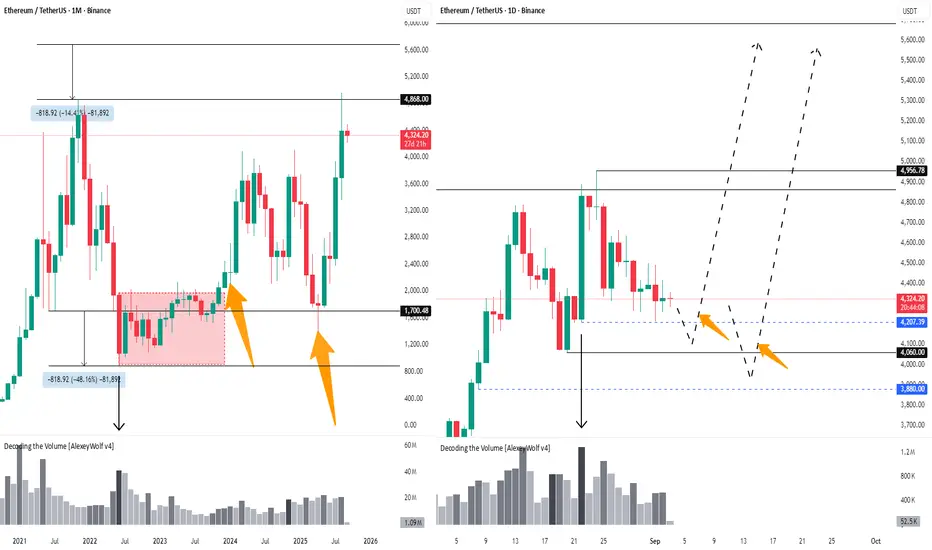
ETHUSDT. Where to Go Long and Where to Take ProfitsHi traders and investors!
This analysis is based on the Initiative Analysis concept (IA).
August has ended, and it’s time to look at the monthly charts. Let’s focus on Ethereum. The price is trading within the 1,700–4,868 range. The August candle touched the upper boundary of this range and we saw a pullback.
If we go back a bit to June 2022, we can see a strong seller candle that broke through the lower boundary of the range on high volume. After that came accumulation, and then the buyer absorbed the seller’s candle. That was the moment when investors could look for long entries with the goal of reaching the upper boundary of the range. The second good entry opportunity for investors came in April–May of this year, when the price retested 1,700.
So, where should we be looking for trades now? Let’s first identify where the price could go. To do this, we measure the price deviation downward from the 1,700 level and project it onto the upper boundary of the price range. I estimate the price could reach around 5,681.
Now it’s important to understand where we can find an entry. For this, let’s look at the daily chart.
On the daily timeframe, the price is also trading within the 4,060–4,956 range. There’s a strong buyer candle with high volume, but so far the buyer hasn’t been able to resume the move from it. That’s why I expect the price might dip below 4,207 and then head toward a new ATH. That’s the first scenario.
The second scenario is a dip below 4,060 into the 3,880–4,060 range, followed by a move to a new ATH. The target of about 5,700 was already defined on the monthly chart.
So, where should you enter? The entry comes after the price, in either of these scenarios, moves back above the broken level.
Wishing you profitable trades!
BTCUSDT. When will the buyer appear?Hi traders and investors!
Went exactly by the March 3 scenario.
Who would’ve guessed… and why didn’t anyone warn me?
Weekly candle with declining volume.
No strong buyer at the bottom of the trading range — no reason to go long.
The price will keep pushing lower and lower until it finally meets a strong buyer.
Wishing you profitable trades!

DXY: False Breakout, Targets BelowHi traders and investors!
This analysis is based on the Initiative Analysis concept (IA).
On the daily timeframe, the Dollar Index is in a sideways range. Upper boundary 98.959, lower boundary 95.906.
We see a familiar false breakout pattern of the upper boundary of the range. The price then returned back into the range with a seller IKC candle (the highest-volume candle within the initiative).
During this false breakout, the price moved above the 50% level of the last seller initiative on the weekly timeframe, which strengthens the pattern.
I am waiting for the first target at 96.66 and the second target at 95.90.
As a reminder, my broader expectation is a move toward 94.6. Indirectly, the likelihood of continued decline in the Dollar Index is supported by the fact that the sideways range has expanded more to the downside than to the upside.
Wishing you profitable trades!

BTCUSDT. Find the differences.Hi traders and investors!
On the left — March 3, 2025.
On the right — August 23, 2025.
Same structure, different time.
👉 What happened after March 3?
Will we see the same outcome now — a pullback all the way to the start of the move — or is the market setting up a different scenario this time?
Wishing you profitable trades!

The weekly, D1 and H1 timeframes all currently favor the sellersHi traders and investors!
This analysis is based on the Initiative Analysis concept (IA).
Weekly timeframe
On the weekly timeframe, we see a buyer’s initiative, but at the same time, the seller absorbed a strong buyer candle — with the highest volume in recent months — and formed a seller zone (marked with a red rectangle). That’s a negative sign for long entries and a potential setup for short entries from the seller’s zone.
Below, the weekly chart shows three important levels: 3268, 3244, and 3201. I expect the price to move down toward 3244, where there is likely more liquidity (possibly with a touch of 3201). That’s where we can start looking for buy patterns.
Daily timeframe
On the daily timeframe, we have a sideways market and a seller’s initiative now, with a target at 3154. The buyer tried to start a move from the buyer zone (blue rectangle), but both candles had declining volume, and the second candle failed to close above the first one. That’s a negative sign for long entries.
Friday’s buyer candle also had low volume and showed no result — That’s a negative sign for long entries too.
With a seller’s initiative in place and no real buying signals, we’re focusing on short opportunities.
Hourly timeframe
On the 1H chart, the price has formed a sideways range with a buyer’s initiative. The lower boundary of this range is at 3331, where we saw price interaction on declining volume — a negative sign for long setups.
I expect price to interact with 3329, after which a buyer move is possible (unlikely, but possible). The target is 3358.
Wishing you profitable trades!

BTCUSDT. Where to look for buys?Hi traders and investors!
This analysis is based on the Initiative Analysis concept (IA).
On the weekly timeframe, there was a sideways range (boundaries marked with black lines) that the buyer broke to the upside, but so far has been unable to extend the initiative further. Sellers are still defending the 123,000 level — we can see this from the volume that appears whenever price touches this zone.
On the weekly chart, there’s also the 114,723 level, where price interacted with a seller candle on declining volume. That’s not a bullish signal for looking at longs and suggests price may move lower. If 114,723 doesn’t hold, we could see a retest of the local low at 111,920.
On the daily timeframe, price has formed a sideways range (boundaries marked with black lines).
The current vector is with the sellers, with a target at 115,736.
We’ll be watching how price reacts at 115,736 and at 114,723 — and whether a strong buyer appears at these levels.
Wishing you profitable trades!
