INIT/USDT — Breakout or Continuation of Downtrend?🔎 Chart Analysis
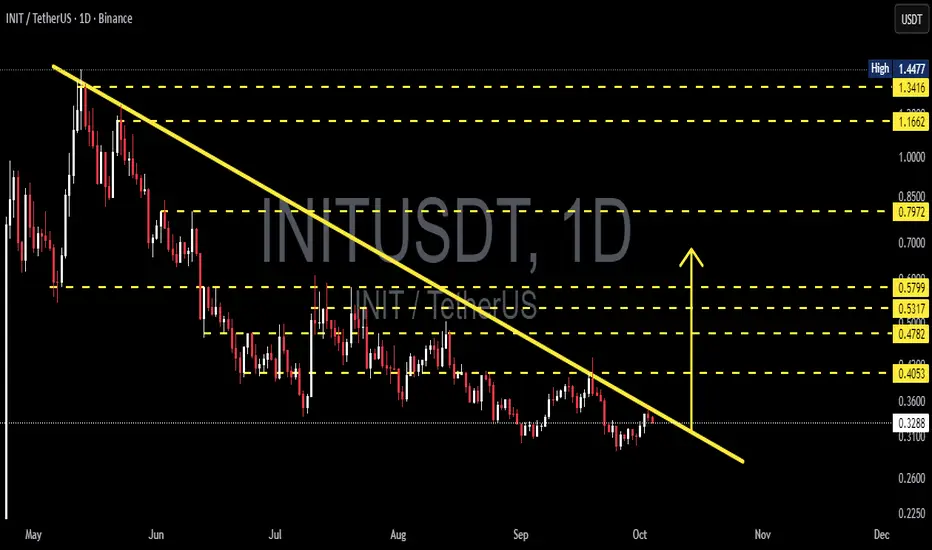
INIT/USDT has been in a clear downtrend since its peak earlier this year. The yellow descending trendline connecting the series of lower highs continues to act as a major dynamic resistance. Current price is trading around $0.3295, right at a critical decision zone.
Key elements on the chart:
Main Trend: Bearish (lower highs & lower lows).
Dynamic Resistance: Descending trendline (yellow).
Horizontal Resistances: $0.4053 – $0.4782 – $0.5317 – $0.5799 – $0.7972 – $1.1662 – $1.3416 – $1.4477.
Nearest Support: Consolidation zone around $0.3000 – $0.3100.
The price is now pressing against the trendline. A decisive move (breakout or rejection) will determine the next major direction.
---
📈 Bullish Scenario
1. Breakout Confirmation: Daily close above the descending trendline is required.
2. Retest Validation: A successful retest of the broken trendline turning into support would strengthen the bullish case.
3. Upside Targets:
First target: $0.4053 (+23%)
Next levels: $0.4782 (+45%), $0.5317, $0.5799
Extended targets: $0.7972, $1.1662, $1.3416, up to $1.4477 if a trend reversal solidifies.
4. Risk Management: Stop loss can be placed slightly below the retest level or below the $0.31 support zone.
---
📉 Bearish Scenario
1. Rejection at Trendline: If price gets rejected at the yellow line, the downtrend remains intact.
2. Breakdown of Support: A daily close below $0.30–$0.31 support zone could trigger a move to new lows.
3. Trading Plan: Aggressive traders may short at trendline rejection with stops above the rejection candle; conservative traders may wait for a breakdown + retest confirmation.
---
📊 Pattern & Structure
The chart highlights a descending trendline pattern, typical of bearish market conditions. However, the longer the price tests this resistance, the higher the chance of a breakout. At this stage, INIT is clearly at a make-or-break level.
---
📝 Conclusion
A confirmed breakout above the trendline could trigger a trend shift to bullish.
A rejection at the trendline confirms further downside pressure.
Horizontal levels act as step-by-step targets/resistances.
Risk management is crucial here due to the high probability of false breakouts.
---
#INITUSDT #INIT #Crypto #Breakout #Downtrend #BullishScenario #BearishScenario #TechnicalAnalysis #SwingTrading
Initusdtlong
INIT/USDT — The Big Battle at the Trendline!Is it time for a breakout and reversal, or just another false hope before the downtrend continues?
---
🔎 Overview
INIT/USDT is currently trading around 0.3626 USDT, after a prolonged downtrend since its peak in May. Price has formed a series of lower highs & lower lows, with the yellow descending trendline acting as the main “wall” suppressing every rally.
Interestingly, the market is now approaching a critical test at the trendline. From here, the market will reveal its true intention:
If it breaks above, a major reversal could begin.
If it fails and gets rejected, the downtrend may continue, retesting lower supports.
---
🧩 Pattern Analysis
1. Dominant Descending Trendline
The psychological barrier for sellers since the top.
As long as this trendline holds, the primary trend remains bearish.
2. Local Base / Consolidation
Price has recently formed a local bottom around 0.28–0.32.
This zone serves as the current foundation for potential upside.
3. Key Horizontal Levels (Dashed Lines)
0.4053 → nearest resistance and first “gate” to bullish bias.
0.4782 → next resistance, momentum confirmation.
0.5317 & 0.5799 → mid-term upside targets.
0.7972 → key psychological area if a full reversal unfolds.
---
🚀 Bullish Scenario
Key trigger: Daily close above trendline + 0.4053.
Confirmation: Breakout supported by higher volume + successful retest of trendline as new support.
Upside targets:
0.4782 → +31.9% from current price.
0.5317 → +46.6%.
0.5799 → +59.9%.
Longer-term potential: If momentum builds, price could aim for 0.7972 up to 1.1662.
---
🩸 Bearish Scenario
Rejection at the trendline: Reversal candles here would signal sellers remain in control.
Downside targets:
Retest support at 0.32–0.28.
If this zone breaks, likely move down to historical low at 0.20 (−44.8% from current price).
False breakout risk: A breakout without volume could turn into a bull trap.
---
📌 Strategy & Risk Management
Conservative entry (low risk): Wait for daily close above 0.4053 + retest → enter with staged profit-taking.
Aggressive entry: Buy directly on breakout above trendline with tight stop-loss under recent swing low.
Short plan: Enter on strong rejection at the trendline, with first target near 0.28 support.
Stop-loss: Always place SL based on structure (e.g., under 0.28 for longs, above rejection high for shorts).
Money management: Risk ≤ 1–2% of capital per trade.
---
⚖️ Conclusion
INIT is at a critical juncture.
Breakout above the trendline + 0.4053 = early reversal signal with multi-stage upside potential.
Rejection at trendline = continuation of downtrend toward 0.28–0.20 support.
In this condition, discipline is key: don’t FOMO, wait for confirmation, and stick to strict risk management.
---
#INIT #INITUSDT #CryptoAnalysis #TechnicalAnalysis #Breakout #SupportResistance #Trendline #CryptoTrading #MarketUpdate

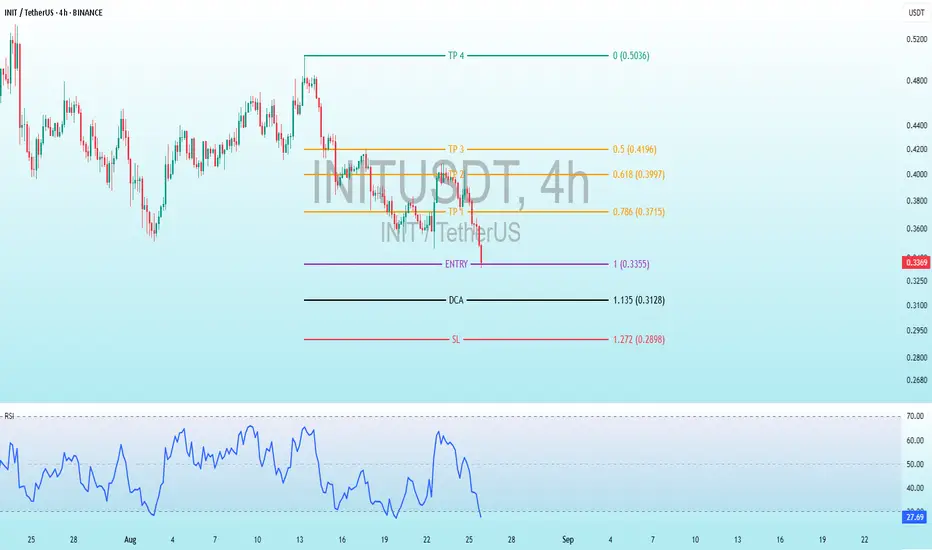
$INIT Epic Dip & Reversal Strategy Revealed!BINANCE:INITUSDT
Entry Level:
Marked at 1 0.3355 - 0.3370 USDT, indicating the intended entry point for a long position.
DCA (Dollar Cost Averaging): Set at 1.35 USDT, suggesting a level to add to the position if the price dips further.
Take Profit (TP) Levels:
TP1: 0.786 (0.3715) USDT
TP2: 0.618 (0.3997) USDT
TP3: 0.5 (0.4196) USDT
TP4: 0.0 (0.5036) USDT
Stop Loss (SL): Set at 1.272 (0.2898) USDT, above the entry to limit potential losses.
The price has recently dropped below the entry level, indicating a potential need to reassess the strategy or wait for a bounce.
Technical Indicators
RSI (Relative Strength Index): The RSI at the bottom shows a decline from around 50 to below 30 (oversold territory) in the recent period. This suggests the price may be oversold and could see a reversal or consolidation soon.