INTEL - Silicon Gold Mine Next 20 YearsINTEL is releasing some new chips specifically designed for crypto mining, continues to release revolutionary chips with government contracted backing.
A sure buy for the next 20 years.
NASDAQ:INTC
MOEX:INTC-RM
BCBA:INTC
MIL:INTC
XETR:INL
BMV:INTC
BMFBOVESPA:ITLC34
SWB:INL
HKEX:4335
BCBA:INTCD
FWB:INL
GLOBALPRIME:INTC.NAS
SIX:INTC
SIX:INTC.USD
NASDAQ:NDX
Intclong

Intel Corporation seems to be undervalued, Long it 20/02/2021 as you can see this ticker has broken its trend line and is rallying
total of 3 TPs,
1 TP is very easy to achieve
if 2 TP triggers, then we can easily expect the 3 TP to be achieved too

INTCDowntrend ended and price is making higher lows. Pushing off from a key level, expected a move to the upside.

INTC: Long (Line 50 years old)Hey!!
Delicious situation with the Intel stock price. In 2008, the resistance line became support. And now, before our very eyes, the price will touch this line again and skyrocket !!
(not advice or recommendation) )))
PS remember about a small stop loss and a large take profit.
I wish everyone a lot of profit!

INTC Gap Down Good Opportunity [LONG]INTC looks good long despite short term setbacks.
Technically this looks a good opportunity for me and my risk tolerance.
Definitely room to the downside for afew DCA entries, but happy at this level.
** NOT TRADING ADVICE **

INTC - STOCKS - 11. OCT. 2021Welcome to our Weekly V2-Trade Setup ( INTC ) !
-
4 HOUR
Great market structure..
DAILY
Looking for more upside price action!
WEEKLY
Expecting a price turnover in most tech stocks..
-
STOCK SETUP
BUY INTC
ENTRY LEVEL @ 53.68
SL @ 53.03
TP @ Open
Max Risk: 0.5% - 1%!
(Remember to add a few pips to all levels - different Brokers!)
Leave us a comment or like to keep our content for free and alive.
Have a great week everyone!
ALAN

INTC Daily TimeframeSNIPER STRATEGY (new version)
It works ALMOST ON ANY CHART.
It produces Weak, Medium and Strong signals based on consisting elements.
NOT ALL TARGETS CAN BE ACHIEVED, let's make that clear.
TARGETS OR ENTRY PRICES ARE STRONG SUPPORT AND RESISTANCE LEVELS.
ENTRY PRICE BLACK COLOR
TARGETS GREEN COLOR
STOP LOSS RED COLOR
DO NOT USE THIS STROTEGY FOR LEVERAGED TRADING.
It will not give you the whole wave like any other strategy out there but it will give you a huge part of the wave.
The BEST TIMEFRAMES for this strategy are Daily, Weekly and Monthly however it can work on any timeframe.
Consider those points and you will have a huge advantage in the market.
There is a lot more about this strategy.
It can predict possible target and also give you almost exact buy or sell time on the spot.
I am developing it even more so stay tuned and start to follow me for more signals and forecasts.
START BELIEVING AND GOOD LUCK
HADIMOZAYAN

INTEL Daily TimeframeSNIPER STRATEGY
This magical strategy works like a clock on almost any charts
Although I have to say it can’t predict pullbacks, so I do not suggest this strategy for leverage trading.
It will not give you the whole wave like any other strategy out there but it will give you huge part of the wave.
The best timeframe for this strategy is Daily, Weekly and Monthly however it can work any timeframe above three minutes.
Start believing in this strategy because it will reward believers with huge profit.
There is a lot more about this strategy.
It can predict and also it can give you almost exact buy or sell time on the spot.
I am developing it even more so stay tuned and start to follow me for more signals and forecasts.


INTC - GREAT Buy Opportunity, IF ... !!!Hello! Friends,
-This would be a great Buy Opportunity, IF NASDAQ:INTC breaks up the Daily Resistance line at $56.51 (with a WHOLE DAILY Candle) !!

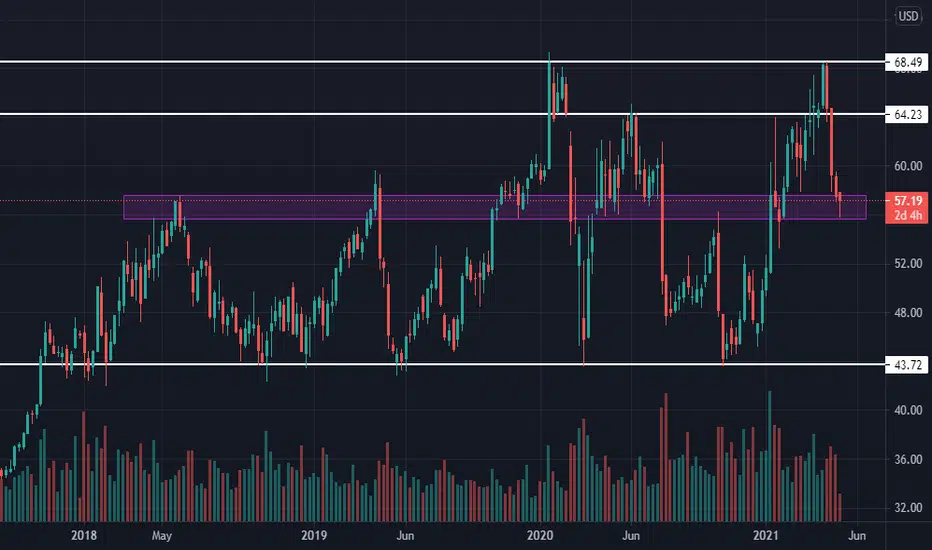
LONG INTC DAILY/WEEKLYINTC is going sideways since 2018.
INTC reaching a nice support zone
With the recent downturn in tech stocks, INTC may poise for a short term rebound.
Things to take note for downside risk:
1) This support zone is in the middle of the bigger sideway zone. so chances of winning 50:50. but it's a good time to collect some should there be a short term rebound and perhaps breaking new high due to increased demand in the global recovery. Otherwise, this trade could become a long term trade
2) May anormaly: Sell in May and go away
EP: now ($57.19) or within support zone.
TP: $64.23 or $68.49
No stop loss: enter again when prices hit around $43.72 and ride the sideways market.
Intel (INTC) Option PlayPurchased OTM Call Option on 2/3
Premium $53
Strike Price 59.5
Expiration Date 2/12

INTC -- iron condor over againI like doing iron condors on Intel all the time and consistently just keep rolling them out. Never a huge risk play with Intel in my opinion with smaller spreads but always adds a little daily theta to my portfolio.
I don't do a lot, really none at all, Elliot wave counts with Intel. Recently, I just draw supply and demand zones and trade the range.
My play: will look to enter an iron condor tomorrow, looking to sell the $57.50 strike call to upside (buy 60) and sell the 47.5 strike put to downside (buy the 45). Simply approach play and not throwing a lot at it. Something to balance out portfolio a bit and grab some daily theta. Earnings are approaching, however, but will still look to enter this play.

WHY INTEL $INTC is bullishINTEL CORP. ticker symbol INTC
- On the monthly timeframe, a clear bullish Harami candlestick pattern shows that buyers are taking control.
- Intel compared with its competitors has the highest annual earnings(Revenue) at $17B, while AMD $6B & NVIDIA $11B.
- Intel has the strongest balance sheet between its competitors.
- FROM MY POINT OF VIEW Intel YTD is -17% which is a good indication to long this stock while (AMD is +88.70%), (INViDIA +121%)
- INTEL intrinsic value DCF earnings based is $82 price now is trading at $49 (Undervalued)
- And my favorite INTEL pays 2.65% Dividend yield.

Really good entry for INTC BULLSWe can set 2 entrys to this strat, 1ST now ($45.21) assuming price will fully respect the long-term support and 2ND entry with the old min trying a duble floor.
SL 1ST Entry: $42.83
SL 2ND Entry: $41.94
OBJ: Old Max $65.11
Long Term Invest


Great Buy on Intel. Here is the setup.Td9 on the daily, previous horizontal support, fibonacci calculator setup, megalodon momentum and volume setups, and insider buying. Seems to be the time to accumulate.

Intel headed towards $60 per share.Intel and AMD are basically only two good CPU manufacturers and they have no real competition, although I favor AMD, I am bullish on both these companies.
I look to buy the break of $53 per share and take profit below $60 per share, overall almost 12% profit.
Good luck with this trade!
Tibor

Options Idea: Buy The Jan. 21, 2022 INTC 40.0 Call @ $13.90Intel just gapped down after its last earnings release as margins tightened from almost 60% last year to 53.3%. Trouble lies ahead as well since Intel’s 7-nanometer manufacturing is delayed which will give AMD a 6 month head start to eat away at Intel’s market share. Intel has responded by initiating a huge $10 billion stock repurchase program. This is in addition to the Oct 2019 repurchase program already in place, bring total repurchases to around $20 billion.
Even though Intel is in trouble, we think there’s an opportunity for a longer-term play. Observe the historic Price/Sales ratio for Intel in the weekly view. We are buying today at 2.75. We’ve marked entries over the last few years at the 2.75 PS level. Every entry would have been successful over a 1 year holding period. The 50 week average on the PS ratio for Intel is 3.32.
Nevertheless, we like to reduce risk with options, so we are not going long in Intel. We are buying a deep in the money LEAP call on Intel today at $13.90, which gives us unlimited profit potential above $53.90 and limits our losses below $40.
Since this is such a long term LEAP call, we have 16 months (or 72 weeks) to sell monthly or weekly calls against this position. So while our current breakeven point is $53.90, we intend to lower our cost basis through the sale of out of the money shorter term calls.
This is strategy is called the poor man’s covered call. The important point is that with a $53.90 breakeven, the lowest priced call we can sell is $54. If we sell a lower priced call and INTC were to rise too quickly, the trade could lose money.
Selling next month or next week 15 delta out of the money calls should produce more than enough income to compensate us for the loss of dividends on this position and reduce our breakeven to $51, which is where Intel was trading today when we opened our long position.
Our objectives for short call income generation against this position are as follows:
Initial Objective: $2.90 (Extrinsic Option Premium), reduces breakeven point to $51
Secondary Objective: $4.55 (5 Quarters Dividends on 100 shares)
Stretch Objective: $13.90 (100% of capital recovered)
If we complete our initial objective we’ll have recovered our extrinsic option premium, giving us the benefit of going long in INTC at no additional cost. If we complete the secondary objective we’ll have not only recovered the option premium, but also generated 5 quarters of INTC’s $0.33 dividend, making our position equal to a long position in INTC, but at 20% of the capital outlay. And our final stretch objective is to recover $13.90 over the life of this call, recovering our capital early.
Standard Exit : We exit the trade for a profit when the PS ratio on INTC approaches 4.
Early Exit : We exit the trade for a profit as soon as INTC has recovered the 50-week moving average.
20-INTC-03
Opening Date: Sep 1, 2020
Expiration Date: January 21, 2022
DTE: 507
IV: 35.81%
IV Percentile: 69%
Odds of Winning: 32.60% (before selling short calls)
Odds of Losing: 67.40% (before selling short calls)
Win: > 53.90 @ Expiration (before selling short calls)
Loss: < 53.90 @ Expiration (before selling short calls)
Reg-T Margin: $0 (long position, uses $1390 cash)
Chart Legend
Green Area: 100% Win Zone. If we finish above or in the green area, we’ve made a profit on our call. This is a long call, so our potential gain is unlimited.
Red Area: If we finish in this area we have a loss. The size of the red area is the size of our maximum loss. Since we’ve bought a call instead of gone long, we have no additional losses below $40.
1 standard deviation, 2 standard deviation, 3 standard deviation projections from Opening Date to Expiration Date are included.
Follow us here on TradingView to get updates as we adjust this trade with the short calls we will be selling against this position.

Intel Corp Long$INTC is at a 10 year monthly support and looks and ready to reverse now, minimum targets of $65+ on this.
Long Entry: $49.50
Stop Loss: $44.50
Price Target: $65
Option Play Idea
$INTC Jan15, 2021 $55c @ $1.80 targeting $10+ for this option play

INTC: Potential Long Term Buy SetupCurrently Intel stock (INTC) is ranging within the demand zone. I will long INTC in two steps:
Entry 1: At current price ($48 to $50 range).
Entry 2: At $42 to $43 range.
Target: $70 (Psychological level).

Blow up soon Still keeping eye on this stock. You can take a look at the chart, lower trendline indicates that buyers are more aggressive than sellers. In a perfect world, you want it to break and close above $50 prior to entry. A longer expiration is recommended if you decided to enter. Good luck :)

Intel Corp UpsideWe can see INTC well supported again at a 47.80 region.
Both RSI and MACD are showing positive upward movement in the price.
Immediate resistance level to watch
49.72
52.18
55.00
