Holding Breath for FOMC News - Will History Repeat?XAUUSD Trading Idea Today (FOMC - Big News)
Will history repeat:
Before the news: Sideway | News release: prioritize SELL
Today's range: 417X–423X
Expectation: FOMC release leads to selling (Powell is usually hawkish → price drops like in September & October)
1) Intraday Trading (catching the Sideway range)
Upper range:
4218–4220
4230–4233
Lower range:
4170–4173
4180–4182
→ Morning & afternoon prioritize catching the range – trade within the range for safety before the news.
2) During the news (for those who trade the news)
Not suitable for those who are risk-averse, so you can skip if you can't handle it. Limit if you want to learn and profit using a very small account.
1) 4218–4220 (Risk-only) (if it doesn't break all day)
• High reaction area
• Safe → skip
• Risk → Probe sell, small SL
2) 4230–4233 (Main Sell)
• Strong resistance within the range
3) 4240–4244–424X (Best Sell)
• Liquidity zone
• If spike during/before news → High RR sell
3) Target down
TP1: 418X
TP2: 416X-5x
TP3: 409X (main target – swing + FVG + fibo)
4) BUY?
Attention area:
4150-52
4128-32
4102-96
5) Note on the news
This scenario holds if Powell maintains a hawkish tone.
If Powell is more "dovish" → it may go against expectations.
Risk-averse traders → do not trade the news.
News traders → use a small account to test market reactions.
Quick Summary
Before the news → Sideway, catch the range 417X–423X
News release → prioritize SELL
SELL zone: 4218, 4230–4233, 4240–4244
Main target: 409X
The price will move with each statement from the Fed Chairman and keep an eye on Trump too.
Wishing everyone a victorious day.
Intradaytrader

Will gold stay sideways before the rate announcement?WILL GOLD CONTINUE TO SIDEWAY BEFORE INTEREST RATE ANNOUNCEMENT? WHAT DO YOU THINK
2 projected scenarios THIS WEEK.
Scenario 1 – Gold moves sideways below 4,200 until close to FOMC
If the price stubbornly stays below 4,200, unable to break through → when FOMC erupts, there's a high chance gold will break through 4,200.
Target falls to: 4,000 – 4,050 → this is the beautiful zone to Buy swing
The nearest zone 409x might have a reaction, pay attention (this zone is for today before fedfundrate)
Scenario 2 – Early week gold strengthens back to 4,200
If early in the week gold recovers well, touching 4,200 → FOMC at this time will become a push to propel gold back up.
Near target: 4,360, returning to test the previous peak.
THE MOST IMPORTANT FACTOR: FED'S TONE.
A 0.25% reduction is almost certain.
But the story lies in what Powell will say.
If Powell is HAWKISH like:
“Only reducing this time, economy is strong, not considering QE yet…”
→ This is strong bad news for gold and the entire asset market.
Gold drops, coins drop, stocks drop...
If the FED softens a bit:
Just a little dovish → gold will bounce extremely fast, no time to react.
In summary for this week
Gold is compressing very strongly around 4,200
FOMC will decide the direction
Major volatility will definitely appear
Just wait for the price to react before taking action — follow the strategy, follow the discipline.
Trade well, everyone.

XAUUSD H1 – Liquidity Sweep & Smart Reentry ZoneAfter a strong impulsive rally, gold reached the premium zone (1.5–1.618 extension) and created a set of Equal Highs (BSL) — a clear liquidity pool above 4148.
I’m anticipating a short-term retracement before continuation, as smart money often rebalances after grabbing liquidity.
🔹 Technical Breakdown (SMC Flow)
Sell Zone (Supply / OB): 4224 – 4228 (SL 4235)
→ Price reached the extreme of a premium H1 OB, aligning with FIB 1.5–1.618.
→ This area remains a valid sell-to-buy reaction zone if M15 shows a CHoCH.
Buy Zone (Demand / OB): 4086 – 4082 (SL 4070)
→ Confluence with 0.5–0.618 retracement and previous structure base.
→ Expecting sell-side liquidity sweep into this zone before a bullish continuation.
Target Zone: 4158 – 4160
→ The next Buy-Side Liquidity (BSL) resting above Equal Highs.
→ Ideal take-profit area for intraday longs from discount levels.
📈 My View
The bias remains bullish on H1, as long as 4070 holds.
I’ll patiently wait for a liquidity sweep into BUY zone followed by a clear M15 CHoCH confirmation — that’s where I’ll look for entries toward 4158–4160.
💭 Note from Karina
This structure perfectly reflects how liquidity drives movement — not emotion, not indicators.
Patience and precision are the true edge of a trader.
This is my personal view based on SMC principles – not financial advice.
Like & Follow for daily London session updates 💛

XRP Intraday long IdeaJournal Entry #8
The chart has shown a bullish divergence and currently at its breakup/down point.
im looking for opportunities to long :)
hello UPtober?

XAU/USD Intraday Plan | Support & Resistance to WatchGold tested the $3,753 support during the Asian session and is currently trading around $3,775, holding just below the $3,782 resistance. A clean break above $3,782 would open the way to $3,796 and the major resistance at $3,806. Failure to break and hold above $3,782 could send price back towards $3,768–$3,753 and potentially deeper into $3,728. The moving averages may provide dynamic support on the way down.
📌Key levels to watch:
Resistance:
$3,782
$3,796
$3,806
Support:
$3,768
$3,753
$3,728
$3,712
🔎 Fundamental Focus – Wed, Sep 24
Yesterday, Powell signalled caution, stressing that rate decisions remain data-dependent — keeping gold supported but vulnerable to swings.
Today’s drivers:
🔶Trump speaks
🔶New Home Sales
Expect sharp swings and volatility spikes. Manage risk carefully.

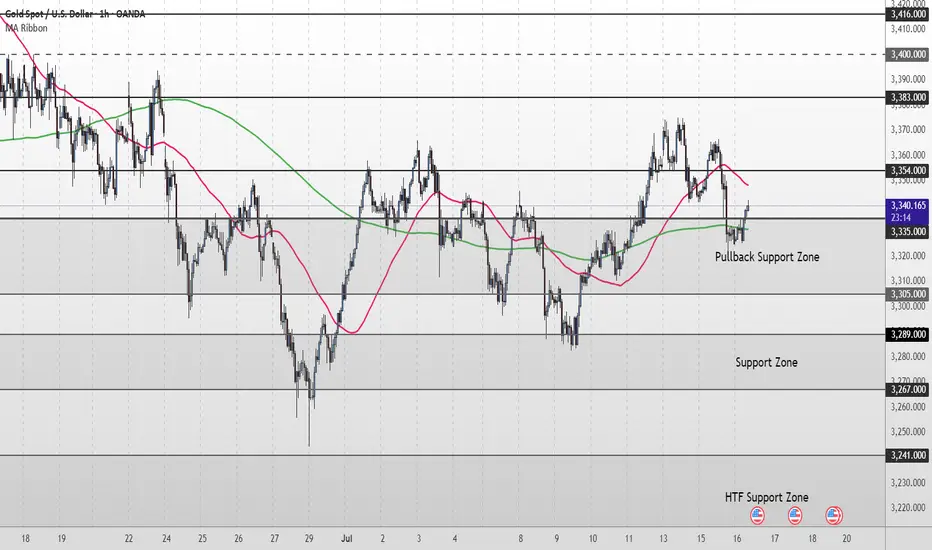
Gold Short Term OutlookGold has pulled back sharply from the 3,354 resistance but found support inside the Pullback Zone (3,335–3,3305 where buyers have stepped back in. Price is now attempting to reclaim ground, trading around 3,341, with the 50MA acting as dynamic resistance overhead and the 200MA as dynamic support.
For the bullish move to continue, we need to see a clean break and hold above 3,354. That would reopen the path toward 3,383 and 3,400, with 3,416 as the higher-timeframe target.
If price fails to clear 3,354 and rolls over again, watch the Pullback Zone (3,335–3,305) for signs of exhaustion. A break below 3,305 would shift focus to the deeper Support Zone (3,289 - 3,267) and potentially toward 3,241 - 3,208 if bearish pressure accelerates.
📌 Key Levels to Watch
Resistance:
‣ 3,354
‣ 3,383
‣ 3,400
‣ 3,416
Support:
‣ 3,335
‣ 3,305
‣ 3,289
‣ 3,267
‣ 3,241
🔎 Fundamental Focus – PPI Release Today
Today’s U.S. Producer Price Index (PPI) will be closely watched as a follow‑up to yesterday’s CPI data.
Gold Short Term OutlookYesterday, price failed to break above the minor resistance at $3,341, which led to a sharp sell-off into the Support Zone. The 50MA has now crossed below the 200MA, reinforcing the short-term bearish momentum.
If the Support Zone fails to hold, we could see a move toward the HTF Support Zone, with downside targets at $3,241 and $3,208.
Any short-term recovery may face resistance at $3,300–$3,328. For a more meaningful shift in sentiment, bulls must reclaim $3,328 to open the path back toward higher levels.
📌 Key Levels to Watch
Resistance:
$3,300 ‣ $3,313 ‣ $3,328 ‣ $3,341
Support: $3,267 ‣ $3,241 ‣ $3,208
🔎 Fundamental Focus
Markets are positioning ahead of Wednesday’s FOMC Meeting Minutes, which could give insights into the Fed’s internal sentiment on rate cuts.
⚠️ Stay sharp — manage your risk.

[INTRADAY] #BANKNIFTY PE & CE Levels(26/06/2025)Today, Bank Nifty is likely to open slightly gap up near the 56,550–56,600 zone, which is a crucial resistance area. A sustained move above this zone can trigger bullish momentum, opening the door for further upside targets of 56,750, 56,850, and potentially 56,950+. Traders can look for buying opportunities in call options above this range with a tight stop-loss, especially if the index breaks out with strong volume and positive sentiment. The zone between 56,600 and 56,950 has acted as a resistance band in recent sessions, so a clean breakout may lead to a directional rally.
On the flip side, if Bank Nifty fails to hold above the 56,450 mark and starts to trade below it, we may see downside pressure in the market. This breakdown could offer a good short opportunity using put options, with downside targets around 56,250, 56,150, and 56,050. The 56,050 level will act as a strong support and could attract buyers again if tested. Traders should remain cautious near resistance and support zones and avoid aggressive positions unless there is clear confirmation. The market may remain volatile in the first half, so a wait-and-watch approach with disciplined risk management is advisable.

DXY: US dollar To Drop Further Around 95?The US dollar has been steadily declining since the new president was elected in the USA. This decline has been accompanied by the ongoing trade wars. Numerous economic indicators have supported this trend, and we anticipate further depreciation in the coming days or weeks. Before trading, it’s essential to conduct your own analysis and gain a comprehensive understanding of the market.
We wish you the best of success in trading. Good luck and trade safely.
Like and comment for more, and as always, happy trading!
Team Setupsfx_

Gold prices bottomed out and rebounded, market trend analysis.Analysis of gold trend: From the perspective of market sentiment, interest-free gold as a safe-haven asset has performed strongly this year, with prices soaring by nearly $700 and hitting record highs several times. However, the recent optimistic expectations of easing global economic and trade relations have boosted market risk appetite, and the equity market has generally performed positively. Some funds have flowed out of safe-haven assets such as gold and turned to risky assets, which is also the main psychological factor under pressure on gold prices. If market risk appetite continues to improve, global economic and trade relations further ease, and the US dollar strengthens, gold prices may face greater downward pressure. From a technical point of view, the gold price needs to effectively fall below the $3,265-3,260 range in the short term before a larger correction downward may be confirmed. Once confirmed to fall below, the gold price may quickly fall to the 50% retracement level near $3,225, further pointing to the $3,200 mark. If $3,200 is lost, it will suggest that gold may have peaked in the short term.
Gold opened higher in the Asian session on Monday and continued to fall last week after hitting 3336. The idea of the Asian session was to directly bearish at the analysis point of 3277. After hitting the lowest point of 3268, it fluctuated upward. The European session also fell to 3273 and then rebounded. The highest point in the US session just reached 3336 again, a standard bottoming and rebounding trend. Since it is an adjustment structure, let's re-analyze the idea. The gold price fell at 3500 and rebounded at 3260 last Wednesday. The rhythm was volatile. It rebounded above 3260 many times below and did not cross the first rebound high of 3367 above.
Today, we mainly focus on the closing price. If it stands firmly at the 3313 line, we will adjust our thinking on Tuesday. On the contrary, it will fall back after encountering resistance at 3336, today's opening high, and go to 3278. On Tuesday, we will continue to look at the idea of swinging and falling. Now it is the end of the market, and the market is also falling from a high.

BTCUSD Daily View Based on your 15-minute BTC/USD chart, here’s a structured technical analysis for **April 10, 2025**:
---
### 🧠 **Chart Breakdown**
- **Break of Structure (BOS)**: Bullish BOS occurred earlier, indicating short-term upward momentum.
- **Strong High**: Marked at **$83,568** — this is a **liquidity point** that could act as a magnet if bullish momentum resumes.
- **Weak Low Zone**: Around **$81,451** — a key liquidity area that might be swept before any significant move up.
- **Current Price**: **$81,814**, sitting just above the weak low zone and in a minor consolidation phase.
---
### 🔍 **Market Context**
- After a strong impulsive move up, BTC started pulling back with lower highs and lower lows, indicating **retracement** or **distribution**.
- The price is holding slightly above the weak low, meaning:
- Smart money may be trying to **trap shorts or induce longs** before a deeper sweep or reversal.
- There's potential for **liquidity sweep below $81,451** before heading back up to test the strong high ($83,568).
---
### 🔮 **Today's Bias: Neutral-to-Bullish (Scalp or Swing)**
#### 🎯 **Bullish Scenario (Preferred if $81,451 holds)**
- Price holds above or sweeps $81,451 and **reclaims the zone quickly**.
- Expect a bounce toward:
- **$82,500** (intermediate resistance)
- **$83,568** (strong high / liquidity target)
#### 🛑 **Bearish Scenario (Only if clean break below $81,451)**
- Price breaks and holds below **$81,451** → retest failure = bearish.
- Target downside levels:
- **$80,500**
- Potentially **$79,500** if momentum is strong.
---
### 🧭 **Action Plan for Today**
| Type | Strategy |
|-------------|----------------------------------------------------------|
| Intraday Long | Buy near $81,451 zone with tight SL below $81,200 |
| Confirmation Entry | Wait for 15m bullish engulfing / BOS above GETTEX:82K |
| Short Setup | Only valid on clear 15m breakdown + retest below $81,451 |
---


Cheems - 1 hour timeframe tradingRisky Trade - protect as soon as possible. 1 hour time frame. Resistance in 0.00000098 (TP 1). Close trade when it's around that price or take partial and protect in breakeven.

Catching Intraday Trades like a PRO!!Hows the Josh?
High, sir!
--------------
Attaching today's intraday positions, all in profit, for your motivation.
Have a great weekend, wonderful people!
Stay strong!

Xag-USD Price creat our Context based on Daily Time Frame
We have D +OB as key Level
in 1h We have Bullish BRK overlaping with 1h +OB and IFVG
Target 2RR
disclaimer not financial advice

NAS100 blue pill or red pillFOMC + Rate cuts in T-minus 3 Hrs EST.
Blue box = Bullish stocks / weak dxy 20,200 levels towards ATH
Red box = Bearish stocks/ strong dxy 18,300 levels towards last correction
Current price: 19468
Pick a pill...


Day Trader Trading Nifty Futures & Options-22nd Mar ’24 Below mentioned points are discussed in my post analysis video(Fast forward to 0:42 for Hindi Audio)
-No Trades in the morning
-Sell Volumes in nifty before 10
-Buy Nifty Future After 12 was the Volume Trade
-How will i trade when market opens tom

Intraday Trading Nifty Futures & Options-19th Mar ’24Below mentioned points are discussed in my post analysis video(Fast forward to 0:50 for Hindi Audio)
-No Trades in the morning
-Nifty had sell volumes in the morning
-Scalped Nifty After 12 once Nifty Spot Broke IB Range
-How will i trade when market opens tom

Intraday Trading Nifty Futures & Options-14th Mar ’24Below mentioned points are discussed in my post analysis video(Fast forward to 0:48 for Hindi Audio)
-No Trades in the morning
-Nifty had buy volumes
-Selling/Buying Nifty after 12 was tricky today!
-How will i trade when market opens tom

DAX testing Bouhmidi-Bands -TrenddayXETR:DAX update - New all-time high due to an expected test of the upper #BouhmidiBand. Attention trend day. A breakout should bring new impulses with the US opening.

XAU/USD 27 Feb 2024 Intraday AnalysisH4 Analysis:
Expectation remains the same as per analysis yesterday (26/02/2024)
-> Swing: Bullish.
-> Internal: Bearish.
-> Sub-Internal: Bullish.
-> Has reached EQ.
I have marked sub-internal in red due to the significant range of the internal structure.
Price has printed a bullish sub-internal iiBOS. which indicates that we are still in the pullback phase of the internal structure.
We now seem to be in the pullback phase of the iiBOS.
Price is reacting to the 50% EQ of the swing range, which is indicated in black.
Current expectation, is for price to target weak internal low. A good indication that pullback phase of the internal structure is completed is once price breaks and closes below sub-internal structure low to target the weak internal low.
Price could possibly continue bullish, react at H4 POI before continuing bearish move.
H4 Chart:
M15 Analysis:
-> Swing: Bullish.
-> Internal: Bullish.
-> Has reached EQ.
Price has printed a bullish iBOS. Internal range established.
POI marked with red border is a flip-zone where price mitigated and continued bullish.
Flip zone is also closely located close to 50% EQ.
Intraday expectation is for price to continue bullish to target weak internal high.
M15 Chart:

Gold quietly waiting for new newsGOLD MARKET UPDATE:
For the first time in three weeks, gold prices (XAU/USD) ended on a positive note, buoyed by ongoing geopolitical tensions and the recent weakening of the US Dollar (USD). However, the precious metal is facing challenges in sustaining its upward momentum and has seen a slight decline in the Asian trading session on Monday. This could be attributed to speculations that the Federal Reserve (Fed) might maintain higher interest rates for a longer period.
Market participants have recently adjusted their expectations regarding an early rate cut by the US central bank. This shift in sentiment followed the release of consumer and producer price data in the US, which came in higher than anticipated earlier this month. Additionally, the minutes from the FOMC meeting at the end of January and hawkish comments from Fed officials suggest that the central bank is reluctant to cut interest rates due to persistent inflation and a strong US economy.
