AUDUSD 4h Inverted Head and ShouldersSo far, this is only a theory as the second shoulder has not been formed yet. If I do see this pair starting to weaken, I will sell with a target of near the support, around 0.7300.
Although two possibilities are mapped out by the red arrows, the green lines show where I think price is likely to move.
Inverted

AUDNZD inverted H&Sinverted H&S pattern forming
head bounced off of 1.026
RS bounced off of monthly trend line
Strong acting resistance and neckline at 1.075
looking for price to break above neckline and retest to enter long
Long term pattern=better strength of pattern
If upper mothly trendline is broken, price may carry and retest creating new highs. TP1 at 1.093

Inverted H&S pattern on EURNZDPossible inverted H&S pattern
LS,H formed with good signs that RS is forming
Long term pattern
1.510 and 1.526 are key areas where price might get stuck
aggressive neckline at 1.510
price may go up to monthly trend line which may be a rejection area (TP1)
long term trade with TP2 at 1.580

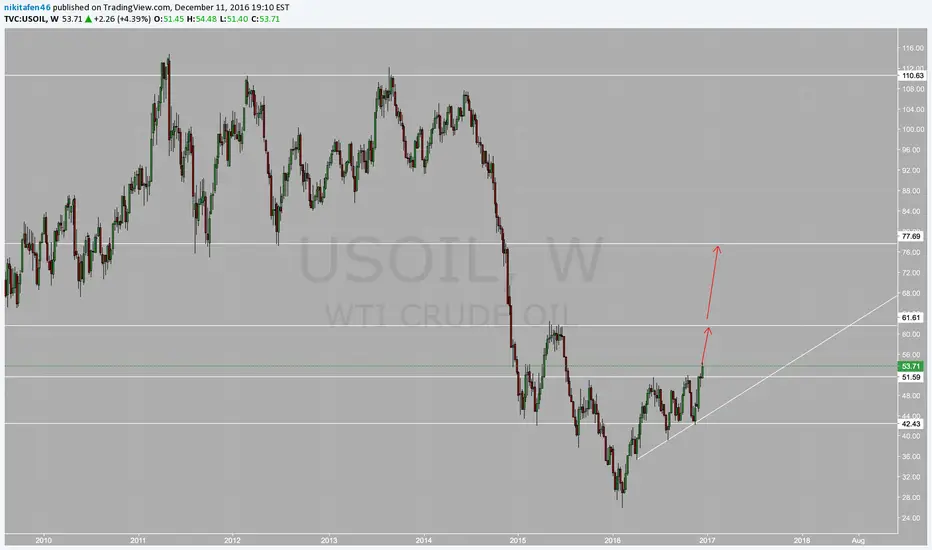
USOIL Inverted Head & ShouldersOn the weekly chart, I see something that resembles an inverted head and shoulder formation.
Price has broken out of the neckline at 51.59 area, and seems to be retesting it this week.
I expect a bullish run at least to the range of (59 - 61).

AUDNZD Inverted Head & ShouldersWe have a downtrend from the 1.13 area to 1.0236, and within it there is the first shoulder, the head, and the second shoulder, which I believe has already formed. The red resistance at 1.0760 is the resistance neckline, which when broken will initiate a long position up to 1.13, the major zone of previous resistance
On the daily/4h time frame there is a resistance trendline, which when broken will signal that the second shoulder has indeed formed.
Additionally, a long position can be taken after the break of this resistance trendline. Remember to have a daily candle close above this, and watch for a retest to reinforce the long position from this 1.05 area.

RIC- Inverted H&SMaybe this will work on an inverted right shoulder to complete the inverted H&S pattern. Will need to get back over 7.00 after consolidation for breakout area.

USOIL Weekly Inverted Head and ShouldersPretty self-explanatory, although the formation is not yet complete by my standards, price is certainly bullish until 60.00, past that to 76, and then maybe eventually to 110.
Bearish Bat Chart Pattern + doji and inverted hummer pattern The pattern is completed. Doji and inverted hummer are going to support the chart. Loooking Closely

11 months inverted H&S pattern.Perfectly symmetrical H&S. Now we would be at the symmetrical point we were on July 23, 2015. It could get to 56 in a month, month and a half.

IMAX- Short at is breaks down forming Inverted Flag IMAX- Short
Trade Logic: Inverted flag & pole
Technically very weak as crossed down recent support & money-flow is shooting down
Entry Price: 29.43
Target Price: 27.13
You can check our detailed analysis on IMAX in the trading room link here-
Trade Suggestion Date: 21/6/2016
Trading Room - Executive summery link: www.youtube.com
Time Span: 11:00”
Trade Open: Waiting for reversal to open price


GBPNZD - Long Outlook potentialBullish outlook
1. Inverted hammer at bottom of trend
2. Double bottom
3. Massive retracement
4. Bullish Wedge
5. Some key support area 2.065
6. Fibonacci .618 retracement

EUR/GBP -LONG SETUP-1. As shown we are in a channeling uptrend idea of this is to try ride the uptrend as soon as possible
2. Channel support being tested showing price rejection
3. Horizontal support area
4. Fib 38% Seems to be holding
5. Potential inverted hammer being formed
6. Arrows on price showing measured moves to the upside


Gold Pre Fomc Gold is making invested head and shoulder pattern. Wait for H4 closing above 1076 and go long with targets of 1105-1130-1150.Primary target is 1105 but Fomc....splitting trade in 3 positions is a good idea.
Stop is 1044.

Very clear inverted head and shoulder about to break necklineHead and shoulder pattern breaking neckline at 240 USD. stop loss at 236, target at 250 for a 2:1 risk return ratio. Even better target at 255 USD, but might take longer to happen

Inverted VIX Contract StrategyAnytime, when the front month contracts are expensive than the back month's. Any rally to the upside is to be taken with a grain of salt.
Because, Market is pricing in more risk on short term contract than the long terms. And risk in the general market knows only one direction, which is ________. assuming you know the answer. I will leave that blank.
Any rally during that time is a good place to sell Credit spreads on the market. You can backtest this.
I will release a code soon (working on it)
The rally high marks a good resistance point as well. So watch out before you get excited, trying to catch the bottom.
-
Good Luck Folks.

GER30: Another Test of StructureOne of my current clients is a big trader of the German DAX so i find myself looking at this index on almost a daily basis. The more I look at it, the more I enjoy breaking it down as it seems to be a pretty technical friendly chart.
When taking a look at it today in my Live Trading Room we noticed a few things. The obvious structure level looking left, the potential butterfly pattern completion at that structure level and a large area of confluence between numerous Fibonacci extensions and inversions. We've also got some AB=CD action thrown in there as well. Yes there's an even bigger potential butterfly that could be setting up on the higher timeframes. But there's no need to worry about that until structure is broken.
Akil

LNKD (Linked In) Target for 20% gainLinked in created and inverted ascending scallop -- confirmed. (thepatternsite.com). A bonus is the U-shaped volume with the pattern.
This alone sets the target price at 279.25.
In addition, a cup and handle is in the process of forming, which if successful, sets an intermediate target price at 263.
On Balance Volume (OBV) also remains in a very positive upward trend.

EURUSD still a shortSome bullish sentiment coming in after Wed but by Thursday night price dumped again and now forming a channel with divergence . I am still keen to short but this time bullish has a reason to go long with the inverted head and shoulders.
The crucial level will be 2669 for me and I am looking for a min. h4 candle close to reenter short. A close below this means the inverted head and shoulder becomes invalidated and hence giving the legitimacy to rejoin this bearish trend. I will be looking for 1.2500 this time for TP
trade no good if it closes back above the neckline

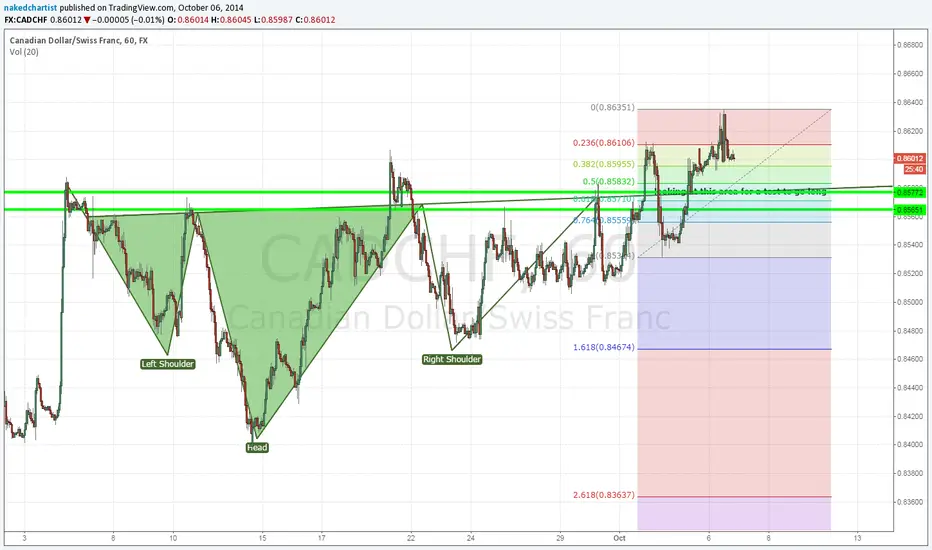
CADCHF inverted hns completed for longan inverted heand and shoulders has been completed and I am now monitoring for a neckline retest to go long.
The neckline support will be based on d1 line chart and I will be monitoring the neckline f6 area for a good test.
DAX TU 30': Inverted H&S PROJECTS 9640 TARGET?The UT 30' chart shows what I believe to be an inverted Head & Shoulders, which if confirmed has 9640 as target

Potential 30% Upside on inverted head.shoulders pattern in $GLUUInverted head and shoulders on multiple time frames. 1st target is the gap at $6.08 Second target Gap fill at $6.62. Potential 30%+ return setup. Also Very Strong Buy signaled not he weekly chart this week. (Posted Chart yesterday).
