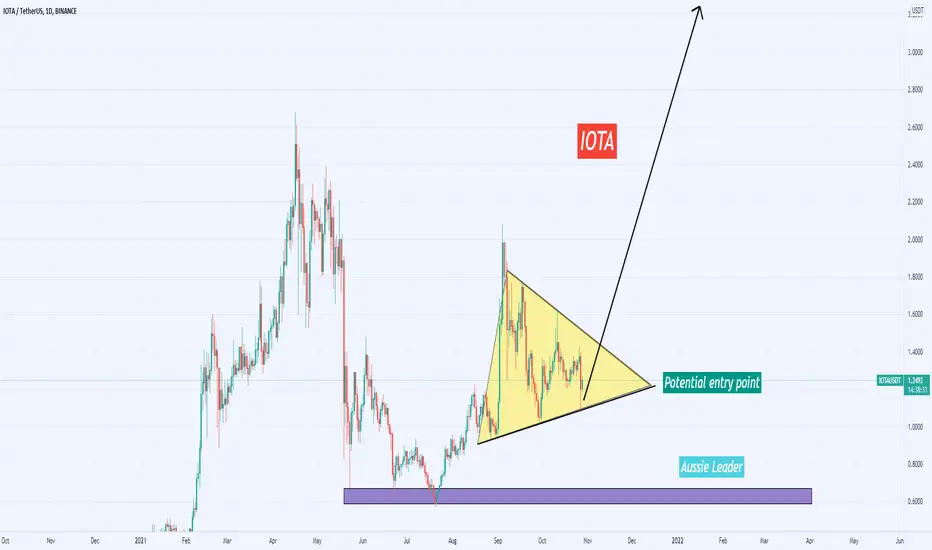
IOTAUSDt trade have potential entry positionIOTAUSDt trade can boost towards 3X target. At this moment, it is showing good entry point to get in. There is strong support around purple bar. Trade will be in the bull trend until it remains above purple bar.
IOTA
Double 'cup and handle' formation on IOTAWith optimistic glasses on, you can view a double 'cup and handle' configuration for IOTA that could get us towards 3$.

IOTA/BTC pair - Elliott corrective waves completedIn my opinion we have completed wave C of the Elliott waves theory aligning with the 2k sats support. Volume is dominated by bulls and once fundamental news support the trend reversal, we will see how far wave 1 can go; potentially leading to a break-out of the 4k sats resistance.
Good luck with your trades! Do not consider this as financial advice.

IOTAUSDT | Long/BuyThe chart show us that correction ABC wave 2 is over and then continues to make impulsive wave 3 which is the longest wave. But if the chart going down to bellow 1.2047 that mean the wave 2 still continues. use 1.2045 level as stop loss.

LTC - Seriously undervalued.Firstly let's remember that this is crypto market. There's no such thing as delusional assumptions / impossible analysis. Things are less or more probable. This move happened in the past, regardless it's behemoth proportions - no one can deny it. If this would happen again... BTC profits would be equally ridiculous to this being even a possibility. I see here two significant resistance levels which in turn would mark my target areas where I would normally realize 33% profits - I'm rather long time investor, not focusing on hourly candles at all.
Call me mad - I'll wait.
Got some more LTC here.

ALTS look primed for a move vs BTCBelow a list of ALTS vs BTC charts that look ready for a move.
Most of these ALTS have been dormant vs BTC and for the past 2 years have either grinded slowly lower or have been going sideways.
All these ALTS are now sitting at key levels and some are displaying interesting RSI bullish divergences on the weeklies.
Furthermore volatility has been extremely low over the past 2 years (as displayed by the ATR indicator).
Long periods of low volatility precede periods of high volatility and therefore we can expect some big moves in the near future.
The risk reward at these levels is very favorable for LONG trade setups as long as your happy to be patient.

IOTA USDT Below the red line can be considered as the stop loss zone.
Above the green zone can be considered as entry level.
The depth of the head has not been exceeded yet
We can think of it as Double Head and Shoulders. We can also assume the appearance of a descending wedge that includes them all.
If the formation does not mislead us, you can set the TP targets for yourself. I preferred to put a close stop loss. Maybe it will give more buying opportunities. But you may want to set your own strategy. I just wanted to reveal the chart and patterns.
Note: This is not investment advice.

IOTA breaking out at the last momentI'm surprised because when the breakout happens at the end of the triangle usually it goes down. However BB are stretching at daily (not shown) and the chart pattern is clearly bullish. VLPR shows in the last 15 days support price has been clearly below current price which is good.
At this point as soon as buy volume surges we'll see a proper pump.

IOTA MIOTA ready to fly 2.0 - IOTABTC IOTAUSDT IOTAUSDC IOTAUSDIOTA MIOTA Ready to fly 2.0 , must follow Daily Channel , keep SL if breakout daily channel


Conviction remains the sameBreak the trendline, most likely we see parabolic action. When this coin moves it moves very quickly. I believe it's slightly undervalued and should be sitting around $2

iota analisis with fibo zoneidk what to put here because this analisis is only for prove something so bla bla bla
bitcoin money money money
hyperinflation is coming
back back back

MIOTA vs Bitcoin Chart Analysis (IOTABTC #6)MOITA (IOTABTC) is giving out an air of recovery but somehow I am not fully convinced.
We see prices moving above EMA10 and the recent MACD bullish cross but when we look closer, we have a lower low compared to the recent July and August support.
We also have a descending channel rather than a falling wedge.
It will surely recover, we are bullish long-term but there is room for additional correction, keep this in mind before you trade.
Bullish above 0.00002285 in the short-term.
Any trading below this level and we aim for the 0.786 Fib. retracement level support.
This is not financial advice.
All the information is shared for learning/entertainment purposes only.
Thank you for reading.
Namaste.

IOTA 1Diota is looking bullish. ema providing good support MACD bullish. iota can near breakout it can give good gains. NFA

Looking for longs around these levels !! $IOTARequested chart
Simple enough: I’m looking for shorts at the supply,
and looking for longs at support or confirmed breakout from the resistance.


IOTA/USD: UPTREND| PRICE IS GROWING FAST....Welcome back Traders, Investors, and Community!
Check the Links on BIO and If you LIKE this analysis, Please support our Idea by hitting the LIKE 👍 button
Traders, if you like this idea or have your own opinion about it, please write your own in the comment box . We will be glad for this.
Feel free to request any pair/instrument analysis or ask any questions in the comment section below.
Have a Good Day Trading !

🆓MIOTA (IOTA) Oct-22 #IOTA $IOTAIOTA has just successfully conquered the $1.3 zone and is moving to the $1.5 and $2 zones. If it loses the $1.3 zone then we will wait to buy back at the $1.15, $1.05 and $0.95 zones.
📈RED PLAN
♻️Condition : If 1-Day closes ABOVE 1.3$ zone
🔴Buy : 1.3
🔴Sell : 1.5 - 2
📉BLUE PLAN
♻️Condition : If 1-Day closes BELOW 1.3$ zone
🔵Sell : 1.3
🔵Buy : 1.15 - 1.05 - 0.95
❓Details
🚫Stoploss for Long : 10%
🚫Stoploss for Short : 5%
📈Red Arrow : Main Direction as RED PLAN
📉Blue Arrow : Back-Up Direction as BLUE PLAN
🟩Green zone : Support zone as BUY section
🟥Red zone : Resistance zone as SELL section

₿ IOTAUSDT 1D ₿ : 19.Oct.2021This analysis is a check of the chart in a Daily time frame and everything is clear on the chart and does not need additional explanation ... However, if you have any questions, feel free to ask .
⚠️ This Analysis will be updated ...
👤 Arman Shaban : @Ar_M_An_4
📅 19.Oct.2021
⚠️(DYOR)

Iota's pretty diamondAlmost done accumulating at the bottom. Expecting a nice movement into May next year. 8-10k sats seems easy. the only question is: will BTC be 15k, 60k, 100k or 200k when we get there.

LTC, LONG termSometimes I'm shocked seeing sell ranges, but at the end of the day - it's just numbers... Imagine telling someone once Litecoin is at $3 that it will do over 100x within the next few months... You would be laughed at. Now look at the price from the beginning of 2017 - seeing possibility of c. $3k looks like a matter of time. To good to be true - let's see how this one plays out during this cycle.

IOTA - Trend-Following Buy Setup!Hello everyone, if you like the idea, do not forget to support with a like and follow.
IOTA is overall bullish so we will be looking for buy setups on lower timeframes.
on H4: IOTA is forming a trendline in red but it is not valid yet, so we are waiting for a new swing high to form around it to consider it our trigger swing. (projection in purple)
Trigger => Waiting for that swing to form and then buy after a momentum candle close above it (gray zone)
Meanwhile, until the buy is activated, IOTA would be overall bearish can still trade lower.
Good luck!
All Strategies Are Good; If Managed Properly!
~Rich

IOTA/USDTIOTA is bit bearish for now, it may re test previous month POC as a support . it has high probabilities of a solid bounce.
it could be one of the best pick.
