ETOR: in the macro support zoneNASDAQ:ETOR watching for the price to form at least a mid-term bottom in the macro support zone at 31.80–28.60.
Chart:
IPO

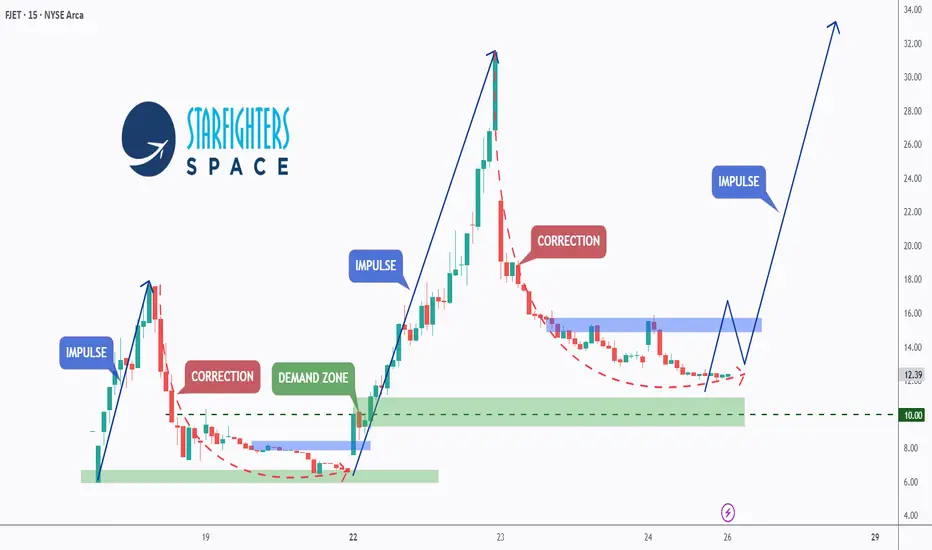
FJET - Post-IPO Structure Is Taking Shape!After its public debut, Starfighters Space ( AMEX:FJET ) delivered exactly what strong listings tend to do:
an impulsive expansion 📈, followed by a healthy correction 📉, and now the early signs of structure forming.
This phase is where real opportunities usually start to emerge.
📊 Technical Analysis
Cycles are clearly repeating on FJET.🔄
In the previous cycle, FJET printed a strong impulse move from around $6.4 to approximately $31, representing a ~400% expansion🚀 .
That rally was followed by a curved correction , after which price retested the $10 demand zone and used it as a base for continuation.
🔄Now, we are seeing the same structure forming again.
FJET is currently trading within another curved correction , gradually rotating lower toward a newly formed demand zone between $10 and $11 . Importantly, this correction is unfolding with decreasing downside momentum, suggesting absorption rather than aggressive selling.
🏹The key trigger remains the last high marked in blue around $16.
A clean break and hold above this level would confirm bullish continuation and signal the start of the next impulse move, with the potential to push FJET toward new all-time highs above $31.
⚔️As long as the $10 demand zone holds, the structure continues to favor continuation over reversal.
💡 Bigger Picture
Now that FJET is officially public📊, the narrative has shifted from anticipation to execution.
Starfighters Space is not a speculative concept, it’s an operating aerospace company:
- Flying missions out of NASA’s Kennedy Space Center👩🚀
- Operating the world’s only commercial Mach 2-capable fleet
- Backed by validation from NASA, Lockheed Martin, GE, and the U.S. Air Force🛩
Post-IPO phases like this are often where institutions begin evaluating structure, liquidity, and follow-through, not at the highs, but during consolidation.
📘 Bottom line
FJET has moved past the chaos of its debut and is now building a base.🪨
If demand continues to hold and momentum rebuilds, this consolidation could be the pause before the next expansion.
This is the phase where patience matters most.
📌 Always do your own research and speak with your financial advisor before investing.
📚 Stick to your trading plan, entry, risk management, and execution.
All Strategies Are Good, If Managed Properly!
~ Richard Nasr
Disclaimer: I have been paid $800 by CDMG, funded by Starfighters Space, to disseminate this message.
Amazon - The Hidden OpenAI Play Before IPO, $210-220 SupportAmazon - The Hidden OpenAI Play Before IPO, $210-220 Support Entry
Amazon: Positioning as OpenAI's Infrastructure Partner Before the IPO Window
While the market focuses on Microsoft as OpenAI's primary partner, Amazon is quietly positioning itself as the diversification play that could unlock billions in recurring AI infrastructure revenue. With a minimum $10 billion commitment to OpenAI and strategic discussions around custom AI chip deployment, Amazon offers exposure to the OpenAI growth story at a structural support level that provides defined entry risk.
🎯 The Strategic Play:
Amazon's $10 Billion OpenAI Commitment:
Amazon has committed at least $10 billion to OpenAI, but this isn't just a financial investment - it's a strategic infrastructure partnership. The deal positions Amazon Web Services (AWS) as OpenAI's diversification partner away from Microsoft Azure dominance.
Why This Matters:
Reduces single-vendor risk for OpenAI's massive compute needs
Opens AWS as a hosting platform for OpenAI workloads
Custom chip integration potentially using Amazon's Trainium/Inferentia
Equity stake gives Amazon ownership upside if/when OpenAI goes public
Alexa integration potential for next-generation AI assistant capabilities
Current Market Context:
AMZN Price: $200-240 range
Market Cap: ~$2.4 trillion
Technical Setup: Testing major support zone
Catalyst Timeline: OpenAI infrastructure decisions and potential IPO window
📊 Why $210-220 is the Entry Zone:
Technical Support Confluence:
The $210-220 area represents a critical accumulation zone where multiple technical factors converge:
Previous consolidation support from earlier 2024 trading
Volume profile node showing institutional buying activity
Psychological level near $200 round number
Pullback into demand after extended rally earlier in year
Risk/Reward at Support:
Entry: $210-220 zone
Stop: Below $200 (psychological and structural support)
Target 1: $280 (previous resistance, 30% upside)
Target 2: $320 (extension target, 50% upside)
Risk/Reward: 5:1 to 8:1 depending on exact entry
Why Now:
Market has pulled back from highs, creating entry opportunity before OpenAI infrastructure announcements and potential IPO catalysts materialize in 2025.
💡 The OpenAI Infrastructure Angle:
Microsoft's Monopoly Problem:
OpenAI currently relies heavily on Microsoft Azure for compute infrastructure. This single-vendor dependency creates:
Risk concentration if Azure faces issues
Pricing leverage for Microsoft
Capacity constraints during demand spikes
Strategic limitation in vendor negotiations
Amazon as Plan B (and Eventually Plan A?):
If OpenAI shifts even 20% of compute workloads to AWS, that translates to:
Billions in recurring AWS revenue (high-margin cloud business)
Multi-year contracts providing revenue visibility
Upselling opportunities for other AWS services
Competitive positioning against Microsoft in AI infrastructure
The Math:
OpenAI's compute costs are estimated in the billions annually and growing exponentially. A 20% shift to AWS could represent:
$2-4 billion annual revenue for Amazon (conservative estimate)
70%+ margins on cloud infrastructure
Recurring nature creates compounding value
🔧 Amazon's Custom AI Chip Advantage:
Trainium and Inferentia:
Amazon has developed custom AI chips specifically for training and inference workloads:
Cost Advantage:
40% cheaper than Nvidia H100 GPUs (industry standard)
Better price/performance for specific workloads
No Nvidia supply constraints (Amazon controls production)
Strategic Importance:
Reduces CAPEX for OpenAI's massive compute needs
Faster deployment without Nvidia waitlists
Customization potential for OpenAI-specific workloads
OpenAI Exploring Amazon's Chips:
Reports indicate OpenAI is actively evaluating Amazon's AI chips. If adopted:
Validates Amazon's chip strategy
Creates dependency on AWS ecosystem
Locks in multi-year infrastructure relationship
🤖 Alexa Integration Wildcard:
The Opportunity:
Amazon's Alexa has struggled to compete with newer AI assistants. OpenAI integration could transform Alexa into:
ChatGPT-powered voice assistant with superior conversational AI
Multi-modal capabilities (voice, vision, reasoning)
Competitive parity with Google Assistant and Siri
Monetization vehicle for premium AI features
Why It Matters:
Alexa is in 500+ million devices globally
Integration would be immediate distribution for OpenAI
Creates consumer-facing AI revenue stream for Amazon
Differentiates Echo devices in smart home market
💰 The Equity Upside:
Amazon Gets OpenAI Equity:
As part of the $10 billion investment, Amazon receives equity in OpenAI. If OpenAI goes public (rumored $100B+ valuation):
Scenario Analysis:
Conservative: Amazon owns 2-3% of OpenAI at $100B valuation = $2-3B equity value
Moderate: Amazon owns 5% at $150B valuation = $7.5B equity value
Aggressive: Amazon owns 8% at $200B valuation = $16B equity value
Double Upside:
Infrastructure revenue: Billions annually from AWS hosting
Equity appreciation: Ownership stake in OpenAI's growth
This is rare - Amazon gets paid to host the workloads AND owns part of the company.
📈 Why Amazon vs. Microsoft:
Microsoft Already Priced In:
Market cap reflects OpenAI partnership expectations
Azure revenue already includes OpenAI contribution
Limited upside surprise potential
Amazon is the Surprise Factor:
Market underestimates AWS diversification opportunity
OpenAI partnership not fully reflected in valuation
Chip strategy under-appreciated by analysts
Alexa integration potential ignored
Risk Diversification:
Rather than betting on Microsoft maintaining 100% of OpenAI infrastructure, Amazon represents the diversification trade that captures:
20-30% of OpenAI compute (realistic scenario)
Equity upside if OpenAI IPOs
Alexa transformation potential
Broader AI chip validation
📊 Fundamental Context:
Amazon's Core Business:
AWS: ~$90B annual revenue, 30%+ margins (crown jewel)
E-commerce: Dominant market position, improving margins
Advertising: $45B+ business growing 20%+ annually
Free cash flow: $50B+ annually
Why Support Holds:
At $210-220, Amazon trades at reasonable valuations considering:
AWS growth acceleration from AI workloads
Margin expansion as efficiency initiatives mature
Advertising becoming major profit center
OpenAI partnership optionality (free upside)
Institutional Behavior:
Major funds accumulate mega-cap tech at support levels
$200-220 zone represents algorithmic buy programs
Long-term investors view pullbacks as entry opportunities
🎯 Trade Structure:
Entry Strategy:
Aggressive: $220 area (current technical support)
Conservative: $210 (psychological support, higher conviction)
Scale in: Buy 50% at $220, 50% at $210 if it gets there
Risk Management:
Stop loss: Below $200 (invalidates support thesis)
Position size: Appropriate for 5-10% portfolio allocation (mega-cap)
Timeframe: 6-12 months for full thesis to develop
Target Zones:
TP1: $260 (20% gain, previous resistance)
TP2: $280 (30% gain, reduce another third)
TP3: $320+ (50% gain, major resistance zone)
Catalyst Timeline:
Q1 2025: Potential OpenAI infrastructure announcements
Q2 2025: AWS earnings showing AI revenue growth
H2 2025: OpenAI IPO window potentially opens
Throughout: Alexa integration rumors/announcements
🧠 Why Most Will Miss This:
Microsoft Tunnel Vision:
Everyone watches MSFT as "the OpenAI stock" - Amazon's positioning is overlooked despite potentially better risk/reward.
Mega-Cap Bias:
At $2.4T market cap, traders assume Amazon "can't move much." But 30-50% gains on a $20-30 billion investment theme is massive absolute dollars.
Infrastructure Complexity:
Most investors don't understand cloud infrastructure economics. They miss that AWS hosting OpenAI is higher-margin than most of Amazon's businesses.
Timing Fear:
Buying at $220 after the stock has pulled back from $250+ feels uncomfortable. But that's precisely when technical support + fundamental catalysts create opportunity.
📅 Catalyst Timeline and Expectations:
Near-Term (Q1 2025):
OpenAI infrastructure announcements
AWS re:Invent conference AI reveals
Potential Amazon chip deployment news
Mid-Term (Q2-Q3 2025):
AWS earnings calls highlighting AI workload growth
Alexa AI integration announcements
OpenAI compute diversification details
Long-Term (H2 2025+):
OpenAI IPO window potentially opening
Amazon equity stake value becomes visible
Multi-year AWS infrastructure contracts disclosed
⚠️ Risk Factors:
What Could Go Wrong:
OpenAI Stays With Microsoft:
If OpenAI decides not to diversify infrastructure significantly, Amazon loses the thesis catalyst. However, the $10B investment still provides equity exposure.
Chip Strategy Fails:
If OpenAI doesn't adopt Amazon's custom AI chips, the cost advantage and ecosystem lock-in don't materialize.
Market-Wide Correction:
Mega-cap tech could face broad selling pressure regardless of individual catalysts. The $200 support could break in a risk-off environment.
OpenAI Stumbles:
If OpenAI faces competitive pressure from other AI companies or regulatory issues, the infrastructure opportunity diminishes.
Valuation Compression:
At $2.4T market cap, Amazon needs significant catalysts to drive meaningful appreciation. If AI growth disappoints, multiple compression could occur.
🏆 The Professional Approach:
They See The Setup:
Technical support at $210-220
Fundamental catalyst (OpenAI partnership)
Asymmetric risk/reward (5:1+)
Multiple paths to upside (AWS, equity, Alexa)
They Size Appropriately:
Mega-cap reduces position risk
Liquid market allows easy scaling
5-10% portfolio allocation reasonable
They Think Long-Term:
6-12 month catalyst timeline
Not a day trade or swing trade
Allows thesis time to develop
They Scale Out:
Take profits at $260, $280, $320
Don't try to pick the perfect exit
Lock gains progressively as targets hit
📌 Key Investment Thesis Points:
✅ $10B+ OpenAI investment positions Amazon as infrastructure diversification partner
✅ 20% compute shift could mean $2-4B annual AWS revenue (high margin)
✅ Custom AI chips provide cost advantage and ecosystem lock-in
✅ Equity stake in OpenAI provides IPO upside (potentially worth billions)
✅ Alexa integration could transform 500M+ device install base
✅ Technical support at $210-220 provides defined entry with tight risk
✅ 5:1+ risk/reward to structural targets with multiple catalyst paths
📊 Investment Summary:
Why Amazon:
Hidden OpenAI infrastructure play
Better risk/reward than Microsoft
Multiple upside paths (AWS, equity, Alexa)
Entry at technical support
Mega-cap liquidity and safety
Why Now:
Pullback to $210-220 support zone
Before OpenAI infrastructure announcements
Ahead of potential IPO window
Market underpricing the opportunity
Why $210-220:
Technical support confluence
Institutional accumulation zone
Risk defined below $200
5:1+ reward/risk to targets
⚠️ Important Disclaimers:
This analysis is for educational purposes and reflects a view on Amazon's strategic positioning with OpenAI. It is not financial advice or a recommendation to buy or sell AMZN or any security.
The OpenAI partnership details are based on publicly available information and reports. Actual infrastructure usage, revenue impact, and equity terms may differ significantly from estimates presented.
Amazon is a mega-cap stock with many business lines. The OpenAI opportunity represents only one potential growth driver among many factors affecting valuation.
Stock prices can decline significantly even when fundamental theses are correct. The $210-220 support could fail, and the OpenAI catalysts may take longer to materialize than expected or may not occur at all.
Technology sector investments carry specific risks including regulatory changes, competitive dynamics, and rapid innovation cycles. Position sizing must account for volatility even in large-cap names.
Always conduct independent research, consider your risk tolerance and investment timeframe, and consult with financial professionals. All investing involves risk of loss.
✨ Your Take:
Are you viewing Amazon as an OpenAI infrastructure play? How do you evaluate the AWS/OpenAI opportunity versus the Microsoft Azure relationship? Share your perspective in the comments.
📜 Buy structure. Diversify exposure. Think long-term.

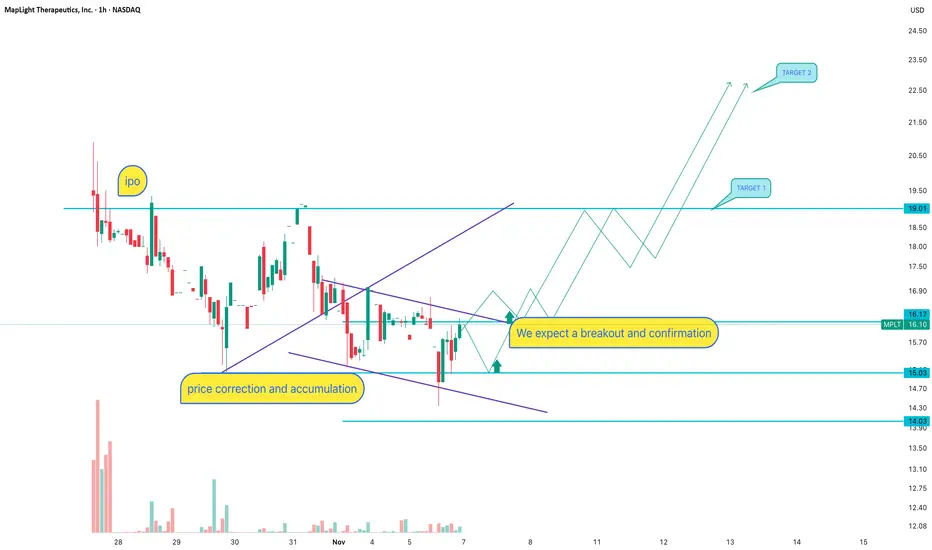
MPLT: Is the IPO working according to a scenarioAfter the IPO, the stock is forming a falling wedge — a classic post-listing accumulation pattern. Price is consolidating between the 15.03 support level and the accumulation zone. We see a trendline breakout attempt and price trying to hold above. The key resistance is 19.01, aligning with the previous consolidation range. Lowering volume indicates seller exhaustion. Scenario: breakout above 16.20 and confirmation gives a path toward target 1 at 19.01, with a potential impulse toward 22.50 (target 2). Entry only after breakout + retest. Without a retest, the risk of a fake breakout increases.
MPLT is a biotech company newly listed on NASDAQ. Post-IPO stocks often go through correction and accumulation while the market defines fair value. FDA updates or clinical trial results can act as catalysts — biotech names tend to move aggressively on news. If institutional interest increases, the trend may accelerate quickly.
If the breakout confirms — the rocket won’t wait for you to fasten your seatbelt. Let price show direction instead of forcing an entry inside noise.
NTSK Netskope: the rocket is on the padNetskope’s shares (ticker NTSK) are trading after a successful IPO, but the chart suggests we’re still in early accumulation phase. The price is hovering in the ~$21-24 zone, and a breakout above near resistance is needed to confirm strength. The first target is $28, with potential extension toward $35–40 if the structure holds. Given IPO volatility, entry requires careful stop-management and confirmation of trend support.
Netskope operates in the rapidly expanding cloud security market (SASE/Zero Trust). With revenue growth exceeding 30% and narrowing losses, the company is well-positioned in the AI-security wave. While the TAM (total addressable market) is large and growth prospects strong, the business still faces profitability and competitive risks.
The rocket may not yet be launched, but the launchpad is set. Stay patient, wait for the “ignition” signal, and let the engine build thrust before liftoff.

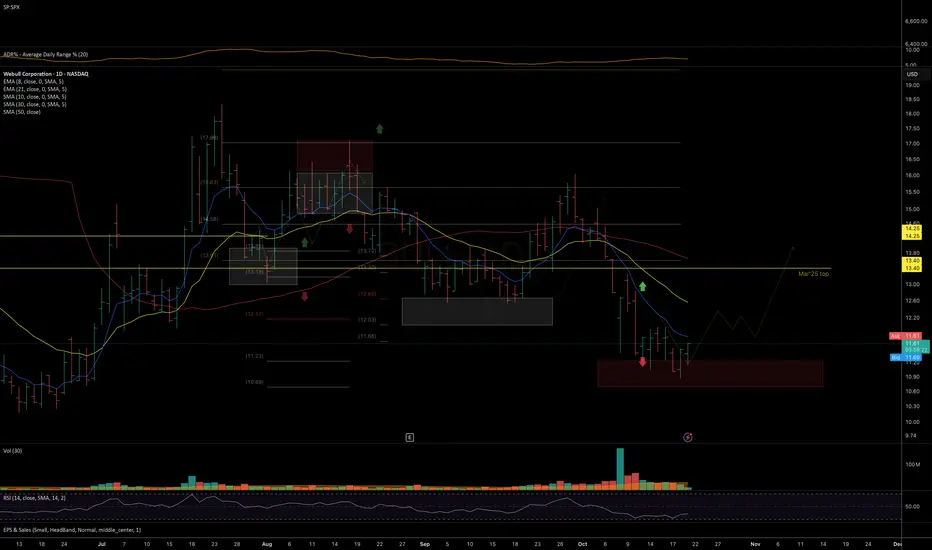
BULL: on the verge of macro support Price has reached key macro support levels where a bottom formation is needed. Otherwise, a close below 10.69 would significantly increase the risk of a breakdown below the summer lows.
Chart:
Previously:
• On macro support levels (Oct 9):
In weekly review (Oct 6–10, 2025)
• On immediate bullish potential — resulted in a 2.5-day swing (Sep 26):
Chart:
www.tradingview.com
• On macro support (Sep 19):
Chart:
www.tradingview.com
• On macro support (Sep 4):
Chart:
www.tradingview.com
• On mid-term resistance (Aug 6):
Chart:
www.tradingview.com
• On support and bounce potential (Jul 30):
Chart:
www.tradingview.com
rYojbaba Co., Ltd. (RYOJ) Is Gearing For A 200% Breakout rYojbaba Co., Ltd. (RYOJ) stock is gearing for a breakout from a bullish symmetrical triangle. While already up 119% in premarket trading, the asset is poised to claim the $5 resistance.
With just 2 months since IPO, the stock seems to break key resistance every month achieving impossible stints.
Next earnings date is slated for November 20th, 2025.
About RYOJ
rYojbaba Co., Ltd. provides consulting and health services to various customers in Japan. It operates through two segments, Consulting Services and Health Services. The Consulting Services segment offers labor and corporate consulting services to labor unions, companies to support the practice of whistleblowing and stress checks, and companies and labor unions to resolve disputes.

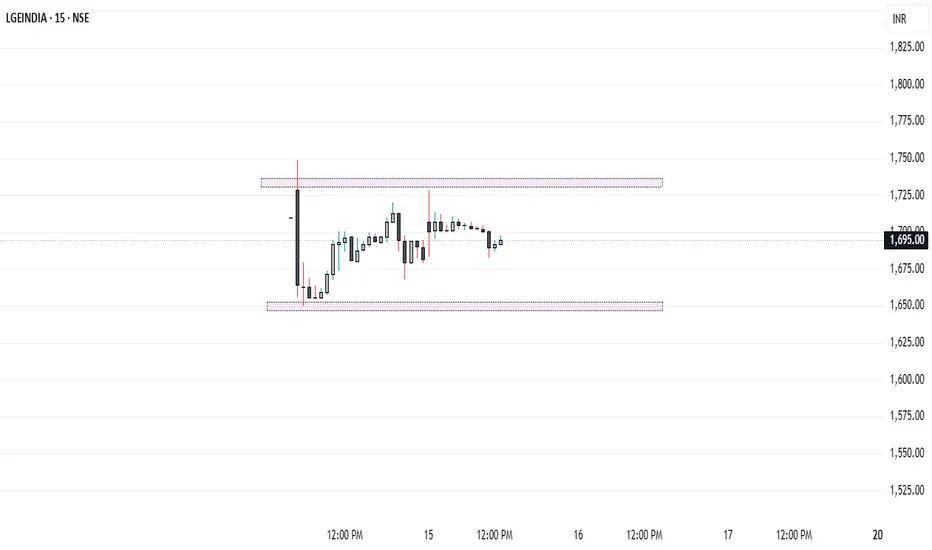
LG India IPO – Time to Hold or Fold? Key Level at ₹1650..!After an impressive 50% premium debut, LG India shares are now moving sideways, suggesting a healthy phase of consolidation as the market decides its next direction.
💼 If You Got the Allotment:
Stay patient and hold your position as long as the stock sustains above ₹1647–₹1650. This zone acts as a strong support base.
However, if the stock closes below this range by the end of the day, it could trigger a short-term breakdown — in that case, book your profits and exit smartly.
🚫 If You Missed the Allotment:
Avoid chasing the price! The stock has already listed at a hefty 50% premium, which limits near-term upside potential. Instead, wait for attractive entry zones if the price dips below ₹1647. Ideal buying levels to watch are around ₹1550, ₹1450, and ₹1350, marking 10%, 16%, and 21% corrections from the listing price.
⚖️ Conclusion:
At the moment, LG India is in a ‘wait and watch’ phase — holding above ₹1650 keeps the trend positive, but a daily close below it could invite profit booking.
Trade with patience, not emotion.
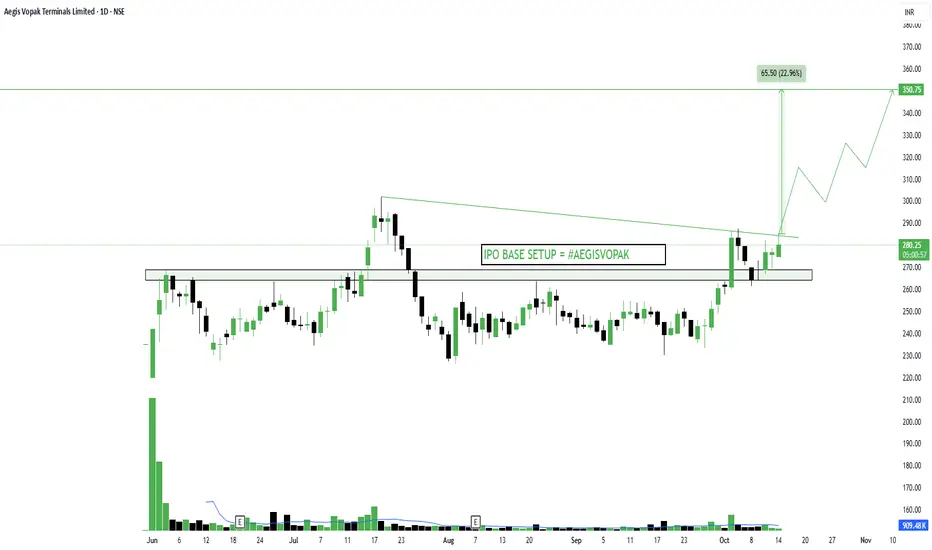
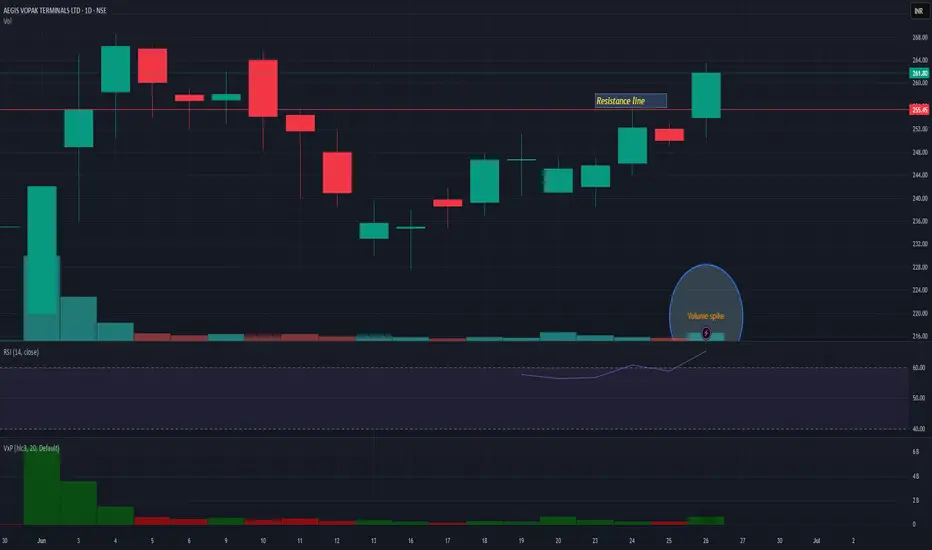
Aegis Vopak Terminals Ltd – IPO Base Setup in ProgressAegis Vopak Terminals Ltd – IPO Base Setup in Progress
NSE:AEGISVOPAK
📈 Pattern & Setup:
Aegis Vopak is forming a textbook IPO base setup after months of sideways action. The stock is holding firmly above its base support zone of 255–265, showing multiple shakeouts that flushed out weak hands while strong buyers kept absorbing supply.
The current price action shows a breakout attempt from a descending trendline with healthy volume recovery. A close above 285 could trigger a clean breakout, opening the path toward 340–350 levels.
📝 Trade Plan:
✍Entry: Above 285 (breakout confirmation)
🚩Stop-Loss: 260 (below the base support zone)
🎯Targets:
Target 1 → 320
Target 2 → 350 (23% potential move)
💡 Pyramiding Strategy:
1. Enter with 60% position on breakout above 285
2. Add 40% above 295 once it sustains with strong volume
3. Trail stop-loss to 270 after the price crosses 310
🧠 Logic Behind Selecting this Trade:
IPO bases are often early-stage setups where institutions quietly accumulate before a big expansion. Here, the price has repeatedly tested the upper range, each time with shallower corrections — a sign of strength. The stock now appears ready for a trending phase if it breaks above resistance with conviction.
Keep Learning. Keep Earning.
Let’s grow together 📚🎯
🔴Disclaimer:
This analysis is for educational purposes only. Not a buy/sell recommendation. Please do your own research or consult your financial advisor before trading.
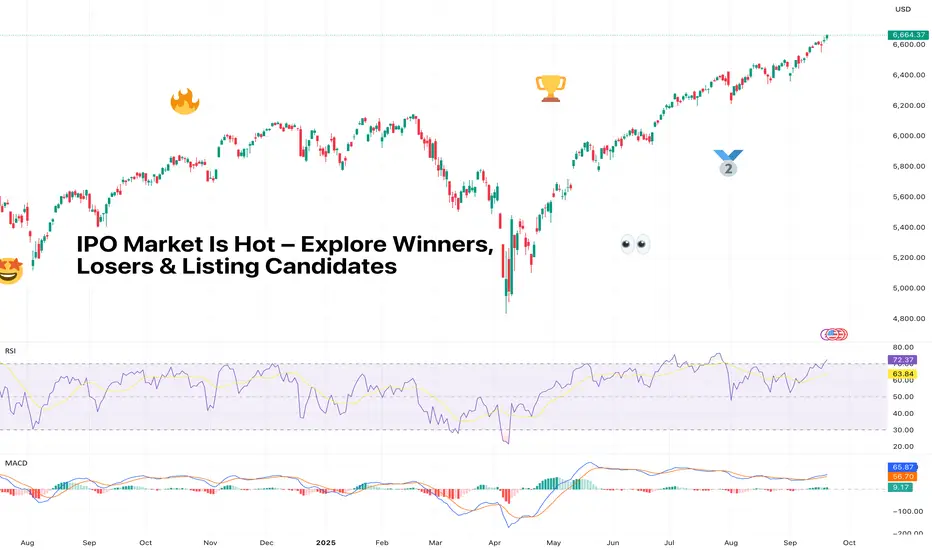
IPO Market Is Hot – Explore Winners, Losers & Listing CandidatesThe IPO market has woken up from its multi-year nap and is now in beast mode. But as always, Wall Street’s hottest party comes with an entrance fee and a dose of uncertainty – opaque prices, sketchy balance sheets, and a whole lot of FOMO.
So who’s winning, who’s losing, and who’s still waiting in the pipeline? Let’s find out.
🚀 The IPO Mania Returns
After years of drought, IPO mania is back in full swing. More than 150 companies have listed this year – up from 99 at this point in 2024 and just 76 in 2023, according to Renaissance Capital.
Together, they’ve raised nearly $30 billion, compared with $24 billion last year. First-day gains? Averaging 26%, the best since 2020. IPOs aren’t just back, they’re back with conviction.
Renaissance estimates we could see 40–60 more deals before the year is out. In other words, if you thought you missed the fun, the afterparty’s still ahead.
🤗 The Winners
Some debuts have been straight out of an IPO fantasy league.
Circle NYSE:CRCL , the stablecoin issuer, lit up the screens with a jaw-dropping 168% surge on its first trading day.
Firefly Aerospace NASDAQ:FLY , a rocket and lunar lander, blasted 30% higher on its IPO day, living up to its name.
Klarna NYSE:KLAR didn’t exactly moon, but a 15% pop for a lossmaking buy-now-pay-later firm isn’t shabby in this environment.
Then there’s Figure NASDAQ:FIGR , the blockchain-native mortgage lender. Since its listing in mid-September , it’s up 44% even after a midweek stumble. Investors love a fintech-meets-crypto mashup story – and Figure is playing it well.
Who said Figma NYSE:FIG ? The design software maker went vertical in its market debut , although reality has since slapped it down from those frothy day-one highs. Still, design nerds everywhere are proudly watching their favorite platform make its way up the rankings among the world's biggest software companies .
😭 The Losers
Not every IPO has the golden touch.
StubHub NYSE:STUB , the ticketing platform, came in hot with an 8% intraday pop above its $23.50 listing price, only to end its first session underwater at $22 . The days after? Even worse – the stock is floating near the $18 mark.
CoreWeave NASDAQ:CRWV , the AI up-and-comer, is a really interesting one. First off, it stumbled at the start after pricing its shares at $40 to float in March.
It traded under its IPO price for a while before clawing back with AI hype fueling the shares by 450% May through June. Then insider selling knocked the winds out of its sails in August.
Now it’s gravitating at triple its offering price, proving IPOs are a marathon, not a sprint.
🎲 The Pricing Game
The truth is, IPO pricing is as much science as it is art (and sometimes performance art). Investment banks like Goldman NYSE:GS , Morgan Stanley NYSE:MS , and Citi NYSE:C run the roadshows, build the books, and set the price. Oversubscribed IPOs often guarantee a strong open. Undersubscribed ones? Crickets.
Bears hate this one simple trick: most IPOs only float about 15–20% of the company. That tiny slice of tradable shares means volatility is baked into the flotation. Throw in a 180-day lockup (when insiders can’t sell), and early trading is a weird mix of price discovery and pure speculation.
💡 The Fundamentals Still Matter
The hype is real, but the numbers don’t lie. Valuations on some of these newly public firms are eye-watering. Circle trades at 130x earnings estimates, Figma at 184x. Compare that to Adobe’s 5x and you see how far the IPO froth can go.
Meanwhile, many of these firms aren’t consistently profitable. They post alternating quarters of red ink and black ink while investors cheer growth over everything.
🦄 Unicorn Watch: Who’s Next?
Here’s who’s buzzing on the IPO radar and what they’re worth in 2025:
• OpenAI, AI overlord, $500 billion
• SpaceX, rockets and satellites, $450 billion
• xAI / x.com, Elon Musk’s AI play, $200 billion
• Anthropic, OpenAI rival, $190 billion
• Databricks, data and AI analytics, $100 billion
• Stripe, payments giant, $92 billion
• Revolut, digital banking, $75 billion
• Canva, design platform (and your CV maker), $42 billion
• Fanatics, sports merch and betting, $30 billion
• Discord, chat for gamers (and everyone else), $15 billion
• Solera, software and data for auto and insurance, $10 billion
• Grayscale, crypto asset manager (part of Digital Currency Group), $10 billion
• AlphaSense, market intelligence, $4 billion
• Wealthfront, robo-advisor, $2 billion
• Quora, knowledge-sharing platform, $500 million
📉 The Risk of Chasing
So should you pile in? Here’s the trader’s dilemma: first-day pops are seductive, but inflated pricing means you’re often exit liquidity for early investors.
Waiting a few days, weeks, or even months for the froth to fade, lockups to expire, analyst coverage to roll in, and the hype to cool may be the smarter play.
🫶 Final Take
The current IPO season is hot, but so is the risk. But every IPO is different. Circle shows monster returns are possible, while StubHub proves not every ticker deserves a ticker-tape parade.
The winners? Companies with strong fundamentals (not just growth, but profits) and a story that Wall Street loves right now (AI, crypto, fintech).
The losers? Overpriced firms without consistent performance. The candidates? Mega-unicorns waiting for their grand entrance and some smaller players ready to make a splash.
As always, timing is everything. Here’s to hoping your favorite IPO won’t list right after a hawkish Jay Powell.
Off to you : What IPOs are on your radar for this year and the next? Share your thoughts in the comments!
Hesai Group (HSAI) – LiDAR Leader Gearing Up for a Global RunHesai NASDAQ:HSAI is a dominant force in automotive LiDAR, holding a 33% global market share. With a strong portfolio of next-gen sensors, the company is pushing boundaries in autonomous driving, robotics, and industrial automation.
🔹 Catalyst: Upcoming Hong Kong IPO ($475M target) adds global visibility, improves liquidity, and diversifies funding amid U.S.–China tensions.
🔹 Tech Edge: Showcased ETX and FTX models at IAA Mobility 2025 – leading in range, resolution, and solid-state design for L3/L4 autonomy.
🔹 Growth Path: Backed by OEM & Tier-1 partnerships, expanding globally with durable revenue streams.
💡 Bullish above $24.50–$25.00
🎯 Target zone: $40.00–$42.00
📊 Watching volume and price action closely into the IPO news cycle.
🧠 Tech + geopolitical tailwinds + market leadership = strong breakout potential.
#HSAI #LiDAR #AutonomousDriving #IPO #TechStocks

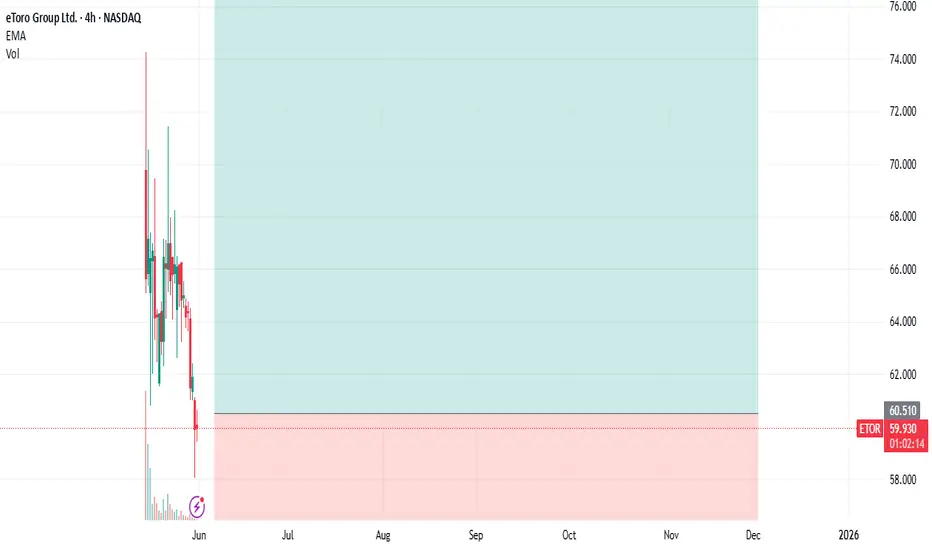
ETOR : Entry after IPOKind of social trading platform.
Etoro Platform also uses artificial intelligence.
I researched that it also allows trading of crypto assets.
$10B SPAC initiative canceled in 2022.
We re approaching mid 2025 .
Current market cap: around $5-5.3B.
Ground for progress may be present in good market conditions.
While institutions bought at $52, individuals were most likely able to buy above $70.
This was a great misfortune.
Very high opening of the IPO caused sharp sales, but holding for the medium term may be beneficial.As I briefly mentioned above, parameters that will bring momentum to stock may occur.
Constantly looking at the screen so much in such instruments can create a huge sense of panic and failure.
Target price: 90.00 - 94.00
Stop: 50.00
Amount: 1/3 of your portfolio's financial technology stocks ( e.g)
Risk - Reward Ratio > 2.80
Regards.
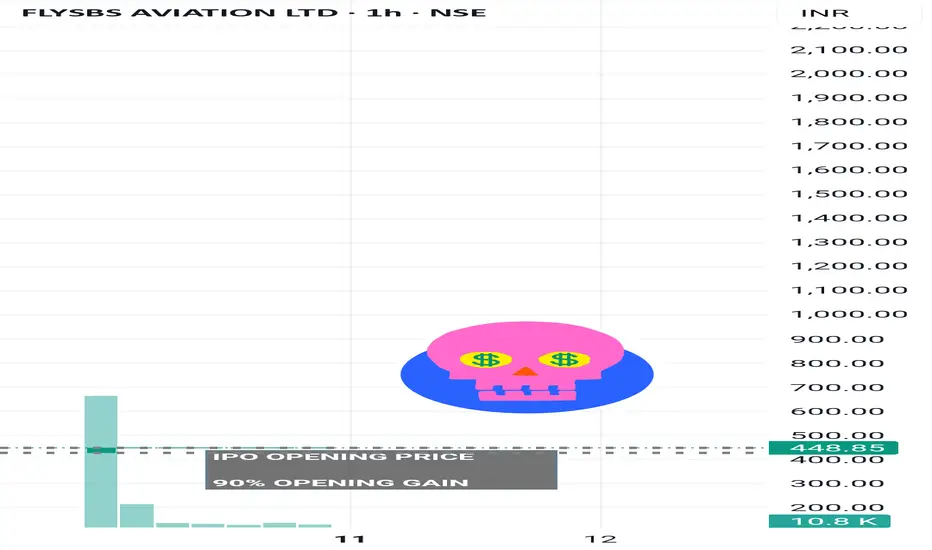
FlySBS Aviations –" Next decade "NSE:FLYSBS 🫰🏻 CONCLUSION 🫰🏻
With strong sector tailwinds, rapid fleet expansion, and clear operational scale-up plans, FlySBS Aviation is well positioned to deliver sustainable positive cash flows and attractive long-term returns, offering meaningful upside for investors as industry demand accelerates
🌸 Company Overview & Industry 🌸
-FlySBS Aviation is a private non-scheduled air charter operator serving B2B & B2C clients including corporates, HNIs, celebrities, and diplomats.
-Operates a fleet of 3 owned private jets plus dry/wet lease options to meet demand surges.
-The Indian private aviation market is growing rapidly, with an expected CAGR of 8–15% over the next decade
🌸FY2025 Sales (Total Revenue: ₹193.9 Cr)🌸
Private Jet Charters: 94% (₹182 Cr)
International Missions: 77% (₹149 Cr)
Domestic Charters: 23% (₹44.7 Cr)
Medical/Security Operations: 4% (₹8 Cr)
Subscription/Leasing: 2% (₹3 Cr)
🌸Financial Highlights (FY21–25)🌸
Revenue CAGR: ~63%
Net Profit CAGR: ~70%
Operating Margin: 21%
Net Profit Margin: 14.7%
ROE: 18.9%
EPS (FY25): ₹25.47
🌸DCF Valuation Insight🌸🫰🏻
Intrinsic Value: ~₹220 per share
Justification:
The valuation captures the expected transition from a heavy investment phase with negative free cash flow toward stable and positive cash flow generation.
The reliability is moderate, contingent on effective execution of growth plans and capital management aligned with market trends
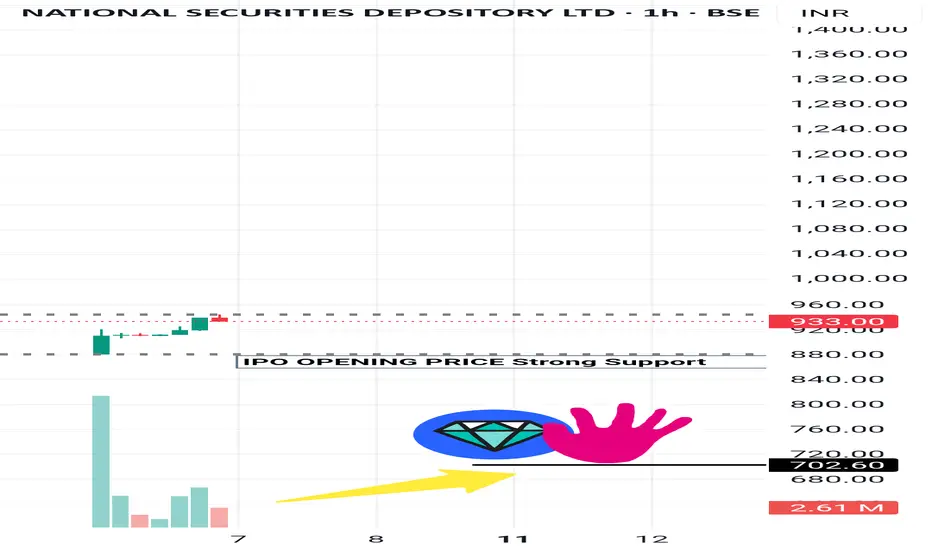
NSDL (INTRESTING STOCK )👉🏻 NSDL – Equity Snapshot 👈🏻
🕛 Conclusion ⏱️
NSDL stands at a strategic inflection point — evolving from an institutionally heavy, legacy infrastructure provider to a retail and digitally agile depository. With a zero-debt model, strong cash flows, and clear retail growth plans underway, NSDL shows potential for steady earnings expansion and margin improvement over the next few years. The foundation is strong; execution will now drive the delta.
🙋🏻 Introduction
India’s largest depository by value, with over ₹450 lakh crore in Assets Under Custody (AUC).
Founded in 1996, primarily serving institutional and corporate clients.
Known for stability, trust, and core infrastructure services in the capital market.
🌸 Financial Performance (FY25)🌸
Total Revenue: ₹1,535 crore.
Depository Business Revenue: ₹660 crore (Approx. 43% share).
Operating Margin (Core Business): ~50%.
Net Margin: 22% – 24%.
Net Profit: ₹330+ crore.
Free Cash Flow: ₹558 crore+.
Debt: Zero (Fully debt-free).
Capital Expenditure: ~₹74 crore only (Low capex model).
🌸 Market Position🌸
Dominates in value terms (highest AUC in India).
Client base includes mutual funds, banks, insurers, and corporates.
Retail demat accounts: ~4 crore (behind CDSL’s 15+ crore).
High average demat account size (~₹1,100 crore) vs CDSL’s retail-heavy base.
Gaining ground in retail via partnerships with Zerodha, Groww, Angel One, etc.
🌸 Future Growth Focus🌸
Aggressively entering retail segment through schemes like ‘YUVA Plan’.
Enabling paperless, digital onboarding for faster account growth.
Investing in blockchain, T+1 settlements, and smart compliance tools.
Actively participating in SEBI & RBI-led digitization (e-KYC, e-insurance, GIFT city).
Expanding subsidiaries (NDML, NPBL) to boost recurring income beyond core biz.
🌸 Key Positives🌸
Strong free cash flow, high annuity-based revenue visibility.
Lean, tech-driven operations with low employee cost base.
Well-positioned to benefit from India’s growing retail investor base.
Diversified, recurring revenue streams through subsidiaries.
Digital-first strategy ensures scalable, low-cost growth ahead.
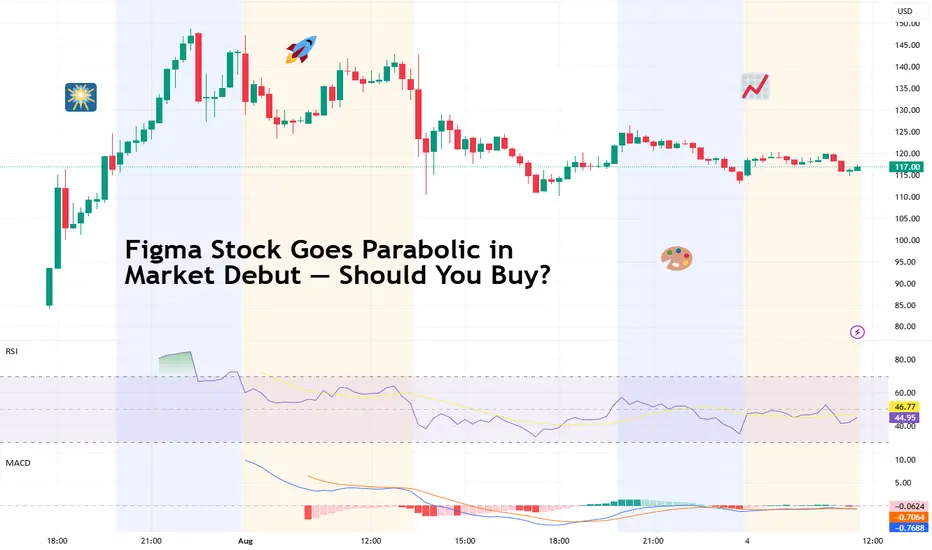
Figma Stock Goes Parabolic in Market Debut — Should You Buy?Figma stock NYSE:FIG more than tripled on IPO day. But that’s not thanks to the Figma guys — they had agreed to sell the company to Adobe NASDAQ:ADBE just two years ago.
Figma stock NYSE:FIG made a spectacular entrance into public markets last week — and then some. Shares of the design software firm surged 250% in their debut Thursday and climbed another 5% Friday, pushing the company’s fully diluted valuation to about half the size of Adobe NASDAQ:ADBE , the company that once tried to acquire Figma for $20 billion before regulators shut it down.
It’s a strong showing for the IPO market and a signal that investors are still willing to pay up for growth — even if the valuation raises more than a few eyebrows.
💸 $33 Becomes $118: Here’s What Happened
Figma priced its IPO at $33 per share on Wednesday, above the already-raised target range of $30–$32. The stock opened at $85, hit highs around $120, and closed the day up 250% . It ended Friday at $122, giving the company a fully diluted valuation of roughly $70 billion.
Quick stat: Figma pulled in $749 million in revenue last year. That means Figma’s price-to-sales ratio is sitting close to 94x. By contrast, Adobe trades at just under 11x sales. Froth or not?
📈 Growth Is Real — But So Is Volatility
The one big thing in Figma’s favor is growth. The company increased revenue by 48% last year and by another 46% in Q1 2025. But profitability is uneven. It posted a net loss of $732 million last year — a reversal from a $737 million profit in 2023 that was mostly boosted by a $1 billion breakup fee from Adobe. Without that one-off, the business hasn’t been consistently profitable.
In Q1 of this year, however, Figma did turn a small profit of $44.9 million. That’s a good sign — but it’s not enough to embrace a 94x multiple.
🤝 Who Uses Figma and Why It Matters
Figma isn’t just a trendy tool for designers — it’s widely used across big tech. Clients include Netflix NASDAQ:NFLX , Coinbase NASDAQ:COIN , Spotify NYSE:SPOT , and even the finance bros over at Vanguard. The software allows real-time collaboration, making it pretty attractive for remote or hybrid teams.
Its browser-based model and freemium pricing helped it spread fast during the pandemic, and now it’s seen as essential software for modern digital product teams. If you’ve ever opened a figma.com link during a Zoom call, you already know. “Can everyone see my screen?”
💎 Figma, the Bitcoin Holder
In a twist that feels very 2025, Figma disclosed in its filings that it holds Bitcoin BITSTAMP:BTCUSD . The company invested $55 million in the Bitwise Bitcoin ETF AMEX:BITB in March 2024 — and by March 2025, that stake had grown to nearly $70 million. They also bought $30 million worth of USD Coin CRYPTOCAP:USDC , which they plan to convert into more Bitcoin later on.
Figma’s treasury strategy echoes moves by companies like Strategy NASDAQ:MSTR , GameStop NYSE:GME , and Tesla NASDAQ:TSLA , and signals a growing trend among tech companies holding crypto on the balance sheet. It also adds another layer of volatility to Figma’s investment profile — though bulls might see it as a hedge.
🧾 IPO Cash and What Comes Next
Figma, as the newest entrant into the US stock market , raised over $1.2 billion from its IPO, capital it says will be used for general corporate purposes, product development, and potential acquisitions. Given its ambitious roadmap, that kind of cash cushion could help sustain growth — especially as it scales up competition with Adobe, Sketch, Canva, and Notion.
That said, being public also means new (and painful) expectations. Traders and investors will want to see steady top-line expansion, margin improvement, and a path to sustainable profit.
👀 Should You Buy the Stock Now?
The enthusiasm is clear — but so is the premium. Buying Figma now means paying 94x revenue for a company with promising growth but no long-term track record of profitability. That’s a tough sell for value investors but par for the course in growth tech — at least during bullish cycles.
If you're a long-term believer in the design software space and Figma's competitive edge, you may see upside. But for others, it might be worth watching a few quarters of earnings before jumping in. IPOs often pull back once the first wave of euphoria fades (and the insiders dump their stakes).
👉 Bottom Line
Figma’s market debut was one of the most successful of 2025 so far. The company has the brand, the user base, and the growth metrics to somewhat justify serious investor interest. But it also has a premium valuation and a patchy history of profitability.
Earlier this year, CoreWeave NASDAQ:CRWV (cloud computing and AI) and Circle Internet Group NYSE:CRCL (the stablecoin guys) stunned Wall Street with similarly turbocharged entries. It’s a unicorn stampede, and investors are chasing them like it’s 2021 all over again.
Off to you : Are you buying NYSE:FIG ? Holding off? Or just admiring the charts like a good minimalist designer?
OMSE falling wedge after IPONeutral on OMSE, another relatively new ticker. Similar to my previous post on DVLT, this ticker is fundamentally strong but stuck in a falling wedge after IPO. Price is struggling to break the daily 20EMA (overlayed on this 4H chart) and has rejected multiple times. The company has strong financials, take the time to do some DD, however this pattern could break to the downside and hit new lows before we see any type of rally given the weakness in this sector at the moment. Set alerts and watch the price action play out, or don't bet your rent money on any direction if entering a position.
I'm just a cat not a financial advisor.

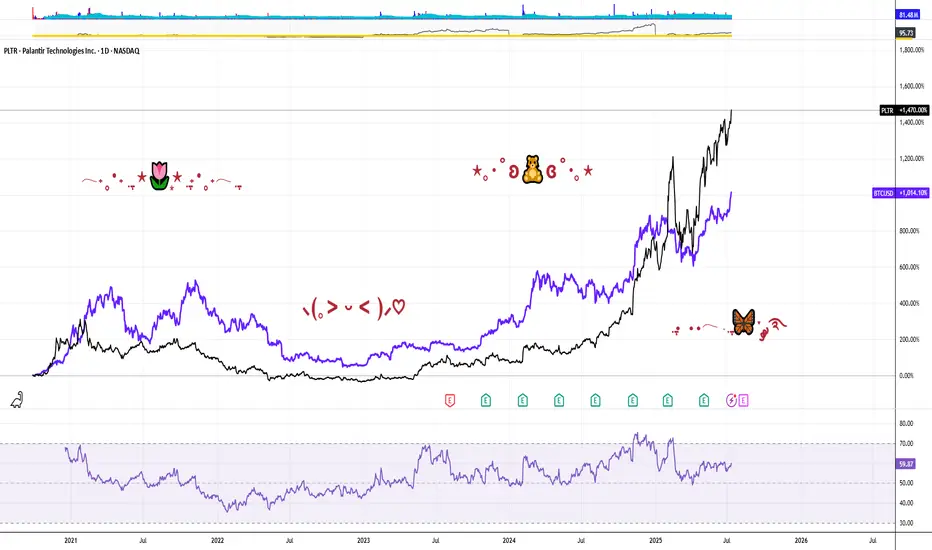
PALANTIR REMAINS YOUR TRADING GOAL, DOUBLING IN PRICE IN 2025In the Faraway Kingdom... In the Thirtieth Realm....
Somewhere in another Galaxy.. in late December, 2024 (yet before The Second Coming of Trump), @TradingView asked at it awesome Giveaway: Happy Holidays & Merry Christmas .
1️⃣ What was your best trade this year?
2️⃣ What is your trading goal for 2025?
Here's what we answered:
1️⃣ What was your best trade this year?
- Surely Palantir NASDAQ:PLTR 💖
I followed Palantir all the year since January, 2024, from $16 per share, watch here .
Current result is 5X, to $80 per share.
Also I added more Palantir after SP500 Index inclusion in September 2024 watch here .
Current result is 2.6X, from $30 to $80 per share.
2️⃣ What is your trading goal for 2025?
- Once again, surely Palantir NASDAQ:PLTR 💖
It's gone 7 months or so... (Wow... 7 months really? 😸😸😸)
Let see what's happened next at the main graph of Palantir stock, to LEARN WHY PALANTIR REMAINS THE TRADING GOAL, DOUBLING IN PRICE IN 2025...
Palantir stock remains an attractive trading goal for several compelling reasons rooted in its strong market performance, innovative technology, and robust growth prospects, particularly in the artificial intelligence (AI) sector.
1. Exceptional Stock Performance and Momentum.
Palantir Technologies has been one of the best-performing stocks in 2025, surging over 80% in the first half of the year alone, vastly outperforming the S&P 500’s modest 5.5% gain. The stock recently hit all-time highs around $149, reflecting a nearly 400% increase year-over-year, underscoring its strong momentum and investor enthusiasm. This surge positions Palantir as a top AI stock to watch, attracting both retail and institutional investors, including conservative entities like the Czech National Bank.
2. Leadership in AI and Data Analytics.
Palantir is not just a data analytics company; it has transformed into a major AI software provider with its Artificial Intelligence Platform (AIP). This platform extends beyond government contracts into commercial sectors such as healthcare, energy, and automotive, fueling significant revenue growth. The company reported a 39% revenue increase to $883.9 million in Q1 2025, driven largely by AI adoption. Its AI platform is gaining traction globally, with many companies rapidly adopting Palantir’s software through short training bootcamps, demonstrating scalable and fast integration.
3. Strong Government and Commercial Contracts.
Palantir’s roots in government intelligence and defense continue to be a significant revenue driver. The U.S. government division alone generated $373 million in Q1 2025, with overall government revenue up 45% year-over-year. Strategic partnerships, such as with Accenture to streamline federal operations and projects like the U.S. Navy’s ‘Warp Speed for Warships,’ highlight Palantir’s expanding footprint in critical government sectors. Simultaneously, the commercial segment is booming, with revenue soaring 71% to $255 million in Q1 and projected to reach $1.178 billion in 2025.
4. Financial Health and Growth Outlook.
Palantir’s financials are strengthening, with no debt and adjusted free cash flow more than doubling to $370.4 million in the recent quarter. Analysts forecast the company’s revenue to exceed $3.5 billion in 2025, up from $2.23 billion the previous year, and project potential revenue of $7 billion by 2028. Operating margins are improving, with a recent quarter reporting a 26% margin, the highest in company history. This solid financial foundation supports further investment in AI innovation and market expansion.
5. Market Position and Competitive Edge.
While Palantir competes with tech giants like Microsoft, Amazon, and Google in the AI and data analytics space, it has carved out a unique niche with its specialized government contracts and AI-driven software solutions. Its ability to integrate complex datasets for real-world operational use distinguishes it from competitors, fostering a loyal investor base and a "cult-like" following among retail investors.
6. High Valuation Reflects Growth Expectations.
Despite a high price-to-earnings ratio (PE around 621), reflecting elevated expectations, many analysts remain optimistic about Palantir’s long-term potential due to its rapid growth and expanding AI capabilities. The company’s market capitalization has soared above $330 billion, surpassing many established corporations, signaling strong market confidence.
7. Palantir stock is a compelling trading goal because it combines robust growth, cutting-edge AI technology, strong government and commercial contracts, and solid financial health.
8. In conclusion, Palantir remarkable stock performance and strategic positioning in the booming AI sector make it a promising investment for traders seeking exposure to transformative technology with significant upside potential.
9. ...and yet, Palantir performance since inception (It ultimately went public on the New York Stock Exchange through a direct public offering on September 30, 2020) is better, rather then Bitcoin.
--
Best wishes,
@PandorraResearch Team 😎
MAMATA - Head & Shoulder patternComment below what you observe in the chart.
All details are given on chart for educational purpose only. If you like the analyses please do share it with your friends, like and follow me for more such interesting charts.
Disc - Am not a SEBI registered analyst. Please do your own analyses before taking position. Details provided on chart is only for educational purposes and not a trading recommendation

New Listed HDB ReportNSE:HDBFS
Good listing today.
But not perfect positive close.
Please follow to points details from chart.

AEGISVOPAKAEGISVOPAK is coming out from small consolidation and giving decent volume today. 250 is very strong support. It may face next resistance nr 290 level.
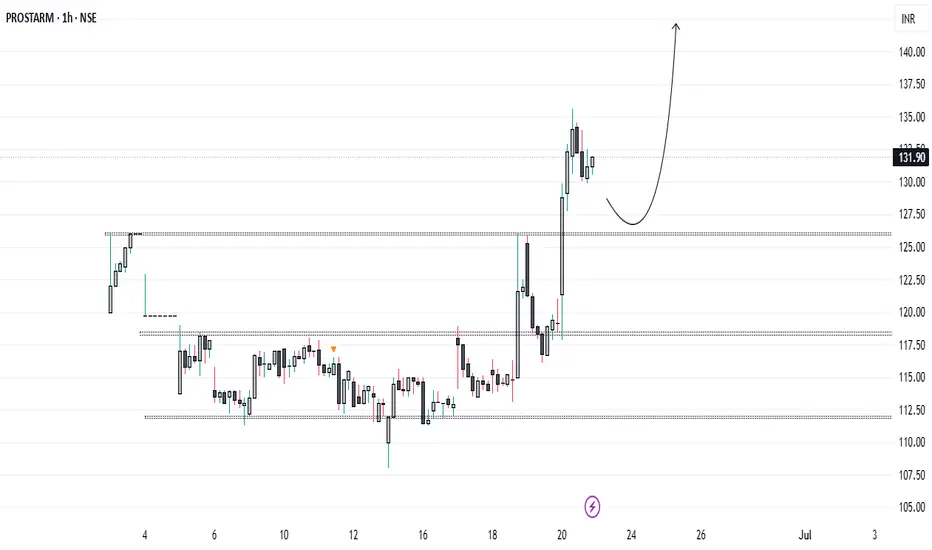
What’s Next for PROSTARM Investors...?Prostarm has decisively broken its all-time high. Since its IPO on June 3rd, it has successfully surpassed the major resistance level of 126 and is holding strong above it. We should take advantage of this opportunity and establish a long position on the retest of the 126 level.
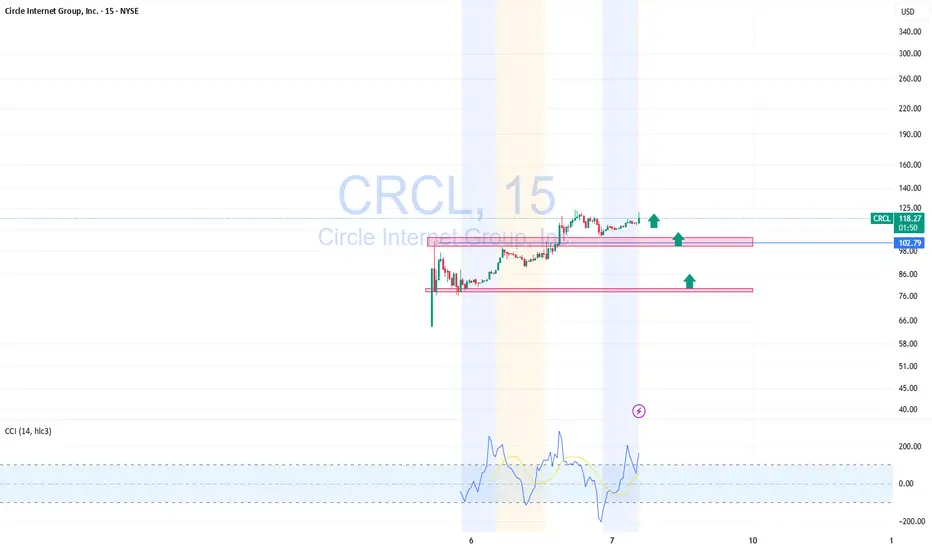
Buying CRCL after IPO — expecting a strong move like SEZLCRCL just hit the market after its IPO and is already showing signs of strength. This setup reminds me a lot of SEZL — after it went public, we saw a strong consolidation phase followed by a confident rally.
Right now, CRCL looks like it’s building a solid base. I'm starting to buy around current levels, expecting demand to grow. As long as the structure holds and buyers stay active, I see a good chance for continuation to the upside.
New IPOs like this often attract attention, and I’m treating it as an early opportunity. Same playbook as SEZL — patience and positioning.
zSpace (IPO) NEW LISTINGA tech company called zSpace priced very low inline with the types of people that like to buy low cost stock, i.e. cryptocurrency investors. As for what the company does and if the company will succeed, only time will tell.
