IREN's Correction Within a Stellar Long-Term UptrendIris Energy Limited (IREN) is experiencing a period of consolidation and corrective pressure following its meteoric rise earlier in the year. The stock is currently down 2.7% in today's session, trading at $42.67. However, this recent pullback must be viewed within the broader, explosive context of its performance over the past nine months. Despite the current weakness, IREN still commands an astounding year-to-date gain of over 532%, firmly establishing it as one of the market's standout performers for the period.
The stock's technical picture illustrates a clear transition from a parabolic rally to a phase of digestion and support-testing. After reaching an all-time high of $76.87 on November 5, the equity has undergone a significant but orderly retracement. It has since entered a critical zone, where it is now testing and consolidating around a major support floor near the $40 level. This price point represents a key psychological and technical area where buyers have previously stepped in, and its defense is crucial for maintaining the longer-term bullish structure.
Adding to the near-term headwind is the dynamic resistance presented by the stock's descending 20-day moving average. This short-term trend indicator, which had previously served as support during the uptrend, has now flipped roles. It is curving downward and capping recent rally attempts, acting as an overhead ceiling that reinforces the corrective phase. A decisive break back above this moving average would be an early technical signal that the immediate selling pressure is abating and that the stock may be ready to stabilize.
In summary, while IREN is navigating a predictable and healthy correction after its historic run—facing defined technical resistance from its 20-day moving average—the overarching narrative remains overwhelmingly bullish. The primary focus for investors is whether the critical $40 support zone will hold. A successful defense of this level could lay the groundwork for the next leg higher, allowing the stock to absorb its gains and build a new foundation from which to advance, still carrying its remarkable 532% lead for the year.
IREN

$IRENIn a bold strategic move to solidify and fund its pivot from cryptocurrency mining to artificial intelligence infrastructure, Iren executed a massive $3.6 billion capital raise on December 3rd. This complex financing package, structured through both equity and long-term convertible debt, is designed to provide the low-cost capital necessary for its aggressive AI expansion while meticulously managing the dilution for existing shareholders. The market responded positively to the news, with Iren's stock surging 6.9% on the day of the announcement, signaling approval for the company's refined financial strategy.
The capital raise is bifurcated into two primary components, each serving a distinct purpose. The first is a $2 billion private offering of convertible notes, divided into two series: $1 billion with a 0.25% coupon due in 2032, and another $1 billion with a 1.00% coupon due in 2033. These notes provide Iren with long-dated, exceptionally low-cost capital. Crucially, the conversion price for both series is set at approximately $51.40 per ordinary share, representing a significant 25% premium to Iren's closing price of $43.68 on December 3rd. This high conversion barrier delays potential equity dilution. Furthermore, Iren has entered into "capped call" transactions, which are derivative instruments that effectively raise the share price at which dilution would meaningfully begin to $82.24 per share, offering substantial additional protection to current stockholders.
The second, parallel component is a $1.632 billion direct equity offering, where 39.7 million shares were sold at $41.12 each. A key strategic rationale for this equity raise is to address and eliminate older, more dilutive obligations. The proceeds are earmarked to repurchase and extinguish the company's existing convertible notes maturing in 2029 and 2030, which carry far lower conversion prices of $13.64 and $16.81, respectively. By clearing these "overhang" notes from its balance sheet using freshly raised equity, Iren is proactively streamlining its capital structure and removing a source of future dilution that was priced at a steep discount to the current market.
If noteholders exercise their option to purchase an additional $150 million in each series of the new convertible notes, the total gross proceeds could reach approximately $2.27 billion. Iren intends to use these funds, after covering the $174.8 million cost of the capped calls, to repurchase other portions of its existing debt and, most importantly, to invest in the rapid expansion of its AI data center infrastructure.
This colossal fundraising effort underscores Iren's determined transformation. Formerly an Australian Bitcoin mining leader, the company has strategically redirected its substantial energy assets and operational expertise toward the high-growth AI infrastructure sector over the past year—a pivot reflected in a 200% increase in its stock price during that period. The company is leveraging its core strength: access to immense power resources. It currently controls 2.9 gigawatts of grid-connected power across North America and operates 810 MW of active data centers. A landmark validation of its new direction is a five-year, $9.7 billion GPU cloud services contract with Microsoft, under which Iren will supply AI computing capacity powered by NVIDIA's advanced GB300 chips from its 750-megawatt campus in Texas.
Despite this strong strategic positioning, Iren's stock, like many in the high-flying AI sector, has not been immune to volatility. It recently faced a pullback, declining 36% over the past month and remaining down approximately 11% for the week, partly driven by broader market fears surrounding the sustainability of AI investment valuations.
From a technical analysis perspective, this recent sell-off brings key support levels into focus. Should the price action breach its immediate or main support level, analysts would then closely monitor the next major floor, identified as Support 2. A successful hold at this secondary support zone could provide a foundation for the stock to consolidate and potentially rebound, as the market continues to digest the implications of Iren's strengthened balance sheet and its multi-billion-dollar bet on the future of AI compute. The successful closing of these offerings, expected on December 8th subject to customary conditions, will mark a critical milestone in Iren's journey to establish itself as a next-generation AI infrastructure leader.

$IREN: A Period of Consolidation with Defined Risk ParametersNot much change on $IREN. The price action for NASDAQ:IREN currently reflects a period of lateral consolidation and equilibrium, with neither bulls nor bears establishing clear dominance in the near term. This pause follows previous volatility and represents a critical juncture where the asset is building energy for its next significant directional move. While there have been no major fundamental catalysts to alter the overarching narrative recently, the technical framework provides clear levels to monitor for the next phase.
Key Technical Levels and Scenarios
The market structure is defined by two primary support zones, which will act as the battlefield for control.
Immediate Bull Line (Support 1): This is the first and most crucial level of defense for the bullish thesis. A sustained hold above this zone suggests that underlying demand remains intact and that the consolidation is merely a pause within a larger positive trend. It represents the line where buyers have historically stepped in.
Secondary Support (Support 2): This lower level represents a more significant technical and psychological area. A breakdown below Support 1 would shift market sentiment negatively, increasing the likelihood of a test at Support 2. A successful hold here would indicate a deeper, but still valid, correction. However, a failure at this second tier would signal a more profound deterioration of the bullish structure and could open the door to further declines.
Strategic Outlook and Profit-Taking Horizon
Despite the current quietude, the broader strategic outlook maintains a bullish bias contingent on holding key supports. The consolidation is viewed not as a reversal of trend, but as a necessary period of digestion.
The primary upside objective remains a take-profit target in the vicinity of $60. This level is derived from a combination of technical measurements, including previous chart structure, Fibonacci extensions, and the implied momentum of the prior trend. A successful rally from either Support 1 or a robust rebound from Support 2 would project price action toward this target zone.
Conclusion
In essence, NASDAQ:IREN is in a holding pattern. "Not much change" signifies a buildup of potential energy. Traders and investors should now watch for a decisive break from this equilibrium, with a close watch maintained on Support 1 as the immediate bellwether. A hold there keeps the path to the $60 target clear, while a break lower would pivot focus to the durability of Support 2 and necessitate a recalibration of the near-term timeline for upward movement.

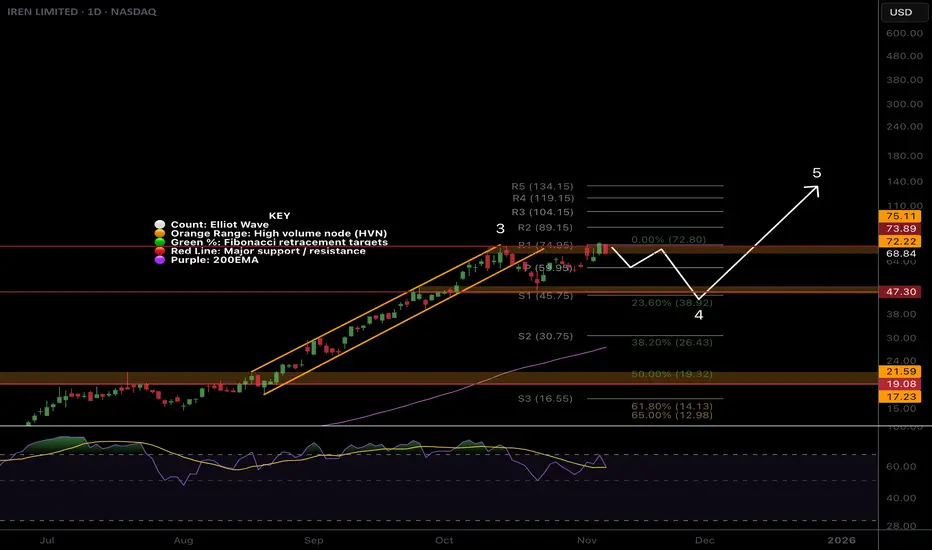
IREN Well overextended.... deeper pullback before upsideNASDAQ:IREN Price has overextended in a macro wave 3, the strongest and most powerful move described as a “wonder to behold” by Elliotticians. Novice investors are likely to get over-confident in these conditions, enter without risk management and keep chasing the price upwards only to be underwater when it turns around.
Profit taking appears to be taking place. I have closed my positions and am waiting for re-entry. The weekly pivots have been run.
Initial downside targets for wave (4) have been hit $39, the next is 0.382, $26.43. Expect shorts to pile in, adding to any downside momentum.
In the long term, we have higher to go in wave (5).
🎯 Terminal target for the business cycle could see prices as high as $124 based on daily pivots
📈 Weekly RSI hit overbought with no divergence
👉 Analysis is invalidated if we continue into price discovery
Safe trading

IREN, still lower to go...NASDAQ:IREN wave 4 appears to want one more pusher lower towards the daily 200EMA and 0.382 Fibonacci retracement.
Price has broken its uptrend on bearish divergence and is yet to show strong support, suggesting we continue lower next week.
📈 Daily RSI has printed a bullish divergence, but not from oversold
👉 Continued downside has a target of the daily 200EMA, $26.75
Safe trading

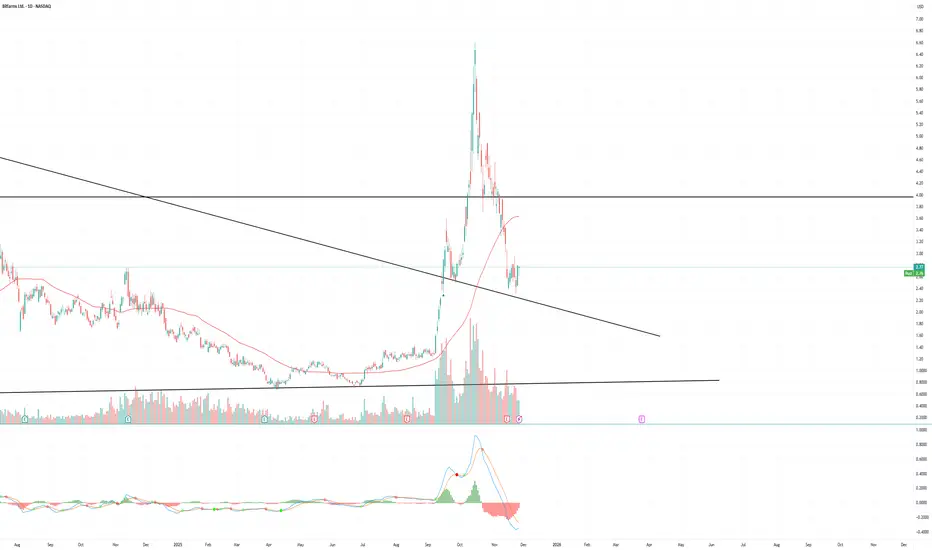
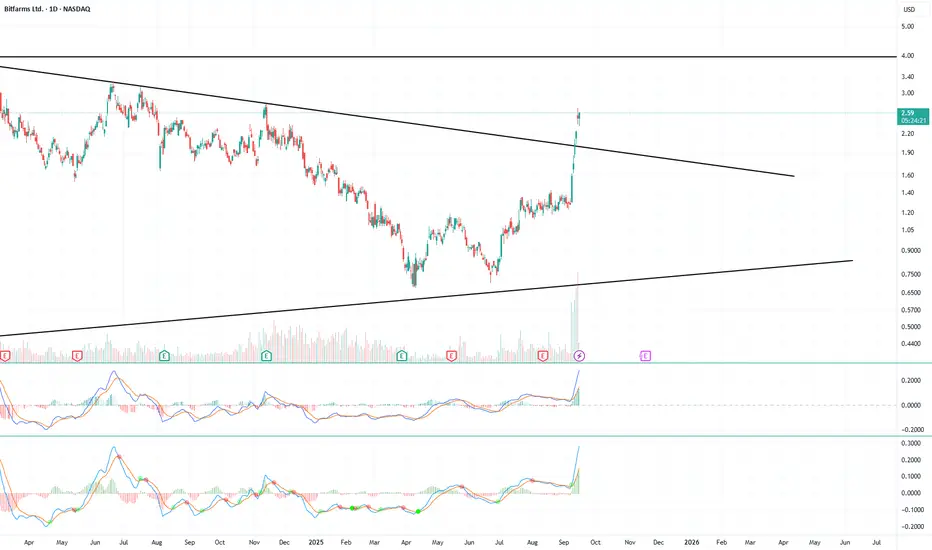
Is it time to reload $BITF? We caught the breakout in NASDAQ:BITF when it was below 3 earlier this year. It ripped all the way to $6+. Since then, the stock imploded back to the original crime scene amidst the AI overvaluation selloff. The $2.30 area provides good support and the stock has reacted off that level. If Bitfarms can scale its entrance into AI/HPC capabilities, the stock should be able to see the $3.8-4 area barring any further market selloff on AI names.
Stock is current trading around $2.70. I would put my stop at $2.30 if taking this idea.
Best of luck if tailing.
IREN charges up after the pullbackThe price of IREN pulled back to the lower boundary of the expanding channel and touched the 100 period moving average on the 8 hour chart. The 48 zone acted as support earlier and buyers are showing interest there again. A base is forming. A breakout above 62 can activate movement toward 76 and later 100 where the next expansion target sits.
IREN operates large scale data centers and high performance computing infrastructure including bitcoin mining and enterprise hosting. The key advantage of the company is access to low cost renewable energy which keeps hash rate costs low and allows stable scaling.
The fundamental picture on November 26 remains stable. The company continues to expand its data center capacity. Leverage stays low. The bitcoin network maintains strong activity which supports revenue. Hash rate competition increases but operators with cheap energy access like IREN gradually strengthen their market position.
As long as the price stays above the 48 zone and above the 100 period moving average the recovery structure remains valid. A confirmed move above 62 opens the path to 76 and then 100 . A move below 48 will return price to deeper consolidation.
Even miners need a pause to recharge but after such pullbacks energy normally returns very quickly.

Technical Analysis On $IREN: A Potential Reversal in the MakingThe technical structure for this asset is exhibiting compelling signs that a significant low may be forming, suggesting the prolonged downtrend could be exhausting and a reversal phase may be underway. The convergence of key Fibonacci levels and emerging bullish signals creates a narrative worthy of close attention.
1. The Macro View: A Likely Bottom Formation
The assessment that the asset has "most likely bottomed" is based on key technical behaviors. This typically involves a period of price consolidation at lower levels, a slowing of downward momentum (as indicated by potential bullish divergences on oscillators like the RSI or MACD), and a clear rejection of further lows. This price action suggests that selling pressure is drying up and a new equilibrium is being established, providing a foundation for a potential new upward cycle.
2. The Fibonacci Framework: A Roadmap for the Reversal
Fibonacci retracement levels, applied to the most recent significant downtrend, provide a mathematical roadmap for identifying potential support, entry zones, and profit targets.
Primary Support (The 0.5 Fibonacci Level - $41): This level at $41 has acted as a critical foundation. The successful defense of this 0.50 retracement level is a strong technical sign. It represents a key psychological midpoint where buyers have historically stepped in with force, preventing further decline and solidifying this zone as the primary support floor for the new bullish thesis. A break below this level would seriously challenge the bottoming narrative.
Buy Zone (The 0.382 Fibonacci Level - $49.47): The $49.47 level is identified as a strategic accumulation zone. In a recovering market, prices often pull back to retest former resistance levels, which then turn into new support. A successful retest of the 0.382 level at $49.47, where the price touches this area and bounces, would offer a high-confidence entry point with a well-defined risk level just below the primary $41 support.
3. Profit-Taking Strategy and Emerging Signals
Take-Profit Targets: The initial recovery move has two clear technical objectives.
Initial Target: $55. This represents the first significant resistance zone where some profit-taking can be expected.
Extended Target: $59. A break above $55 opens the path to this more substantial target, which likely aligns with a previous swing high or a key Fibonacci extension level.
Potential Buy Signal (Blue Vertical Lines): Your observation of the "blue vertical lines" indicating a potential buy signal is crucial. This typically refers to a specific trigger from a momentum oscillator or a proprietary indicator. This signal adds a layer of confirmation, suggesting that not only is the price at a supportive level, but the underlying momentum is also shifting from bearish to bullish. This alignment between price (Fibonacci level) and momentum (buy signal) significantly strengthens the case for a sustainable upward move.
Synthesis and Strategic Outlook
The technical picture suggests the asset is in the early stages of a potential trend reversal.
The Bullish Narrative: The bottom appears to be in at the $41 (0.50 Fib) support. The strategy is to look for entry opportunities, ideally on a pullback towards the $49.47 (0.382 Fib) buy zone, especially if it coincides with a confirmed buy signal from your indicator (the blue vertical lines). The subsequent targets are $55 and $59.
Risk Management: The entire bullish thesis depends on the asset holding above the $41 support. A decisive break below this level would invalidate the bottoming premise and call for a re-evaluation.
In summary, patience is key. The setup is promising, but waiting for the price to interact with the defined buy zone and for confirming signals to align will provide a much higher-probability entry for the anticipated move toward the $55 and $59 targets.
$IREN Fib projectionsNASDAQ:IREN has found support at the Fibonacci 1.0 level as well as the 55 EMA.
The next target to watch for is the 1.382 Fibonacci ratio, or potentially even the 1.618 Fibonacci extension.
So far, this could still be considered an ABC correction. However, if we surpass these targets in a five-wave downward movement, we might see even lower prices.
I do not currently hold a position in this stock, but I hope this information helps someone.

$IREN 1. Executive Summary:
Iris Energy ( NASDAQ:IREN ) is exhibiting a constructive technical structure within a defined bullish trend observed on August 1st. The immediate catalyst is the company's recent earnings release, which typically induces significant volatility. The primary expectation is for a positive price movement; however, a retracement to a key support zone is a standard and healthy reaction post-event. The chart suggests the potential early-stage formation of a head and shoulders pattern, which is a bullish continuation signal in this context. Key Fibonacci retracement levels provide a clear roadmap for potential support at $59.94 (0.236), $49.47 (0.382), and $41.00 (0.50). A successful hold at these levels, coupled with strong market performance, could pave the way for a significant upward move, with a long-term target exceeding $80.
2. Market Context & Catalyst Analysis:
Prevailing Trend: The stock is operating within a broader bullish trend, indicating that the underlying market sentiment has been positive.
Earnings Catalyst: The earnings release on the same day is a fundamental catalyst that can override short-term technicals. The statement "we expect it to rise or hit the support zone" accurately captures the two most probable outcomes:
Bullish Reaction: The earnings report exceeds market expectations, fueling a direct price rise as new buyers enter.
"Buy the Rumor, Sell the News" Reaction: Even with good earnings, a short-term pullback to a key support level is common as traders take profits. This is not inherently bearish but rather a mechanism to build a stronger foundation for the next leg up.
3. Technical Pattern Analysis: Head and Shoulders
Clarification on Pattern Type: The mention of a "head and shoulders pattern" in a bull market likely refers to the Inverse Head and Shoulders pattern. This is a classic bullish reversal or continuation pattern.
Pattern Structure: It is characterized by three troughs: a left shoulder (decline), a deeper head (lower low), and a higher right shoulder, all formed at a support level. The pattern is confirmed when the price breaks above the "neckline" resistance.
Implication: The potential formation of this pattern aligns with the bullish thesis, suggesting that any current consolidation or pullback is likely a period of accumulation before a potential breakout.
4. Fibonacci Retracement & Strategic Support Levels:
The Fibonacci retracement tool, applied to the most recent significant upward wave, provides objective levels for potential buyer entry during a pullback.
Shallow Support (0.236 - $59.94): This is the first and strongest level of support. A bounce from here indicates very robust bullish momentum and suggests the pullback is merely a minor pause.
Moderate Support (0.382 - $49.47): A retracement to this level is considered a healthy and deep correction within a bull trend. It offers a potential high-probability entry point for buyers who missed the initial move.
Deep Support (0.50 - $41.00): This represents a 50% retracement of the prior up-move and is a critical "line in the sand" for the bullish trend. A failure to hold here would call the short-term bullish structure into question.
5. Price Projection & Risk Management:
Upside Target ($80+): The $80+ target is feasible if the stock successfully defends one of the key Fibonacci support levels and subsequently breaks above its recent highs (likely the "neckline" of the potential inverse Head and Shoulders pattern). This would project a measured move higher, potentially fueled by the positive earnings momentum.
Risk Management: The identified support levels ($59.94, $49.47, $41.00) also serve as logical areas for strategic stop-loss orders. A decisive break below the $41.00 (0.50) level, especially on high volume, would invalidate the immediate bullish setup and signal a potential for a deeper correction.
Conclusion:
In summary, the outlook for NASDAQ:IREN is bullish, supported by a positive earnings catalyst and a constructive technical chart showing a potential inverse Head and Shoulders formation. While a move higher is expected, a retracement to the Fibonacci support zone between $59.94 and $41.00 would be a normal and potentially opportunistic event. The bullish thesis, culminating in a run towards $80+, remains contingent upon the stock maintaining its core support structure and capitalizing on the positive fundamental news.

IREN pullback on the cardsNASDAQ:IREN is breaking out again on huge candle spread, though I am skeptical of continued rally from here without a pullback first. For now the trend is up.
Price has broken out of its momentum channel and formed a range so I am expecting the excitement to trap late comers and traders with a swift reversal in wave 4. Initial downside target is $47 at the High Volume Node and .0236 Fibonacci retracemenet. Stronger downside momentum could test the rising daily 200EMA at the 0.382 Fibs.
Daily RSI has printed unconfirmed bullish divergence at the EQ.
Continued upside keeps us looking at the pivot targets.
IREN 5M Short Conservative Trend DayTradeConservative Trend Trade
+ short impulse
+ unvolumed T2
+ resistance zone
- before 1/2 correction
+ strong approach
+ volumed 2Ut+
+ weak test
+ first bullish bar close entry
Calculated affordable virtual stop loss
1 to 2 R/R take profit within 5M range
Bought put
1D Trend
"- short balance
+ volumed T2
+ resistance zone
+ 1/2 correction
- strong approach
+ biggest volume 2Ut-"
1M CounterTrend
"- long impulse
+ volumed T1
+ resistance zone
+ weak approach
+ biggest volume Ut
+ test"
1Y CounterTrend
"- long impulse
= neutral zone
+ exhaustion volume?"

IREN ready for pullback?Price has overextended in a macro wave 3, the strongest and most powerful move described as a “wonder to behold” by Ellioticians. Novice investors are likely to get over-confident in these conditions, enter without risk management and keep chasing price upwards only to be underwater when it turns around.
Profit taking appears to be taking place, I have closed my positions waiting for re-entry. The weekly pivots have been ran.
Initial downside targets for wave (4) is the 0.236 Fib retracement at $39 followed by the 0.382, $26.43. Expect shorts to pile in adding to any downside momentum.
In the long term we have higher to go towards $100 in wave (5).
🎯 Terminal target for the business cycle could see prices as high as $100 based on Fibonacci extensions
📈 Weekly RSI is oversold with no divergence and can remain here for months as price keeps increasing.
👉 Analysis is invalidated if we close back below the weekly 200EMA

IREN Exhausted? PUllback time?IREN wave (3) ran incredibly and I am looking for a deeper pullback as people begin to take profit. I have closed my positions at a 10x and am waiting for re-entry. The weekly pivots have been ran, RSI is at max overbought but can remain here for months (as it has done).
Initial downside targets for wave (4) is the 0.236 Fib retracement at $39 followed by the 0.382, $26.43. Expect shorts to pile in adding to any downside momentum.
In the long term I believe we have much higher to go towards $100 in wave (5).
Safe trading

Is the breakout in $BITF sustainable? Is the breakout in NASDAQ:BITF sustainable?
After we saw names like CIRF and IREN rage due to the potential use mining setups for AI data center and infrastructure. Could this name get a sympathy move to $4?
Already up a bunch from the lows but I think there is further upside. Idea invalidated with a move below 2.35
IREN Wont Quit! Fib extension Analogue targets..NASDAQ:IREN Has ran all the weekly pivot in an astonishing wave III. RSI is extremely overbought.
The next Fibonacci extension targets (analogue scale) are the 3.618 at $59 and the 4.236 at $68 for a wave 3 termination.
Fibonacci log targets are as high as $400 but this seems unrealistic so switched to analogue in this case! Stranger things have happened still...
Safe trading

IREN still in the bull-trend range!NASDAQ:IREN continues upwards in a tight bullish channel but how long can this extend? R5 pivot targets suggest $65.
Bearish divergence in overbought RSI keeps being negated for now.
Wave (4) downside target is currently the 38.2 Fibonacci retracement at $30.44 and this iwll extend higher as long as price does.
Safe trading

IREN Wave 3 complete Wave 3 appears to be complete with a thrust above the weekly R5 pivot on NASDAQ:IREN .
Sentiment is extremely greed on social and mainstream media warning of a top.
Wave 4 has a target of the R3 pivot and 23.6 Fibonacci retracement at $28, new traders and investors will be trapped buying the hype...
I will look for new longs in this area as I think we go higher long term...
Safe trading

IREN - BULLISH RISING WINDOW at ALL TIME HIGH ZONEIREN - CURRENT PRICE : 27.00 - 28.00
The stock is bullish as the share price is above 50-day SMA. This bullish scenario is strengthened by the rising support line. Yesterday the stock made a rising window with high trading activity - indicating bullish continuation trend.
In JAPANESE CANDLESTICK THEORY, a rising window's low should acts as strong support level. As such, as long as IREN share price maintain above 24.29 the outlook remain bullish. Technically 25.00 until 28.00 will be a good entry point for buying.
ENTRY PRICE : 25.00 - 28.00
TARGET : 31.00 and 34.00
SUPPORT : 24.00 (CUTLOSS below 24.00 on closing basis)

Could this be the next $IREN?NASDAQ:CIFR
Ended the week with a green big wick candle.
A follow through to the upside next week and a close above the cupnhandle breakout area means big things for this stock.
Breakout = $9.65/ $14 🎯

IREN Bear Divergence on the Daily, Deeper Pullback Ahead?NASDAQ:IREN appears to be pulling back locally in wave 4, filling the gap, with eyes on testing the daily pivot as support before continuing higher.
Price is significantly away from mean and catching continued momentum but this will fade as more people take profit.
Bearish divergence persists in the daily RSI and has been confirmed with the close below the signal line. If these signals fail it shows the strength of the momentum trend.
Continued upside target is playing the pivots to $40 and initial downside taregt is the previous all time high at $18.50
Safe trading

Smart Money LOVES IREN--BULLS LOADING IREN 31C
# 🚀 IREN WEEKLY CALLS ALERT (2025-09-01) 🐂💎
### 📊 Consensus Signal → **STRONG BULLISH**
* ✅ RSI Daily 80 / Weekly 87.5 → Momentum maxed 📈
* ✅ Volume 🔺1.4x → Institutional accumulation 💼
* ✅ Options Flow: Call/Put = 1.68 → Bullish bias 💥
* ✅ Low VIX (\~15.4) → Perfect environment for calls 🎯
---
### 🎯 TRADE SETUP
👉 **IREN 31C (2025-09-05)**
💵 Entry: \~\$0.67 (ask)
🛑 Stop: \$0.33 (-50%)
🎯 Target: \$1.35 (+100%)
📏 Size: 1 contract (risk ≤ 1–3% of account)
⏰ Entry: Market open
🔥 Confidence: 85%
🗓 Exit: By **Thursday EOD** (avoid Friday gamma/theta trap)
---
### ⚡ Aggressive Alt
👉 **IREN 27.5C (\~\$0.75)**
Higher delta, but lower liquidity (OI 246 vs 866).
---
📌 **Trade JSON (for algo/backtesters 🤓)**
```json
{
"instrument": "IREN",
"direction": "call",
"strike": 31.0,
"expiry": "2025-09-05",
"confidence": 0.85,
"profit_target": 1.35,
"stop_loss": 0.33,
"size": 1,
"entry_price": 0.67,
"entry_timing": "open",
"signal_publish_time": "2025-09-01 21:35:09 EDT"
}
```
---
\#️⃣ **Tags / Hashtags**
\#IREN #OptionsTrading #WeeklyOptions #FlowTrading #SmartMoneyFlow
\#BreakoutStocks #TradingSignals #CallOptions #StockMarket 🚀📈🔥

IREN Just Won't Quit! Wave 3 Behabviour!IREN Continues its push into price discovery with strong candle spread despite the drop in Bitcoin and range in the S&P. Strong wave 3 herding behaviour!
Price appears to be overextending in wave 5 of (iii) with a target of the R5 daily pivot.
Bearish divergence persists on the overbought RSI.
Safe trading
