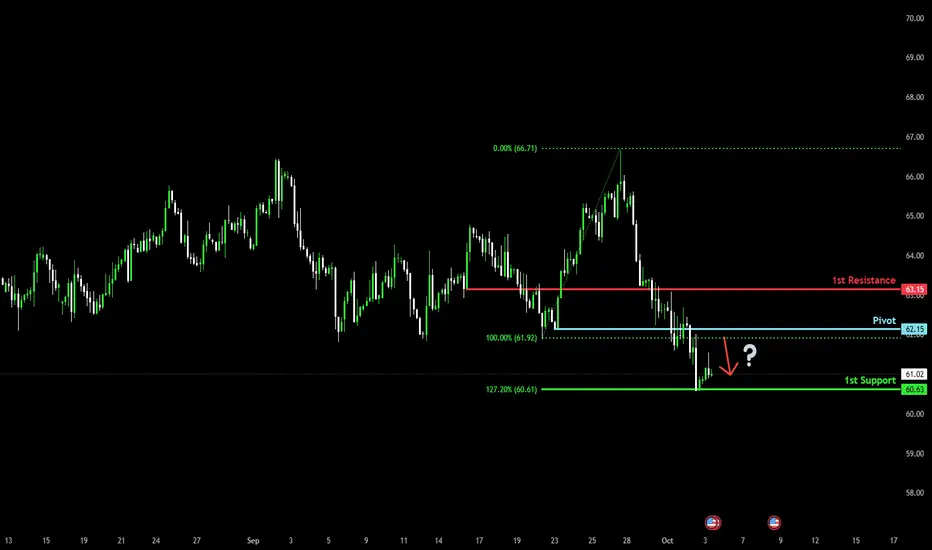
Bearish continuation?WTI Oil (XTI/USD) is rising towards the pivot, which is a pullback resistance, and could drop to the 1st support.
Pivot: 62.15
1st Support: 60.63
1st Resistance: 63.15
Disclaimer:
The above opinions given constitute general market commentary, and do not constitute the opinion or advice of IC Markets or any form of personal or investment advice.
Any opinions, news, research, analyses, prices, other information, or links to third-party sites contained on this website are provided on an "as-is" basis, are intended only to be informative, is not an advice nor a recommendation, nor research, or a record of our trading prices, or an offer of, or solicitation for a transaction in any financial instrument and thus should not be treated as such. The information provided does not involve any specific investment objectives, financial situation and needs of any specific person who may receive it. Please be aware, that past performance is not a reliable indicator of future performance and/or results. Past Performance or Forward-looking scenarios based upon the reasonable beliefs of the third-party provider are not a guarantee of future performance. Actual results may differ materially from those anticipated in forward-looking or past performance statements. IC Markets makes no representation or warranty and assumes no liability as to the accuracy or completeness of the information provided, nor any loss arising from any investment based on a recommendation, forecast or any information supplied by any third-party.
ISD
Bullish bounce off multi swing low aupport?Ethereum (ETH/USD) is falling towards the pivot and could bounce to the 50% Fibonacci resistance.
Pivot: 4,172.06
1st Support: 3,939.39
1st Resistance: 4,476.08
Risk Warning:
Trading Forex and CFDs carries a high level of risk to your capital and you should only trade with money you can afford to lose. Trading Forex and CFDs may not be suitable for all investors, so please ensure that you fully understand the risks involved and seek independent advice if necessary.
Disclaimer:
The above opinions given constitute general market commentary, and do not constitute the opinion or advice of IC Markets or any form of personal or investment advice.
Any opinions, news, research, analyses, prices, other information, or links to third-party sites contained on this website are provided on an "as-is" basis, are intended only to be informative, is not an advice nor a recommendation, nor research, or a record of our trading prices, or an offer of, or solicitation for a transaction in any financial instrument and thus should not be treated as such. The information provided does not involve any specific investment objectives, financial situation and needs of any specific person who may receive it. Please be aware, that past performance is not a reliable indicator of future performance and/or results. Past Performance or Forward-looking scenarios based upon the reasonable beliefs of the third-party provider are not a guarantee of future performance. Actual results may differ materially from those anticipated in forward-looking or past performance statements. IC Markets makes no representation or warranty and assumes no liability as to the accuracy or completeness of the information provided, nor any loss arising from any investment based on a recommendation, forecast or any information supplied by any third-party.

USDJPY H4 | Bullish momentum to extendUSD/JPY is reacting off the buy entry which is a pullback resistance, and a breakout of this level could lead the price to rise to the upside.
Buy entry is at 147.98, which is a pullback resistance.
Stop loss is at 146.85, which is a multi-swing low support.
Take profit is at 149.15, which is a pullback resistance that aligns with the 61.8% Fibonacci retracement.
High Risk Investment Warning
Trading Forex/CFDs on margin carries a high level of risk and may not be suitable for all investors. Leverage can work against you.
Stratos Markets Limited (tradu.com ):
CFDs are complex instruments and come with a high risk of losing money rapidly due to leverage. 65% of retail investor accounts lose money when trading CFDs with this provider. You should consider whether you understand how CFDs work and whether you can afford to take the high risk of losing your money.
Stratos Europe Ltd (tradu.com ):
CFDs are complex instruments and come with a high risk of losing money rapidly due to leverage. 66% of retail investor accounts lose money when trading CFDs with this provider. You should consider whether you understand how CFDs work and whether you can afford to take the high risk of losing your money.
Stratos Global LLC (tradu.com ):
Losses can exceed deposits.
Please be advised that the information presented on TradingView is provided to Tradu (‘Company’, ‘we’) by a third-party provider (‘TFA Global Pte Ltd’). Please be reminded that you are solely responsible for the trading decisions on your account. There is a very high degree of risk involved in trading. Any information and/or content is intended entirely for research, educational and informational purposes only and does not constitute investment or consultation advice or investment strategy. The information is not tailored to the investment needs of any specific person and therefore does not involve a consideration of any of the investment objectives, financial situation or needs of any viewer that may receive it. Kindly also note that past performance is not a reliable indicator of future results. Actual results may differ materially from those anticipated in forward-looking or past performance statements. We assume no liability as to the accuracy or completeness of any of the information and/or content provided herein and the Company cannot be held responsible for any omission, mistake nor for any loss or damage including without limitation to any loss of profit which may arise from reliance on any information supplied by TFA Global Pte Ltd.
The speaker(s) is neither an employee, agent nor representative of Tradu and is therefore acting independently. The opinions given are their own, constitute general market commentary, and do not constitute the opinion or advice of Tradu or any form of personal or investment advice. Tradu neither endorses nor guarantees offerings of third-party speakers, nor is Tradu responsible for the content, veracity or opinions of third-party speakers, presenters or participants.

Potential bearish drop?Ethereum (ETH/USD) is rising towards the pivot and could reverse to the pullback support.
Pivot: 2,590.30
1st Support: 2,455.59
1st Resistance: 2,650.86
Risk Warning:
Trading Forex and CFDs carries a high level of risk to your capital and you should only trade with money you can afford to lose. Trading Forex and CFDs may not be suitable for all investors, so please ensure that you fully understand the risks involved and seek independent advice if necessary.
Disclaimer:
The above opinions given constitute general market commentary, and do not constitute the opinion or advice of IC Markets or any form of personal or investment advice.
Any opinions, news, research, analyses, prices, other information, or links to third-party sites contained on this website are provided on an "as-is" basis, are intended only to be informative, is not an advice nor a recommendation, nor research, or a record of our trading prices, or an offer of, or solicitation for a transaction in any financial instrument and thus should not be treated as such. The information provided does not involve any specific investment objectives, financial situation and needs of any specific person who may receive it. Please be aware, that past performance is not a reliable indicator of future performance and/or results. Past Performance or Forward-looking scenarios based upon the reasonable beliefs of the third-party provider are not a guarantee of future performance. Actual results may differ materially from those anticipated in forward-looking or past performance statements. IC Markets makes no representation or warranty and assumes no liability as to the accuracy or completeness of the information provided, nor any loss arising from any investment based on a recommendation, forecast or any information supplied by any third-party.

Falling towards 50% Fibonacci support?Ethereum (ETH/USD) is falling towards the pivot and could bounce to the 1st resistance.
Pivot: 2,102.09
1st Support: 1,669.20
1st Resistance: 2,806.23
Risk Warning:
Trading Forex and CFDs carries a high level of risk to your capital and you should only trade with money you can afford to lose. Trading Forex and CFDs may not be suitable for all investors, so please ensure that you fully understand the risks involved and seek independent advice if necessary.
Disclaimer:
The above opinions given constitute general market commentary, and do not constitute the opinion or advice of IC Markets or any form of personal or investment advice.
Any opinions, news, research, analyses, prices, other information, or links to third-party sites contained on this website are provided on an "as-is" basis, are intended only to be informative, is not an advice nor a recommendation, nor research, or a record of our trading prices, or an offer of, or solicitation for a transaction in any financial instrument and thus should not be treated as such. The information provided does not involve any specific investment objectives, financial situation and needs of any specific person who may receive it. Please be aware, that past performance is not a reliable indicator of future performance and/or results. Past Performance or Forward-looking scenarios based upon the reasonable beliefs of the third-party provider are not a guarantee of future performance. Actual results may differ materially from those anticipated in forward-looking or past performance statements. IC Markets makes no representation or warranty and assumes no liability as to the accuracy or completeness of the information provided, nor any loss arising from any investment based on a recommendation, forecast or any information supplied by any third-party.

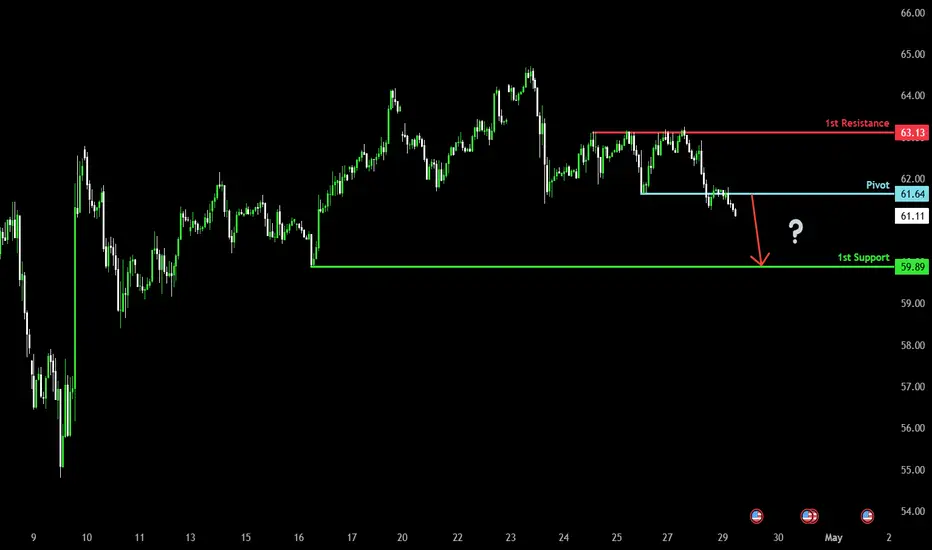
Bearish drop off pullback resistance?WTI Oil (XTI/USD) has rejected off the pivot which is a pullback resistance and could drop to the pullback support.
Pivot: 61.64
1st Support: 59.89
1st Resistance: 63.13
Risk Warning:
Trading Forex and CFDs carries a high level of risk to your capital and you should only trade with money you can afford to lose. Trading Forex and CFDs may not be suitable for all investors, so please ensure that you fully understand the risks involved and seek independent advice if necessary.
Disclaimer:
The above opinions given constitute general market commentary, and do not constitute the opinion or advice of IC Markets or any form of personal or investment advice.
Any opinions, news, research, analyses, prices, other information, or links to third-party sites contained on this website are provided on an "as-is" basis, are intended only to be informative, is not an advice nor a recommendation, nor research, or a record of our trading prices, or an offer of, or solicitation for a transaction in any financial instrument and thus should not be treated as such. The information provided does not involve any specific investment objectives, financial situation and needs of any specific person who may receive it. Please be aware, that past performance is not a reliable indicator of future performance and/or results. Past Performance or Forward-looking scenarios based upon the reasonable beliefs of the third-party provider are not a guarantee of future performance. Actual results may differ materially from those anticipated in forward-looking or past performance statements. IC Markets makes no representation or warranty and assumes no liability as to the accuracy or completeness of the information provided, nor any loss arising from any investment based on a recommendation, forecast or any information supplied by any third-party.

The breakout on GOLD is dueToday again, price holds in the 1782-1813 zone.
Like we said yesterday, we do not recommend any new trades while price is trading inside of this zone.
Once we see market closing above or below this zone, that's when we can look for potential entries.
Meanwhile, we've got 4 other positions. One of them is risk-free and we're waiting for development.
On GOLD we want to see a clear setup first.


interesting zone.Good morning traders today i am interested in the zone we are currently in for Usdjpy and i would be shorting it further if momentum continues to the down side. i think the bears are on our side with this tarde and shorting oppertunities are presenting them self if we break below the zone highlighted. the only thing i would worry about is the retracement to the upside. watch for the retracement and maybe short it from there


USDILS: Rising Wedge within a Channel Up. Buy opportunity.The pair is trading on a Rising Wedge within a wider 1D Channel Up (RSI = 59.015, MACD = 0.014) and the neutral Highs/Lows (0.0000) indicate that it is close to pricing a Higher Low. The long's obvious TP is the Wedge's Resistance at 3.7900 but if it breaks we will extend the buying to 3.8200.
** If you like our free content follow our profile (www.tradingview.com) to get more daily ideas. **
Comments and likes are greatly appreciated.

Least path of resistance and low volume! Higher prices are closeMACD crossed and very low volume phase started. No hard selling or any action that changes the price. While the weekly chart looks like a bearish flag, the daily chart is telling me something will happen soon. Watch for 20 moving average. It isn't going to be taken down easily. In the first higher high green daily candle, it is a but for surge with a stop loss below the last red candle. Try to take a position on the 20 SMA, if you intend to take a position. here is not a lot of resistance on the path of a new high around 7.6.

BTCUSD Signals Intriduction
What ? U sold Bitcoin ? Cause if u did u might sold the bottom. How ? Price is inside a big triangle and confirms the upcoming bull trend which will take us too $1Mil Not kidding lol First Target near $32,000. I can also be wrong but probably not in case it breaks downwards we might $3k which will be the opportunity to go All In. To go all the way in. Listen u have faced probably a half year in correction don't give up now its the time where things are going to get better. The Real Challenge comes when u get knock down and guess what we already on our knees its time rise and give a K. O. Punch to the bears. Don't loose hope.
Technical Analysis
It's been a really bad day for crypto so far Bitcoin was down 10% which is huge and affected the alts really badly. The market capital is hovering around $298 Bil. With BTC dominance 39% all indicators turning bearish but my favorite RSI is oversold great opportunity to buy. We may or may not see $3k but I'm bullish for now on. Now let's talk about the pattern a beautiful downward pointing triangle with the last wave just about to complete and it will breakout out soon. In a longer term Bitcoin is currently in the Fourth wave which is a corrective wave which is about to end and the fifth and the final wave will take us to $1 Mil. That's all I'll keep updating ideas in the threads so make sure to follow me and leave a like.
Thank You

ISD $0.85 trending upChart has notes
On the cusp of breakout imo, just add volume
Sorry for the multiple isd charts.... dont know how to 'update' with a chart

ISD $0.82 reversal in progressThey always go deeper than you expect but that divergence is purdy
Time for a few green days hey.
Shorts be gone...surely

$ISD potential reversalISD has been getting smashed for a very long time now.
Strength is there, even if it is exceptionally well hidden
FD holding from 0.88

