itc breakout last High when rsi is up than this stock trand continue this make a position form this level and stoploss break out candle
ITC

is ITC gonna prove everyone wrong this time ?In recent years, $ITC.NSE has been talk of the town but on insta memes for its underperfomance. But recent rally seems to have some surprise for traders as it has crossed and closed at 267.80 which is 3 years high. Technically, momentum is strong with volumes and also it is running up towards the channel resistance of 282 above which a new DREAM rally would be initiated. But on downside support is at 200 WEEKLY average at 235 which can act as Stop loss for investors and fresh traders.

ITC WILL RESIST TOMMOROW AT ABOVE 3RANGES Price is very much close to is major resistance ie 257 261 and 265 bears will be active along this ranges
Getting Convergence around this ranges

Can We BUY ITC NOW For Short TermNSE:ITC
In Previous Week Candle Has Form A Tail Formation Which Is Good Indication Of Efforts To Stop The Fall Or Of Good Buying.
In Last Week Again We Have Seen Good Efforts To Push Prices Up In Itc.
Which Indicates Itc Is Stronger Than Index As We Haven't Seen Major Down Move In Stock.
We Can Prefer This Stock For Holding Period Of 2-3 Months.
Stop Loss Below 195 Closing Basis

Itc outperformed in weak market, Fundamental and Tech analysisITC Ltd
ITC outperforms in weak market
- Stock gains 7% in last five days
October-December quarter (Q3FY22)
- Strong all-around revenue performance
- Cigarettes staged a recovery with revenues at Rs 6,959 Cr
- Compared with Rs 6,091 Cr a year ago
- Pre-tax profits from the segment stood at Rs 4,187 crore
- Compared with Rs 3,659 Cr in the year-ago period
Cigarettes business Performance
- Stable taxation on cigarettes would result in high growth in cigarette volumes in the medium term.
- Cigarettes business was one of the worst impacted businesses in last two years due to Covid-19 disruptions
- Cigarette business growth in the current quarter reflects that volumes surpassed pre-covid high levels
- Margins of this segment : 14% year-on-year growth in earnings before interest and tax (EBIT)
Paperboard business Performance
- Demand recovery from the user industries
FMCG business
- Growth was at a slower pace of 9.3%
- Still stronger growth compared to most other FMCG peers
End of financial highlights
Tech Analysis
With its peers loosing all the gains of previous year, Itc has been maintaining its support on 215 for quite a few months now, another good support stands at 201 levels. However Itc has always proven itself as a zig zag stock so the next resistance is at 236, which can again bring profit booking in this stock. Look out for these levels and keep a stop loss in ratio of 1:2.
End of Tech Analysis

ITC - long viewThe stock has crested a good base at the level range of 204 levels.
As you can see the stock has taken support around this area and moved upwards.
It reached a high of 265 levels before crumbling to huge selling pressures.
The stock is trying to make its way back to the top.
I have presented my views on the chart with levels that can help you take your trades.
Thanks & Regards,
If you feel you can make use of my views and put them to good use, request you to kindly revert with feedback/suggestion/improvement

Best Buy Zones for ITC #Bottomfishing Best Buy Zone: 163 - 182
Good Buy Zone: 182 - 205
Add on bounce, not while it is falling.
Long Term Portfolio Stock.
Tracking Quantity can be taken at 211. (Tracking Quantity : Suppose you want to Invest Rs.X in a particular stock. The amount between Rs.X/5 or Rs.X/10 would be tracking quantity) (‘Tracking Quantity’ of a stock in your portfolio will help you keep a track of the stock if it is coming in the indicated buying zones.)(Sometimes Out of sight goes out of mind so buying tracking quantity of stocks that you want to add in future helps.)

ITC Again Will Come 200ITC all time favorite stock this time gain will come down very important support 200 and reverce

ITC Bearish or Bullish ??Short term Bearish till 218 , will bounce back if the FMCG walks toward the Improving Quadrant as per RRG
FMCG will bounce from the support level as indicated clearing the way for FMCG stocks to come in Improving quadrant ,
Entry 218
Target 235
Stop Loss 208
* Please do your own analysis before investing
Like if you agree with the analysis .


ITC - What's next in short term ??The short-term chart looks good, now sustaining 220 levels can take stock to 236 levels in the near term.
Currently, ITC trading at 222.60, looks like a good risk-reward trade
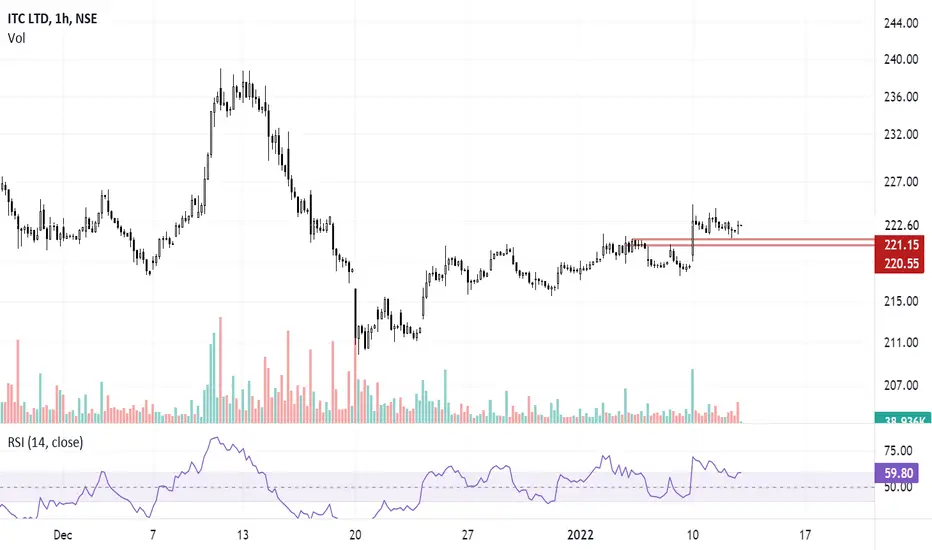
ITC BULLISH OUTLOOKITC Consolidation for a last weeks in price range 216 to 222 next result date 21 jan 22

ITC is long term holdThis stock is sleeping Giant which is going to be massive as soon as it wake up. Buying as much as I can below 250 INR.

ITC LONG TERM1. ITC trading at the bottom of the channel .
2. May give good short term rise till the top of the channel plus addn dividends are always good to have
Trade for long term
LIKe IF YOU AGREE .

ITC BREAKOUT can be good for long runITC BREAKOUT can be good for long run
ITC BREAKOUT can be good for long run
ITC BREAKOUT can be good for long run
ITC BREAKOUT can be good for long run
ITC BREAKOUT can be good for long run
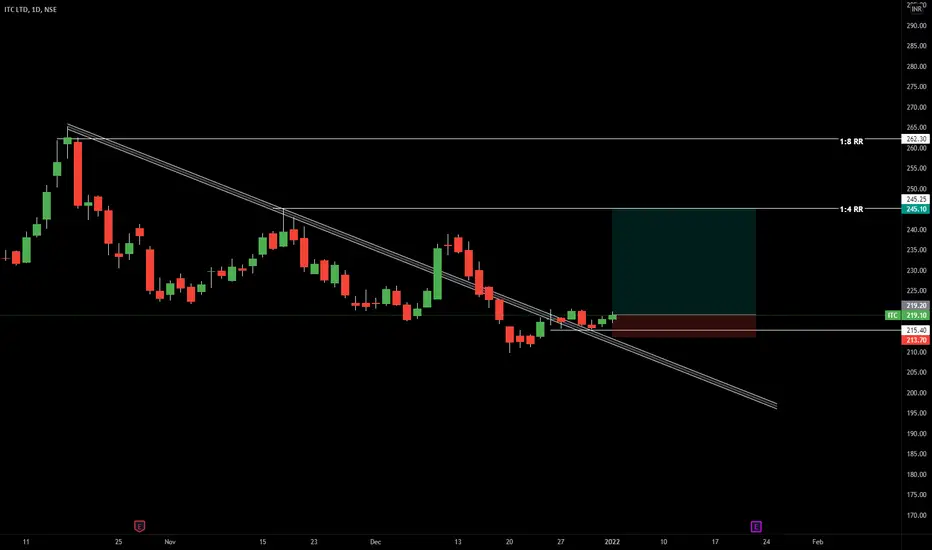
ITC Long Term Bullish Trend - Slow upwards grind - BUY zone ITC has been a MEME stock for India stock traders as the performance of this stock has been very poor compared other stocks, even in the hyper bull run over last 18-20 months. But if you're a long investor and looking for defensive stocks with good dividend yields, wanting to preserve capital, ITC would be a good stock in the portfolio. If you notice the ITC chart closely, you can clearly see it has been in upwards bullish channel over last 18-20 months, making higher highs and lower lows. It's getting very close to test the lower channel support line and also 200 DMA support around 215-216 Rupees. If you're a mid term swing trader, you can buy low at the channel and sell when it hits channel upper line. Long term investors can start accumulating at 215-216 levels, as 2022 will be more defensive play and institutions will pile up their money in dividend paying stocks. Key Support line to watch 205 and 200. Key resistance line to watch 266-267.

Nifty 50 Stock Analysis Series - 7th stock - ITCNifty 50 Stock Analysis Series - 7th stock - ITC
--------------------------------------------------------
My Analysis:
----------------
** Daily Timeframe **
----------------------------
1. was in channel pattern till 15th Sep and got a breakout, surged to Rs.260 with little retest.
2. Then, the correction wave (ABC) started and is in the C wave. It may reach Rs.210 in the next 1-2 weeks.
3. MACD is also below. So, wait for now.
4. Target 1 - it may go up (10% at least) to Rs.240
5. Target 2 - it may go up (20% max) to Rs.260
6. Wait for entry. Entry and target points are marked in the chart.
Note:
I'm not recommending buying this stock. This is for education purposes.
This is my view, based on my learning.
Please do not trade without your own conviction.
Please invest after careful research. I'm not responsible for your profits/losses.
- Gnanasekaran

ITC - Very Little HopeITC has formed a bearish flag pattern on weekly timeframe. It has recently tested the supply area and falling drastically ever since. This trend in confluence with any negative news such as omicron can bring the price to unexpected levels.

Trendline Breakout - ITCLooks like ITC is heading towards a Bull run again after the announcement of "institutional and financial analysis day" on Tuesday.

ITCITC has given a good breakout of a trendline. Once it breaks the yellow line and takes a retest we can enter for swing trade.

ITC at the suppot zone on weekly time frameitc is on weekly time frame demand zone
also on weeklytime frame trendline
RSI is not breaking 50 range support
and same level taken multiple support on both trendilne RSI
seems it will take support from here
ITS good time to enter for long term long at the breakout or high volume daily candle at support zone 2015-217 level

ITC 4hr chart Head & shoulders pattern 02 Dec 2021ITC 4hr chart formed a Head & shoulders pattern. Watch out for Breakdown. 02 Dec 2021

ITC Rallied - What's next ??ITC tumbled down from 262 levels to 222 levels.
It created support around 222 levels, tested it many times, and started rallying again.
Structure on the shorter timeframe is of higher highs and higher lows.
Today it rallied to around 245 levels, but couldn't sustain and closed around 239 levels.
Immediate support for the stock is around 237-238 levels, if it sustains these support levels, it will try to retest its previous highs again.
