#CARBORUNIV CARBORUNIV #trading #candlesticks #invest #money #it#CARBORUNIV
NSE:CARBORUNIV
Carborundum Universal Ltd.
NSE:CARBORUNIV
NSE:CARBORUNIV
CMP: 910.70
Target: >1200
Time Frame: < 3 months
SL: 807
RR Ratio: > 3
INVEST & HOLD
Factors:
BULLISH WEDGE BREAKOUT
Trend Following
Rising Volume with rising Prices.
Flag pattern breakout.
Pennant Pattern Breakout with Bullish Candle.
Retest Successful.
Higher Highs & Higher Lows.
Broken above RESISTANCE levels
Trading at SUPPORT levels
Earnings are strong.
Bullish Wedge Breakout
Risk Return Ratio is healthy.
And
Rising from Double Bottom Pattern to Flag Pattern forming.
If you like my work KINDLY LIKE SHARE & FOLLOW this page for free Stock Recommendations.
With 💚 from Rachit Sethia
ITC

ITC ON RADAR !Itc should reverse from the given level a trade can be taken from given level as risk: reward is very favorable !
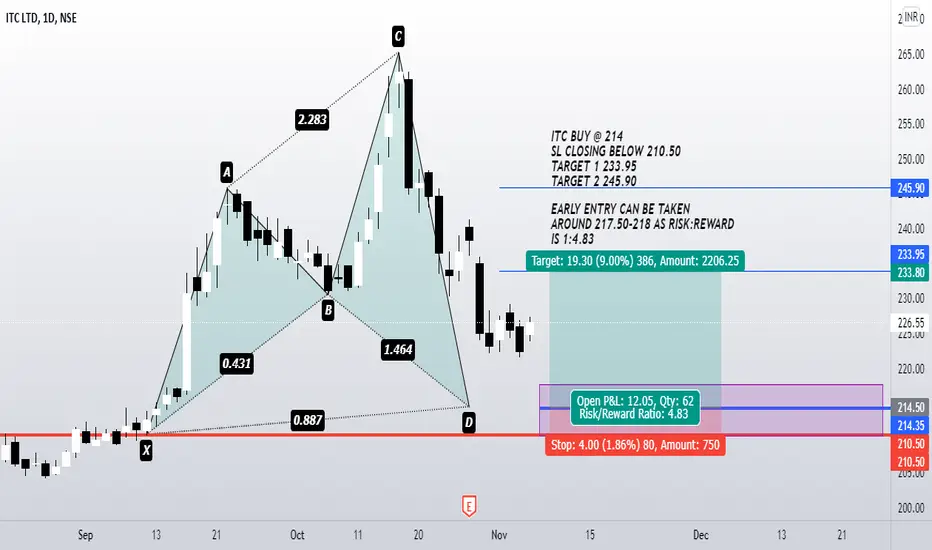
ITC - Last level , that could save ITCWe have witnessed a remarkable move in the ITC from 200 levels to 265 levels 😍 in the past few months.
Though in the last week, it has fallen about 12 %, that's a huge number 😲, ideally which an up-trending stock should not witness.
Though it has good support around 230-232 levels, if held, then chances of moving upwards would still be there on the cards 😀.
Moving below or close below these would make this stock laggard 🤨 again. then it would most likely trade between 230- 218 levels.


ITCPosition bana rkha hai HH HL, results acche aye to 300++ jayega. support 242 ka hai Buy 245 - sell 241

The Evergreen ITC PuzzleNSE:ITC is probably one of the most talked about stock in Indian markets. Twitter is full of ITC memes and investors have grown old hoping that one day ITC would finally start making a decisive upmove for good :)
Anyhow, if you see the volumes in ITC lately, there has been a lot of interest. Lots of large volume bars in recent few weeks and the stock has broken out of a falling trendline (as shown by arrow). There are still some near term resistances as you can see in chart but could this breakout be the move that everyone has been waiting for? Only time will tell.

ITC 30 Min Chart Descending Triangle Breakout 12 Oct 2021ITC 30 Min Chart Descending Triangle gave a Breakout 12 Oct 2021

ITC - Trendline BreakoutIn today's session, ITC broke the trendline, it had been resisting for the past 20 trading sessions.
Now if it sustains 232 levels in the short-term, it probably giving clues of renewing its long-term trend .
Immediate resistance 237-238
Further resistance at 244
Support 230


ITC POLE AND FLAG FORMATIONIn previous day itc give big momentum buy some people can capture moment so there is chance to buy with minimum stop loss, entry should be flag breakout and sl below the Flag pattern

ITC 15min chart Descending Triangle 04 Oct 2021ITC 15min chart forming Descending Triangle 04 Oct 2021. Upside target 450

ITC cmp : 235If ITC reaches 240 and sustains (2 or 3 days) , its going to hit 260.
If support fails around 228-233 , Again 210-215.

ITC given brekaout from weekly time frame triangleITC given brekaout from weekly time frame triangle
important suport at breakout level
can see 322 level soon
RSI is strong better to take entry on retracement falling wedge breakout

ITC Long | intraday long | Swing TradeFor Intraday Trade above 239 | SL-237 (see 15 min candle)
Tgt1-247.45
Tgt2-252
Tgt3-260.2
----------------------------------------------------------------------------------------------------------------------------------------------------------------------------
For Swing Trade Long above 239 | SL-230 (For 2-3 months)
Tgt1-260
Tgt2-285
Tgt3-354 by 1st week of November
-----------------------------------------------------------------------------------------------------------------------------------------------------------------------
Do Your Own Research on Company fundamentals to get a good idea and its future potential.

ITC - bullishThe stock in now in a bullish trend.
1. POC has been breached.
2. Fresh Aroon Crossover.
3. 50SMA support.
Target id Point D.

ITC 15 Min chart forming Rising Wedge Pattern 22 Sept 2021ITC 15 Min chart forming Rising Wedge Pattern 22 Sept 2021. Watch out for Breakout.

ITC READY FOR UPMOVECup AND Handle breakout clearly visible.
ITC a good pick for long term is ready for an up move.

ITC on break out As from traingle Patten formation (hh , hl ,lh , hl , lh till now ) now going to lh so it does not hit the lh again so it is going up
no one can predict crt entry so take entry of 200- 208

ITC fuelling up for launch to 300+? Bullish Fib based View This analysis is based on purely technical perspective with a Bullish bias primarily based on Fibonacci levels and support/resistance model.
ITC has been grinding up slowly on Daily since the low of 134.6 from last year and is currently forming a Bullish Ascending Triangle as shown in the chart.
Also the price has tested the broken support zone twice and last week, the test of this broken support was done with extremely bullish momentum which signals that the Bulls are ready to launch the price to 300+ and the technical view using Fib retracement and extensions is shown in the chart.
3 sets of Fib levels are drawn on the chart.
1. Downward Fib extension from 367.7 (extended from 322.95)
2. Upward Fibonacci Retracement from 134.6 to 367.7
3. Upward Fib extension from 134.6 (extended from 158)
The confluence zone of 0.618 fib of downward fib ext, 0.5 fib of upward fib retracement and 1.618 of upward fib extension will be the Critical Resistance Zone as it was the important pivot low of the downward extension and also the 0.618 of the same extension drawn as shown on chart.
Breach of this zone will potentially propel price to the Volatility exhaustion limits of the upward fib extension of 2.618 level and also the 1st weekly resistance zone.
Price breaching this zone will test the All Time High price and this is where the momentum matters for price pushing into unchartered territory and the extremely strong Fib resistance of 4.236 fib at 408.55 price level will be the exhaustion zone.
===================================================================================================================
Do Your Own Research on Company fundamentals to get a good idea and its future potential.

Long ITCLong ITC. Buying zone 14.5 - 15.5
Break resistance with huge volume.
Stoploss: 13.5
Target: 28

Flag PatternStock Analysis: ITC has formed flag pattern, it is good buy around current level with below demand zone as stop loss for the target given on the chart.
Happy Investing!

ITCITC has probably become the most hated stock in recent times, but chart is telling different story, it appears that the stock is currently in wave 3, and it has possibly completed a long complex correction in wave II of 3rd, and the stock bounced back from the support zone around 200, and finally it has given a fresh breakout of decending triangle or flag pattern with very good intensity of volume, the stock is set to start wave III of 3rd. one can go long at current level or in dips (if any), all the key levels are mentioned in chart with Stop-loss and Targets.
Wave Structure, with channel and key levels
Decending Triangle pattern Breakout
Breakout with Good intensity of Volume, Zoomed View
Weekly MACD Uptick
Daily MACD Uptick
BBC up
Very Good positive Ungali setup
RSI in daily above 60 uptick
Disclaimer
I am not sebi registered analyst
My studies are Educational purpose only
Consult with your Financial advisor before trading or investing

