ITC Long term EW Wave countsThis is the EW Wave counts based on Monthly time frame log scale.
(1) See how the Magenta Trendlines are driving the prices. These are long term and solid structure contained within the trendlines. Lower Trend line provides the support and the upper trendline provides the resistance.
(2) Waves counted in in Red shows major/monthly elliott wave cycles. Waves in Blue shows sub waves within the major wave cycles. Waves in magenta shows sub waves within sub waves of the major cycles. Waves in the green shows correction waves in the major elliott wave cycle. This is preferred wave count, the alternate counts are not shown here and i will paste it later. Seeing WXY Correction as a part of Wave 2 correction. Seeing ABC correction as a part of Wave 4 correction. At this point, it most likely shows ABC correction but it may be turned in to complex corrective pattern. The structure in development right now is bit early to count it but as long as it stays above 180-185 zone, bullish structure is preserved and ABC correction pattern is complete. It we see monthly close below 180, it may turn in to complex correction and we may see dip correction.
(3) Pl note that this based on monthly chart analysis and each candle represents one month. If present structure is preserved and ITC stays above 180, then the wave 5 (Red color) counts are wave 3 (Red color) top and we will need to see the reaction from then on.
If you wanna learn Elliott wave analysis, pl have your account set up with Elliott wave international Also pl read Ellott wave book "Elliott Wave principle - Key to Market behavior by Frost and Prechter, one of the classic resource on the topic. Also, a relatively good free resource on the YouTube is Elliott Wave Tutorial Part 1 to 5 by a channel called "Wave 618"
Itclong


ITC Long oppurtunityITC is currently forming a falling wedge pattern once it breaks out it provides a fresh buying opurtunity

ITC long Term SpeculationThe above chart NSE:ITC can either breakout or break down in the future with the future trends.
time frame = 1D
disclaimer: education purposes only


ITCPOS. ADD ITC AT 213/200
UP SIDE WE SEEN 233-255-277+
IF CLOST OR SUTAIN ABOVE 240
SKY IS THE LIMIT


ITC PreparedITC all time favourites of retailers. In weekly chart another break out scenario and heavy volume in last candle and RSI above 60. I'm already bullish on ITC when it's breaked 195 level.

ITC long analysisITC looks like change their trend. RSI already given trend line break out. Price chart given trend line to break out. Key level is 195.55, above this level boom. Good to long time.

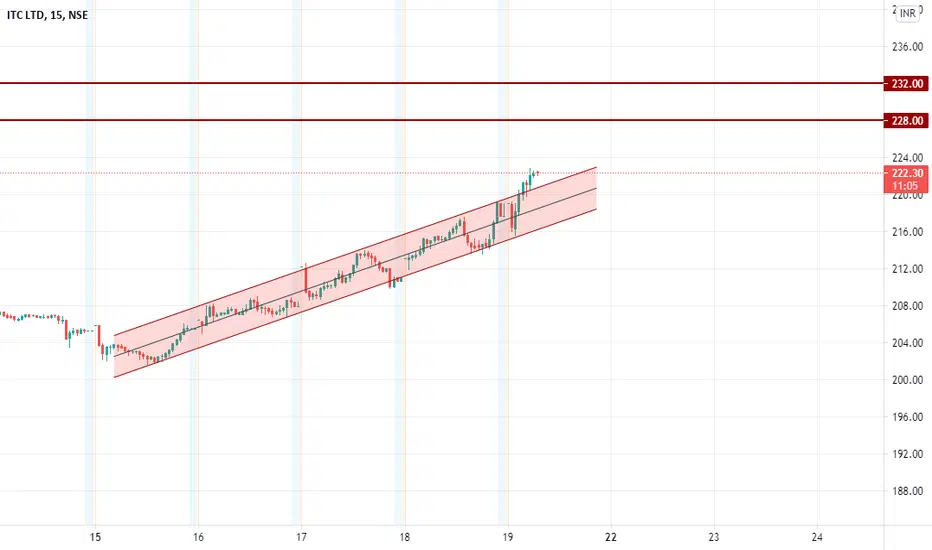
ITC long One can long ITC on positional basis as stock is strongly holding above its resistance of 200 zone. Once stock manage to cross previous swing high which was sub 210 level on closing basis then stock can move towards 260 levels.
Stop loss should be placed near 192 levels.


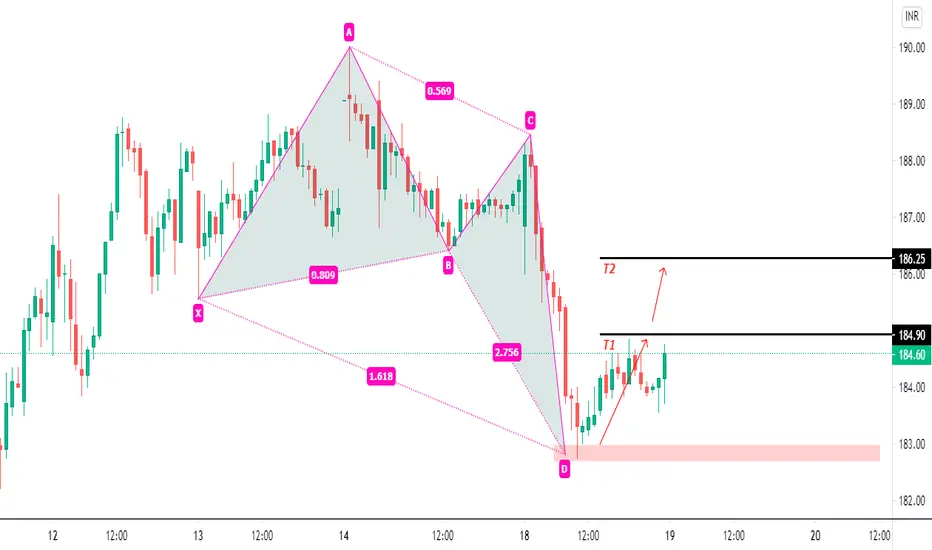
ITC BULLISH DEEP CRAB - NEXT TARGETS MEANTIONEDPRICE HIT EXACTLY AT HARMONIC POINT AND REVERSED - SNIPER ENTRY


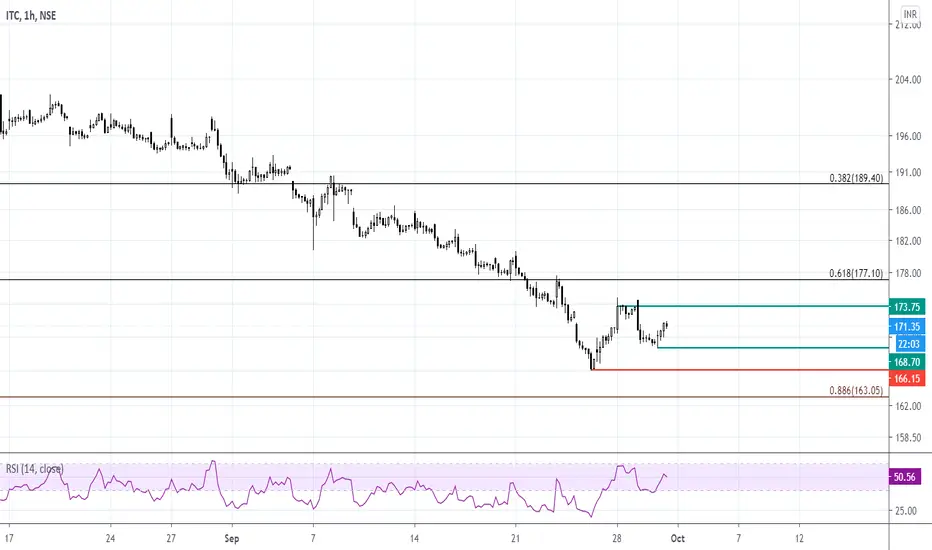
ITC - trend change probability on cards#ITC - Stock is in the process of a trend change, keep it on your radar. Move above 173, can see fast move towards 187 -190 levels.
Accumulation zone 163- 170.
SL few ticks below 163
Trade type: Swing, and can covert into positional as well.
**Trade at your own risk
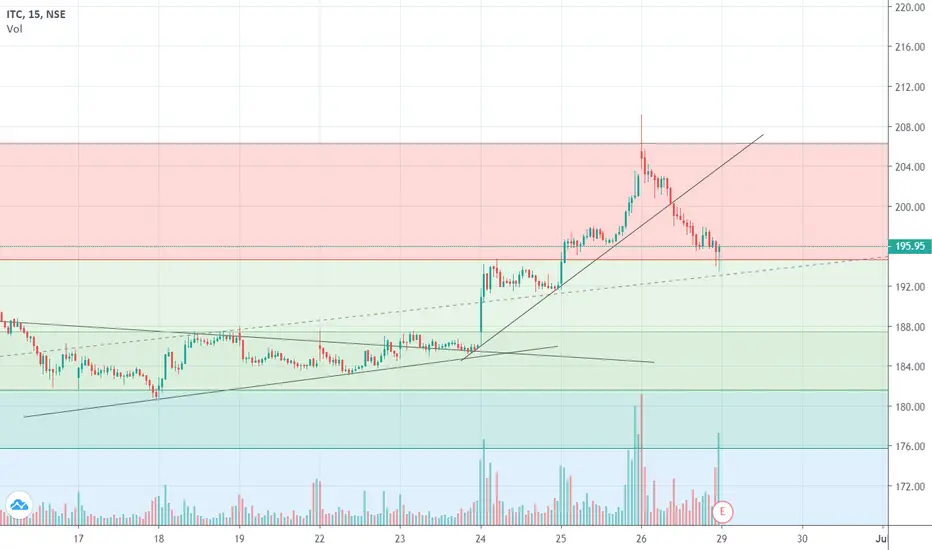
itc is a good buy from these level buy itc for for target 202 203
support is 196.2 195.75
or extension level 206 209 211

ITC took Strong SupportITC has taken good support and rallied... buy buy buy...
if you are not willing to buy in futures take options =>buy 215 CE sell 225 CE ...
expectation is it will reach 225 so by that time expiry comes in and you can eat premium of 3200
maximum loss is 5500 if it starts falling down to 195 then sell one more 225 CE you will loose around 2k-3k which is nothing
I bought 215 ce at 2.65 and sold 225 ce at 2.65 already at 700 profit...
I think ITC is a good dividend yield company and holding it will give you 5 to 7% profit i dividend yield itself and if it rallies that is extra... so buy in stocks if you have money


ITC BullITC has consecutively faced 2 rejections and now it has taken a support at the fibo level. ITC Dividend news has given it a boost up and the last candle has ended with a hammer. Expecting a bull run from ITC - My alltime trustworthy favourite stock.. Note: I have the right to be wrong.
ITC BULLISH CAN GO FOR LONGITC has give bullish engulf and one can go for long. The entry idea and the stop loss and everyday intraday trading ideas are given on our tellegrammm channnel UG MARKET. Do your own research before taking a trade.

Clear Down is Vissible upto 179A) 1, 3, 4, Reacts as a sign of Good up movement/ uptrend
( reverse of Rs.179.00 will be a good take off for the
breakout of Rs. 199.00 and the target will be around 220 for shorterm)
B)No. 2, 3a reacts as a continuous downtrend
(if the above fails the price will react at Rs.170 then it will expected
to go down or otherwise it will confirm the next clear trend at around Rs.190.00)
* NOTE- THIS IS MY PERSONAL ANALYSIS AND IT WAS POSTED FOR KNOWLEDGE SHARING BASIS
Clearly this is NOT FOR ANY KIND OF SUGGESTION TO BUY OR SELL.
