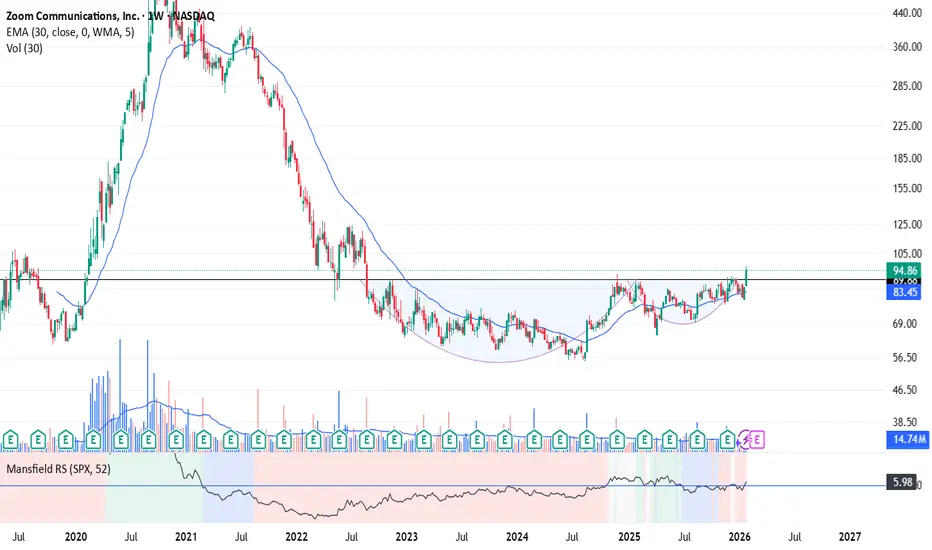
Break out on Zoom? Cup and Handle pattern is seen on this weekly chart but started forming in Aug 2022. Now in early stages of breakout, but not confirmed yet.
Itsector
HCLTECH short-term bullish All indian IT stocks are looking bullish for short term for almost 2 weeks they are closing in green 💚 so my view on HCLTECH is bullish with two above target near resistance also price is making a impulse wave expected to go till 1762, 1836

Tata ElxsiTata Elxsi gave a breakout of a falling trendline few days back. Now it has given a retest of the trendline and has started its uptrend again. You can a small tight consolidation and a breakout of that range in 4hr timeframe today. A closing of this candle can be a buying opportunity.
Check the chart image for all the entry targets and stoploss and reason for the trade.
Target 1 and stoploss is for short term traders. For long term traders they can look for target 2 and even higher target as this is good pick for long-term.
Disclaimer- This is just for educational purpose.
Jai Shree Ram.

Wipro: Breakout & Boom!This is the daily timeframe chart of Wipro.
Wipro has been forming a falling wedge pattern, and the stock has given a breakout near the ₹250 level.
The breakout has also occurred above the long-term support zone of ₹225–₹240, which strengthens the bullish structure.
If this momentum continues, then any dips from the current levels may offer strong risk-reward opportunities and potentially lead to a bigger rally.
In the shorter timeframe, the potential upside target for Wipro stands near the ₹280 level..
Thank you.

IT SECTORNeed to keep a watch on IT sector next. Not sure when it will break the ongoing resistance zone. but looks like some good potential point are there on the upside.

Palo Alto Networks: Pullback Follows New All-Time HighPalo Alto initially climbed to a new all-time high, but the upward momentum soon faded, leading to a notable pullback. However, we expect the stock to recover soon and, as part of the magenta wave (3), break through resistance at $232.29. The following waves (4) and (5) are also projected to develop above this level, further fueling the ongoing upward trend. That said, we still see a 37% chance that PANW will instead complete (or has recently completed) turquoise wave alt.B below the $232.29 mark. In that scenario, wave alt.C could trigger sell-offs to a new low for magenta wave alt.(2) , though support at $139.18 should remain intact.

ETF ITBEES Bullish ETF ITBEES is seeing a positive RSI indicator moving in upwards trend, expect to rise in coming weeks.
Support levels tested
Long 🟢 trade expected

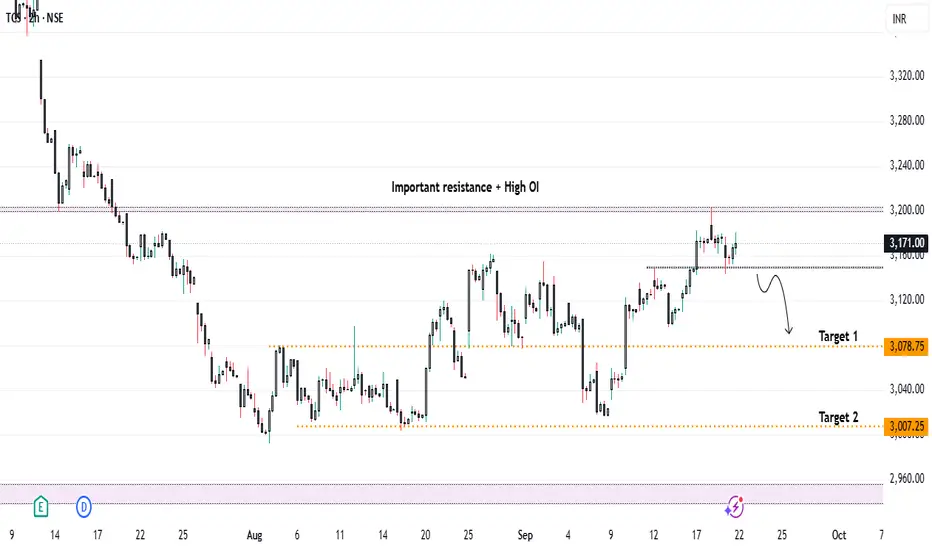
TCS Under Pressure – Will Visa Heat Trigger ₹3000 Levels..?Currently, TCS is trading near the crucial resistance zone of ₹3200, which also carries high open interest. From a technical perspective, if the stock breaks and closes below the short-term support of ₹3150, we can look for a short entry on retest, with targets:
* 🎯 Target 1: ₹3080
* 🎯 Target 2: ₹3000
📰 Fundamental / News Catalyst
The recent US H-1B visa policy update imposing a $100,000 fee on new petitions triggered a knee-jerk reaction in IT stocks:
* U.S.-listed Indian IT firms saw an immediate 2-5% decline.
* Analysts expect the impact on TCS to be limited, since a large part of its U.S. workforce is locally hired and renewals/existing visas are exempt.
* Worst-case estimates suggest a 3-5% downside in the short term, but not a structural collapse for large, diversified players like TCS.
📊 Impact Outlook on TCS
Short Term (days–weeks):
* Investor sentiment may turn negative, causing selling pressure.
* Margin compression possible due to new visa costs.
* Analysts could revise earnings growth expectations lower.
* Offsetting factors: Renewals exempt, TCS has a solid U.S. local workforce, and offshore flexibility.
Medium Term (months):
* New contracts may factor in higher costs.
* Shift to offshore delivery could reduce higher-margin onsite revenues.
* More local U.S. hiring may raise costs.
* Offsetting factors: TCS’s scale allows cost absorption; some costs may be passed to clients.
Long Term (year+):
* Delivery model may shift further to offshore/local U.S. hiring.
* Competitive pressure if peers adapt faster in the U.S. market.
* Margins could be under pressure.
*Offsetting factors: Strong global brand, diversified business, investments in AI & automation can offset long-term risks.
🔎 Scenarios for Share Price
* Mild Reaction: 3-5% decline → cautious investors, limited disruption.
* Moderate Reaction: 8-12% decline → project delays, client pushback, stricter visa rules.
* Severe Reaction: 15-20%+ decline → contract losses, earnings downgrades, tighter U.S. policy.
✅ Conclusion
* 📌 Technicals: Watch ₹3150 for breakdown confirmation; short entries possible below this with ₹3080 / ₹3000 as downside targets.
* 📌 Fundamentals: News-driven weakness is likely, but structural risk to TCS remains limited vs smaller IT peers.
* 📌 Strategy: Short-term bearish setup aligns with both technical chart structure and negative sentiment from visa policy changes.
📌 Sentiment: Bearish (Short Term)
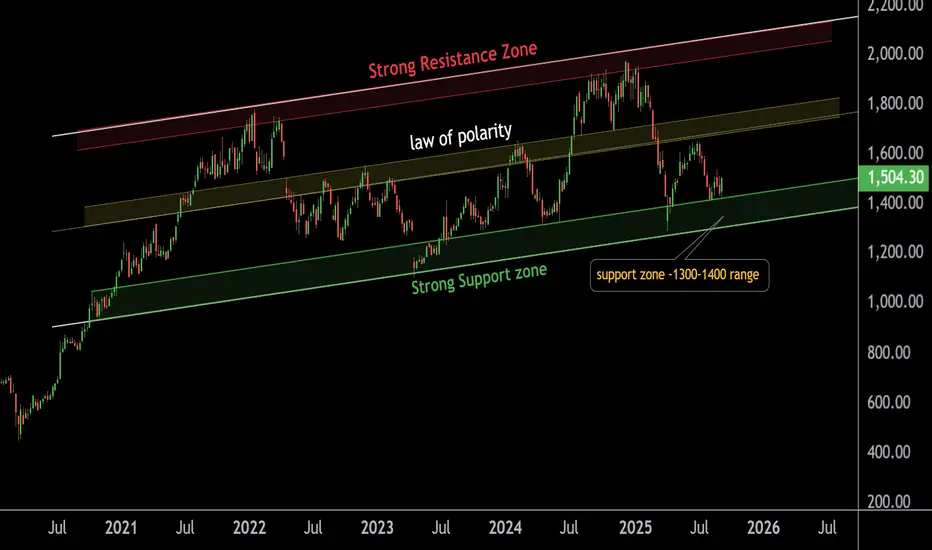
Infosys Holding Strong at Powerful Support – Big Move AheadThis is the weekly chart of Infosys (INFY).
INFY is currently trading within an ascending parallel channel, with a strong support zone in the ₹1300–₹1400 range.
The stock has shown a bounce from this level, offering traders and investors a favorable opportunity to accumulate.
If this support sustains, the next potential upside targets are around ₹1750–₹1800, with the upper boundary of the channel positioned near ₹2100–₹2200.
Thank you.
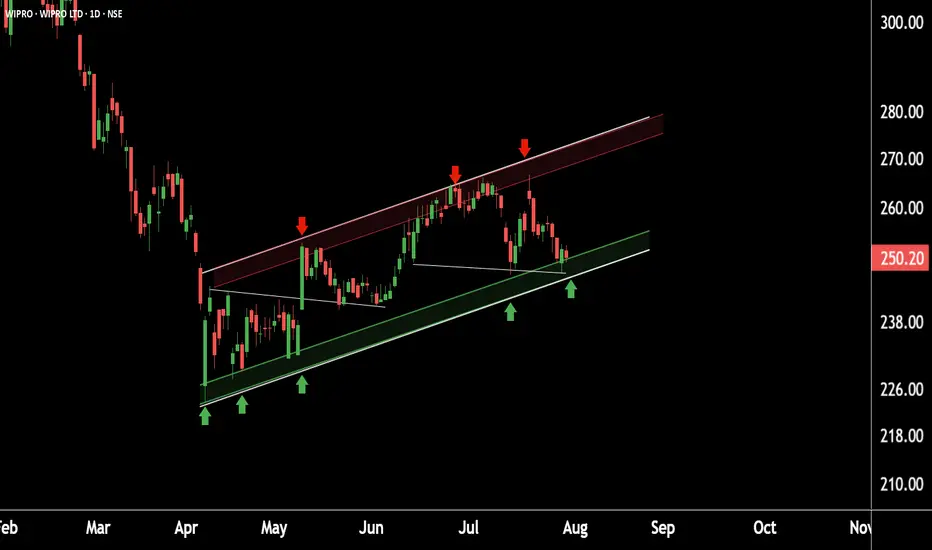
Wipro Near Crucial Support – Smart Money Watching Closely This is daily timeframe chart of Wipro.
Wipro is moving in well defined parallel channel with support zone near at 240 range.
If Wipro is sustain this level , then we may see higher prices in Wipro.
Thank You !!
Palo Alto Networks: Countermovement or Breakout?Palo Alto has faced increasing upward pressure and has been noticeably pushed higher. Thus, the stock is ogling our alternative scenario, which envisions a direct breakout above the resistance level at $207.24. In this 30% likely scenario, we would attribute the last low to the beige wave alt.IV and prepare for a new high of the blue wave alt.(I). Primarily, however, we classify the recent gains as a countermovement and locate the stock already in the bearish blue wave (II), which should settle its low within the blue Target Zone between $104.74 and $55.73; prior to that, the price must fall below the support at $130.04. After the wave (II) low, a new (wave (III)) uptrend should begin and eventually lead to new all-time highs above $207.24.

Zscaler: BalancedZS has seen buyers and sellers largely balancing each other recently, preventing any significant moves in either direction. As a result, we continue to place the stock in a corrective rally as part of the magenta wave , with its high anticipated above the $259.61 resistance. However, if the price falls below the $153.70 support, the ongoing corrective structure will extend further, with the turquoise wave alt.X establishing a new low. This alternative scenario carries a 35% probability.

INFOSYS looking to take out liquidityINFY is looking for BuyStops below the the target price. Price is likely to start looking for the Sell side liquidity targets soon. Even if SL gets taken it may be possible that the price fails to push higher.

Cloudflare: ProgressCloudflare has demonstrated impressive upward pressure, surging more than 40% in just a few days. In response, we now consider waves 3 and 4 in green as finished and locate the stock in the final stretch of this impulse move, which should ultimately complete the orange wave iii. Given that key expansion levels have already been reached, we expect the wave iii high to form soon. Afterward, we anticipate a sharp wave iv correction, with downside potential toward the $122.68 support.

Palo Alto Networks: Top Established!PANW reached a new peak at $207.24 on December 16. Although the price briefly moved above the significant $200 threshold, it failed to gain traction at higher levels. Thus, we now consider the top of the beige wave B as established and position the stock in the third and final stage of the larger wave (II) correction. From the wave B peak, the stock has already seen a pullback of approximately 20%. We anticipate that this downward movement will continue and ultimately reach our blue Target Zone between $104.74 and $55.73, where the ongoing downtrend should find its bottom. In our alternative scenario, we assign a 30% probability to an immediate breach of the resistance at $207.24. In this case, we would have to reckon with a new high of the blue wave alt.(I).

Possible wave counts of chart NVIDIA dip now then upHello Friends,
Today we have plotted Elliott wave counts on NVIDIA Corporations chart Technical Analysis Case study, In this study we used Elliott Wave Theory & Structures, it involves multiple possibilities, and the analysis presented focuses on one potential scenario. The provided information is for educational purposes only, not trading advice. There's a risk of being completely wrong, and users are warned not to trade or invest solely based on this study. The content is not an advisory and does not guarantee profits, We are not responsible for any kind of profits and losses; individuals should consult a financial advisor before making any trading or investment decisions.
I am not Sebi registered analyst.
My studies are for educational purpose only.
Please Consult your financial advisor before trading or investing.
I am not responsible for any kinds of your profits and your losses.
Most investors treat trading as a hobby because they have a full-time job doing something else.
However, If you treat trading like a business, it will pay you like a business.
If you treat like a hobby, hobbies don't pay, they cost you...!
Hope this post is helpful to community
Thanks
RK💕
Disclaimer and Risk Warning.
The analysis and discussion provided on in.tradingview.com is intended for educational purposes only and should not be relied upon for trading decisions. RK_Charts is not an investment adviser and the information provided here should not be taken as professional investment advice. Before buying or selling any investments, securities, or precious metals, it is recommended that you conduct your own due diligence. RK_Charts does not share in your profits and will not take responsibility for any losses you may incur. So Please Consult your financial advisor before trading or investing.

Mphasis Big move to continueMphasis Can start the rise it started 2-3 months back & can break all time high till & go till 4000 levels in the coming 2-3 months.
Time wise this stock looks good for buying Kepp stop loss near 2900-3000 as per your risk appetite

Tata TechEnter NSE:TATATECH at CMP, with an SL of 1010.
It seems that this gem from the Tata Sons empire is on the verge of an up-move in the coming weeks.
Those willing to hold it for longer horizons may hold it till a close below 971.4, post which must take an exit.
The formation of a reversal pattern post a prolonged downtrend, along with presence of a valid trendline with upto 4 touchpoints, makes this a significant breakout.
This may also be a good time to allocate to this stock, from a longer term standpoint.
**********************************************************************************************************************
This is for illustrative purposes only. Do not construe this as investment advice

GENESYS potential breakout - 5 months base
- cup & handle pattern
- trading near base high
- trading above key EMAs
- high relative strength
- strong sector (IT sector)

ZAGGLE potential breakout - 6 Months Rounding bottom base pattern.
- Supply tested multiple times.
- Trading near base high.
- Tight range price action.
- Resting on 9EMA.
- High relative strength.

Momentum Trading Picks - IT Stock Bsoft.As you can see on the weekly chart Bsoft has broken its major supports and RSI is also giving sell signals According to the chart stop loss will be rupees ₹ 586 on a closing basis and the target will be rupees ₹ 475.

Wipro ready for a turnaroundIn the recent bull rally, a strong stock has been consolidating in one of the underperforming sectors (IT) in the recent bull run. The sector is coming out of consolidation and Wipro looks strong to head upward from here
Entry above 575
Stop loss below 520
Target 722/752

WIPRO: Out of the shell ?- The chart is pretty self-explanatory but here is the gist:
- 10 months of pure sideways consolidation (I get it. Wipro tested Investor's patience, the most)
- Breaks the support only to reverse back into the range, trapping sellers
- On the verge of breaking its range for the cage-free price momentum
- Also, the Indian IT sector is approaching its critical resistance for the third time. (link in the comment section)
- Don't let the analysis end here! Boost, comment, and follow for more such insightful posts
⚠️Disclaimer: We are not registered advisors. The views expressed here are merely personal opinions. Irrespective of the language used, Nothing mentioned here should be considered as advice or recommendation. Please consult with your financial advisors before making any investment decisions. Like everybody else, we too can be wrong at times ✌🏻
