Itsector

MPHASIS - 12/11/2022-LOOKING GOOD#MPHASIS... ✅
🔹🔹🔹🔹🔹🔹🔹🔹🔹
👇👇👇👇👇👇👇👇👇👇👇👇
INTRADAY/ Short term delivery call as well 👍
All levels given in charts ...
IF good potential seen then we work in options also
👉if activate then possible a huge movement Keep eye on this ...
We take trade only when it activates...
📚📚👁🚀 📚
🚀🚀🚀🚀🚀🚀🚀🚀
Possible to give good target
👍👍👍👍👍👍👍👍

LTTSHello & welcome to this analysis
LTTS from May 2021 lows formed a Bullish Harmonic Bat in July 2022. From there it has almost given a 62% retracement to now form a Bearish ABCD Pattern suggesting some consolidation to pullback till 3900 until it starts sustaining above 4400.
Not an area to go aggressive fresh long right now, more of a pullback for entry and then a likely rally for 5400 and more.
Hope this analysis is of help to both traders and investors

AFFLE, TREND ANALYSIS!the lines drawn are the trends, based on the market behaviors.
some lines are short term ones, and chart patterns. i will make you go through it.
the two black line and one dark black line, are the major trend, where the stock should be following, but since IT sector had gone week past year, and much FII selling had come through, the stock needs to come to its lower support area.
the two dark red lines are drawn, that says the trend for the bear market and for the short term. the stock has supported it several times, trading in that zone. the stock is strong enough, to not break its support.
whenever the market has gone bearish, those times the stock supported the red line(support).
further, moving to the chart pattern, the blue lines are those. you could see a beautiful triangle formation, and the path for both sides is drawn. but i mostly think, the stock will be carried upward, since NIFTY has given its breakout, and many global situations have mostly factored in the indices.
the green line, drawn is a good support for a breakout trading, that line has been touched many times, and this time it has a good change to break it out, without further giving a pullback or coming to the past range.
the stock is at a good discount, if it breaks the chart pattern(drawn in blue), then i will be going short, otherwise, its a great to buy.
trade with a stoploss. the stock is currently, about 25% at a discount.

OFSS counter trend rally OFSS is in counter trend rally as a wave ABC, in which wave A and wave B are completed and now possibly we are ready to unfold wave C of B retracement in daily time frame.
Price is in upper part of Bollinger band in daily
Macd in daily positive crossover and Uptick
Macd in weekly positive crossover and Uptick
Rsi in daily above 60 uptick
Dmi adx also positive in daily time frame
Most traders treat trading as a hobby because they have a full-time job doing something else. However, If you treat trading like a business, it will pay you like a business. If you treat like a hobby, hobbies don't pay, they cost you....!
Disclaimer
I am not sebi registered analyst
My studies are Educational purpose only
Please consult your Financial advisor before trading or investing
I am not responsible for any any kind of profit or loss

Bulls Entering into CoforgeCoforge coming out of the range is a sign of entering the bulls. Having a bullish bias on IT pack

intellectintellect made & broke above inverted head n shoulders pattern on smaller time frame with decent volumes.
Could be bought with mentioned stoploss & targets.
Dont trade if it opens higher near target or near stoploss.

NIFTY IT, STILL DID NOT GAVE A BREAKOUT!! MOVING AVERAGE!!just have a look at the two moving averages(50 and 100 ones), everything is understandable from this point.
its time to invest in most of the best IT stocks.
many FII have taken out there money from this stock.
IT sector is in the range to give a breakout from MID OF JUNE.
IT secotr is in great discount. good oppournity for swing trading. long term investment, and for breakout trading too.

COFORGE, RSI DIVERGENCE!!RSI says everything, and its divergence is a great strategy to go bullish on the stock. currently IT sector is also trading down, i have uploaded its idea many at times. so anyone can go long on this stock, the dark 2 black lines are the range where we need to start looking out for the stock for some actions.

Wipro formed Spinning Candle at weekly supportWipro has been respecting the 400- 385 zone for the past many weeks.
And this week, it formed a spinning pattern at the same support zone.
Now the chances are high that above 400 levels, it could test 420-430 levels in no time.
On the hourly timeframe, we could see price forming double bottom formation, now sustaining 392, it could move toward 400 levels initially.
400 level may act as temporary resistance and any breakout above this level, the stock would most likely be moving towards 420-430 levels.

NIFTY IT, TARGETS!!!the dark purple lines shows, if the markets go further down, then it will touch 24533 level, which basically will not happen, because markets are recovering now, and the down fall of it sector, was for a particularly us fed hikes , and now the news has been factored in the indices.
coming next to the purple line(the dark orange line), markets will reach till that support only, if markets dont faces any crash or such.
the third line(black line), shows a breakout line to reach the level of 34533. the indice will show its bull run and will give a breakout to black line.
i have even shown the MA-50,100, for your analysis.
very bullish for the IT SECTOR AND ITS ALL STOCKS.

Nifty IT Levels (Support & Resistance)Next Nifty IT Support & Resistance Levels On 1 Day Timeframe
NSE:CNXIT

InfoEdge / Naukri BreakdownThe stock has broken down and retested, therefore may undergo a mild correction in the short term. Trade is supported by Resitances Nearby.
Risk Reward Ratio - 1.5:1
SL is placed above the resistance zone & the upper trendline. The target is placed near support.

TCSHello and welcome to this analysis
TCS is attempting a breakout from its slanting channel which suggest a possible upside till 3350-3450 as long as it does not break below 3075
It could be the rank outperformer among IT stocks in the month of AUGUST.

HCL TECHNOLOGY swing trade HCl tech here bat & butterfly pattern complete looking good for swing & midium term.

LARSEN & TOUBRO, first good stock in IT sector hey guys ,
IT sector was in a constant downtrend for a long trend ,
but now ,
we can see some CORRECTION in IT sector ,
and the first best company to invest in is,
LARSEN & TOUBRO
this stock was moving in a fixed downtrend,
and this stock was making a pattern called
FALLING WEDGE PATTERN
and now this stock has crossed it's resistance ( of this pattern )
and we can see a GREAT BIG GREEN CANDLE ,
therefore , i suggest that traders should buy this stock
and earn high returns ,
also, LARSEN AND TUOBRO is a well established company ,
fundamentals are also good
therefore, there are less chances of BULL TRAP for traders ,
BUT FORST CONSIDER THE GLOBAL MARKET SITUATIONS,
1. INFLATION
2. WAR
3. RISING BANK RATES
4. INCREASING EXPORT DUTIES ON CRUDE OIL
AFTER CONAIDERING THESE SITUATIONS YOU CAN BUY THIS STOCK AND EARN HIGH RETURNS ,
😀😀

Endurance BreakoutThe stock has broken out and retested, therefore may undergo a reversal rally. Trade is supported by Supports Nearby.
Risk Reward Ratio - 2:1
SL is placed below the support zone & the lower trendline. The target is placed near resistance.

L&T Technology Breakout RetestThe stock has broken out and retested, therefore may undergo a reversal rally. Trade is supported by Supports Nearby.
Risk Reward Ratio - 2:1
SL is placed below the support zone & the lower trendline. The target is placed near resistance.

NIFTY ITHello & welcome to this analysis on the IT Index.
With Q4 results starting from 2nd week of April, IT stocks will once again be in limelight.
If the index can sustain above 36700 it could lead to rally till 37750-38000 where it has a line of polarity besides a Bearish Harmonic Cypher.
This continuation of bullish outlook is valid till its above 36000. Failure to hold it would take it down to 35250-34500.
Key levels to watch out on both sides 36000-36800 for a trend direction move.

Mphasis BreakoutThe stock has broken out and retested, therefore may undergo a reversal rally. Trade is supported by Supports Nearby.
Risk Reward Ratio - 2:1
SL is placed below the support zone & the lower trendline. The target is placed near resistance.

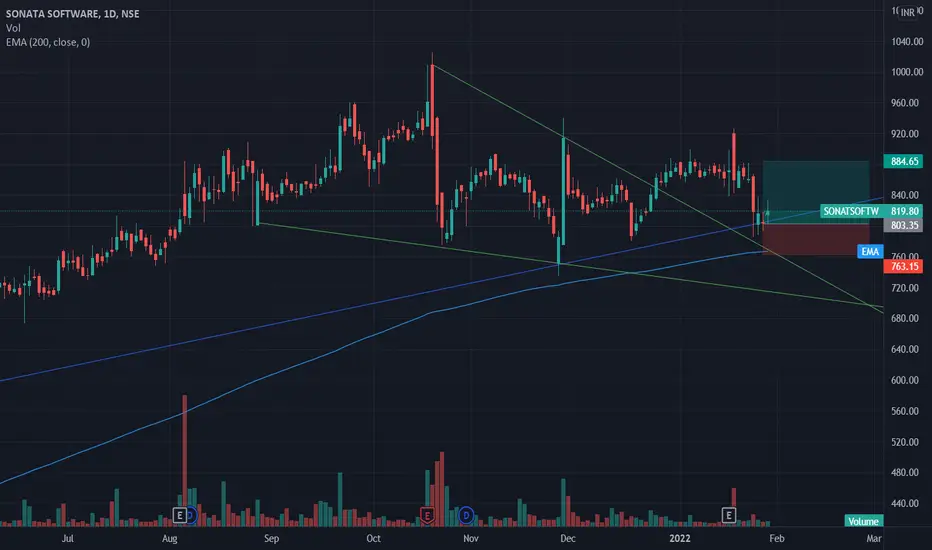
Sonata Software ReversalThe stock has reached lower trendline and may undergo a reversal rally. Trade is supported by brokerage calls and Supports Nearby.
Risk Reward Ratio - 2:1
SL is placed below support zone & the lower trendline. The target is placed near resistance.
Market is bearish , so take positions carefully.
IT SECTOR : Still in uptrendIT Sector weekly chart shows uptrend is still intact. Index trading above 30 WEMA which suggests it is in Stage2- Uptrend. Relative Strength is positive as against the Nifty 50 Index. Larger stocks within the index have seen decent correction & seems to be forming bases for next leg of move. Will be considered weak if it breaks down below 30 WEMA. Would start next leg of upmove on breakout of the current trading (box) range marked.
Only for educational purposes, not a buy/sell recommendation.

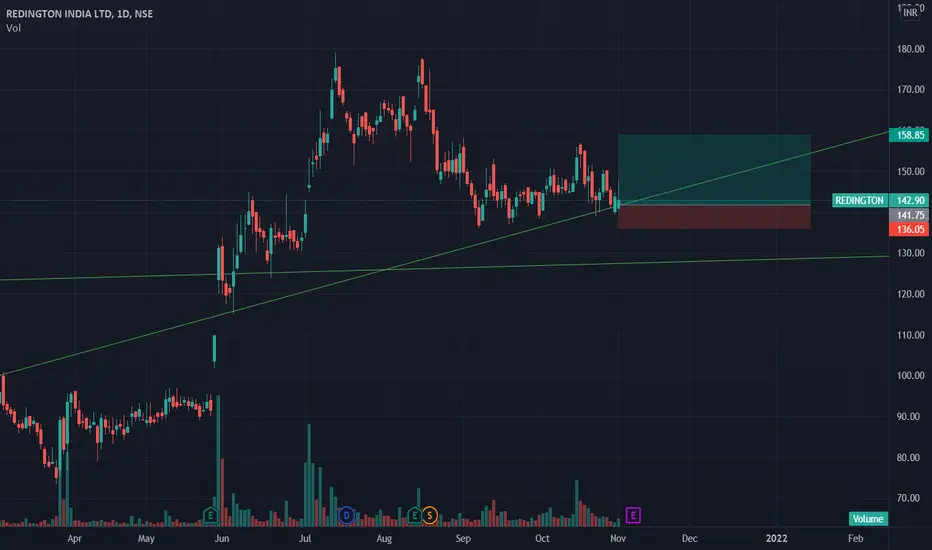
Redington Retest ReversalThe stock has reached lower trendline and may undergo a reversal rally. Trade is supported by brokerage calls and Supports Nearby.
Risk Reward Ratio - 3:1
SL is placed below support zone & the lower trendline. The target is placed near resistance.