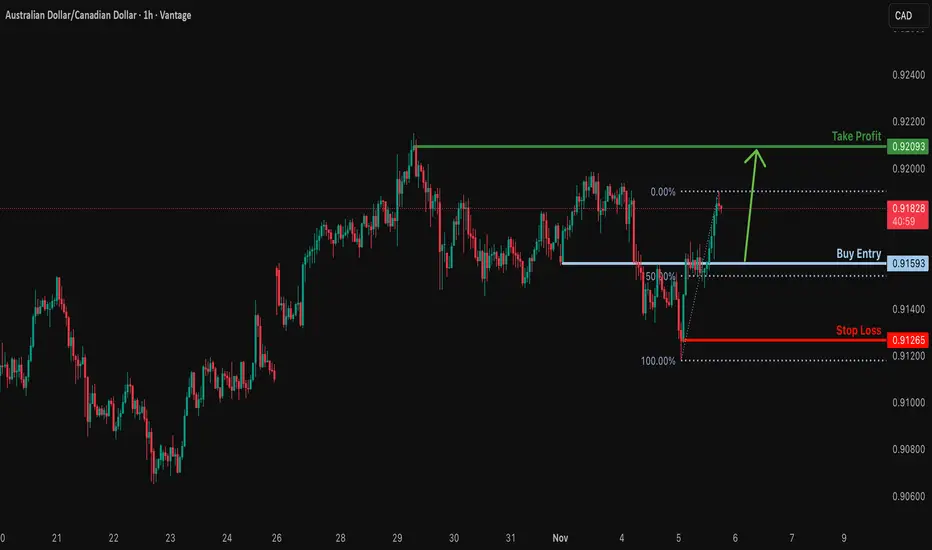
Bullish bounce off overlap support?AUD/CAD is falling towards the support level, which is a pullback support that is slightly above the 50% Fibonacci retracement and could bounce from this level to our take profit.
Entry: 0.91593
Why we like it:
There is a pullback support that is slightly above the 50% Fibonacci retracement.
Stop loss: 0.91265
Why we like it:
There is a swing low support level.
Take profit: 0.92093
Why we like it:
There is a swing resistance level.
Enjoying your TradingView experience? Review us!
Please be advised that the information presented on TradingView is provided to Vantage (‘Vantage Global Limited’, ‘we’) by a third-party provider (‘Everest Fortune Group’). Please be reminded that you are solely responsible for the trading decisions on your account. There is a very high degree of risk involved in trading. Any information and/or content is intended entirely for research, educational and informational purposes only and does not constitute investment or consultation advice or investment strategy. The information is not tailored to the investment needs of any specific person and therefore does not involve a consideration of any of the investment objectives, financial situation or needs of any viewer that may receive it. Kindly also note that past performance is not a reliable indicator of future results. Actual results may differ materially from those anticipated in forward-looking or past performance statements. We assume no liability as to the accuracy or completeness of any of the information and/or content provided herein and the Company cannot be held responsible for any omission, mistake nor for any loss or damage including without limitation to any loss of profit which may arise from reliance on any information supplied by Everest Fortune Group.
J-CAD
Eurcad looking bullish here after fake out now formed heads and shoulders, currently trying to clear neckline area, after successful breakout it can rebound, and can give 150 to 180 pips bullish wave

#040: Short Investment Opportunity on CAD/CHF
In recent days, the Canadian dollar-Swiss franc cross has entered a market configuration closely resembling typical institutional distribution phases.
After weeks of moderate gains, supported by a temporary risk-on sentiment and a moderate recovery in the CAD linked to stable oil prices, the technical structure is now beginning to show signs of losing momentum.
The latest medium-high timeframe candlesticks reveal a progressive compression of the highs, accompanied by volatility that remains contained but with a declining volume delta.
This type of behavior, in intermarket readings, suggests that large operators are reducing long positions rather than accumulating new ones.
At the same time, the Swiss franc is gradually benefiting from a renewed search for protection:
rising global uncertainty and declining real yields are pushing many desks to reactivate the franc as a tactical safe haven.
This isn't yet an impulsive move, but a shift in sentiment that's beginning to be reflected in several crosses tied to the Swiss currency.
On the Canadian front, the macro outlook remains mixed:
The Bank of Canada maintains a cautious stance, openly declaring that monetary policy will remain restrictive "for an extended period," but the historical correlation between the CAD and the commodity cycle continues to make the currency vulnerable to a weakening crude oil price.
In this context, profit-taking at highs becomes natural.
From a microstructural perspective, the current price range represents a fragile equilibrium point:
The presence of passive orders concentrated in a narrow area could amplify the movement if the market decisively breaches the lower distribution margin.
A strong catalyst isn't needed; a return of risk aversion or a repricing of global interest rates is enough to trigger a rotation toward the CHF.

Potential bullish reversal?EUR/CAD has bounced off the pivot, which is a multi-swing low support that aligns with the 61.8% Fibonacci projection, and could rise to the 1st resistance.
Pivot: 1.6164
1st Support: 1.6164
1st Resistance: 1.6309
Disclaimer:
The above opinions given constitute general market commentary, and do not constitute the opinion or advice of IC Markets or any form of personal or investment advice.
Any opinions, news, research, analyses, prices, other information, or links to third-party sites contained on this website are provided on an "as-is" basis, are intended only to be informative, is not an advice nor a recommendation, nor research, or a record of our trading prices, or an offer of, or solicitation for a transaction in any financial instrument and thus should not be treated as such. The information provided does not involve any specific investment objectives, financial situation and needs of any specific person who may receive it. Please be aware, that past performance is not a reliable indicator of future performance and/or results. Past Performance or Forward-looking scenarios based upon the reasonable beliefs of the third-party provider are not a guarantee of future performance. Actual results may differ materially from those anticipated in forward-looking or past performance statements. IC Markets makes no representation or warranty and assumes no liability as to the accuracy or completeness of the information provided, nor any loss arising from any investment based on a recommendation, forecast or any information supplied by any third-party.

Bullish reversal off Fibonacci confluence?CAD/JPY is falling towards the pivot, which acts as a pullback support and could bounce to the pullback resistance.
Pivot: 107.92
1st Support: 106.86
1st Resistance: 109.49
Disclaimer:
The above opinions given constitute general market commentary, and do not constitute the opinion or advice of IC Markets or any form of personal or investment advice.
Any opinions, news, research, analyses, prices, other information, or links to third-party sites contained on this website are provided on an "as-is" basis, are intended only to be informative, is not an advice nor a recommendation, nor research, or a record of our trading prices, or an offer of, or solicitation for a transaction in any financial instrument and thus should not be treated as such. The information provided does not involve any specific investment objectives, financial situation and needs of any specific person who may receive it. Please be aware, that past performance is not a reliable indicator of future performance and/or results. Past Performance or Forward-looking scenarios based upon the reasonable beliefs of the third-party provider are not a guarantee of future performance. Actual results may differ materially from those anticipated in forward-looking or past performance statements. IC Markets makes no representation or warranty and assumes no liability as to the accuracy or completeness of the information provided, nor any loss arising from any investment based on a recommendation, forecast or any information supplied by any third-party.

Bearish drop off?CAD/CHF has rejected off the pivot which is a pullback resistance and could drop to the 1st support which is an overlap support that aligns with the 38.2% Fibonacci retracement.
Pivot: 0.57489
1st Support: 0.56994
1st Resistance: 0.58011
Disclaimer:
The above opinions given constitute general market commentary, and do not constitute the opinion or advice of IC Markets or any form of personal or investment advice.
Any opinions, news, research, analyses, prices, other information, or links to third-party sites contained on this website are provided on an "as-is" basis, are intended only to be informative, is not an advice nor a recommendation, nor research, or a record of our trading prices, or an offer of, or solicitation for a transaction in any financial instrument and thus should not be treated as such. The information provided does not involve any specific investment objectives, financial situation and needs of any specific person who may receive it. Please be aware, that past performance is not a reliable indicator of future performance and/or results. Past Performance or Forward-looking scenarios based upon the reasonable beliefs of the third-party provider are not a guarantee of future performance. Actual results may differ materially from those anticipated in forward-looking or past performance statements. IC Markets makes no representation or warranty and assumes no liability as to the accuracy or completeness of the information provided, nor any loss arising from any investment based on a recommendation, forecast or any information supplied by any third-party.

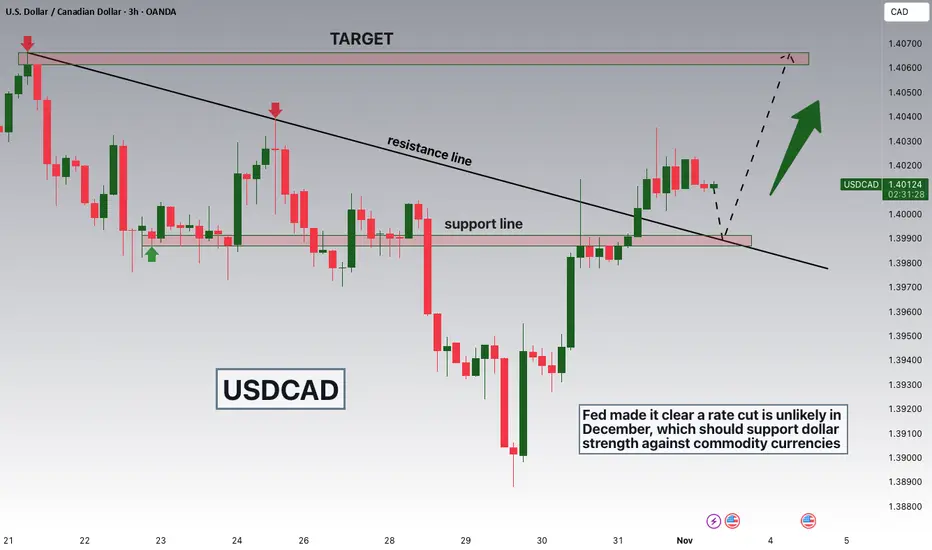
USDCAD Breakout and Potential RetraceHey Traders, in today's trading session we are monitoring USDCAD for a buying opportunity around 1.39900 zone, USDCAD was trading in a downtrend and successfully managed to break it out. Currently is in a correction phase in which it is approaching the retrace area at 1.39900 support and resistance area.
Fundamentally fed made it clear that a rate cut is unlikely in December which should strengthen the dollar against commodity currency!
Trade safe, Joe.
Bulish bounce off?The Loonie (USD/CAD) has bounced off the pivot, which is a pullback support, and could rise to the 61.8% Fibonacci retracement.
Pivot: 1.3913
1st Suport: 1.3736
1st Resistance: 1.4259
Disclaimer:
The above opinions given constitute general market commentary, and do not constitute the opinion or advice of IC Markets or any form of personal or investment advice.
Any opinions, news, research, analyses, prices, other information, or links to third-party sites contained on this website are provided on an "as-is" basis, are intended only to be informative, is not an advice nor a recommendation, nor research, or a record of our trading prices, or an offer of, or solicitation for a transaction in any financial instrument and thus should not be treated as such. The information provided does not involve any specific investment objectives, financial situation and needs of any specific person who may receive it. Please be aware, that past performance is not a reliable indicator of future performance and/or results. Past Performance or Forward-looking scenarios based upon the reasonable beliefs of the third-party provider are not a guarantee of future performance. Actual results may differ materially from those anticipated in forward-looking or past performance statements. IC Markets makes no representation or warranty and assumes no liability as to the accuracy or completeness of the information provided, nor any loss arising from any investment based on a recommendation, forecast or any information supplied by any third-party.

Could we see a bearish reversal from here?USD/CAD is reacting off the resistance level, which is an overlap resistance and could reverse from this level to our take profit.
Entry: 1.4022
Why we like it:
There is an overlap resistance level.
Stop loss: 1.4079
Why we like it:
There is a swing high resistance.
Take profit: 1.3947
Why we like it:
There is an overlap support that aligns with the 61.8% Fibonacci retracement.
Enjoying your TradingView experience? Review us!
Please be advised that the information presented on TradingView is provided to Vantage (‘Vantage Global Limited’, ‘we’) by a third-party provider (‘Everest Fortune Group’). Please be reminded that you are solely responsible for the trading decisions on your account. There is a very high degree of risk involved in trading. Any information and/or content is intended entirely for research, educational and informational purposes only and does not constitute investment or consultation advice or investment strategy. The information is not tailored to the investment needs of any specific person and therefore does not involve a consideration of any of the investment objectives, financial situation or needs of any viewer that may receive it. Kindly also note that past performance is not a reliable indicator of future results. Actual results may differ materially from those anticipated in forward-looking or past performance statements. We assume no liability as to the accuracy or completeness of any of the information and/or content provided herein and the Company cannot be held responsible for any omission, mistake nor for any loss or damage including without limitation to any loss of profit which may arise from reliance on any information supplied by Everest Fortune Group.

Bearish reversal of major resistance?USD/CAD is reacting off the resistance level, which is an overlap resistance that is slightly above the 61.8% Fibonacci retracement and could drop from this level to our take profit.
Entry: 1.4022
Why we like it:
There is an overlap resistance that is slightly above the 61.8% Fibonacci retracement.
Stop loss: 1.4079
Why we like it:
There is a swing high resistance level.
Take profit: 1.3890
Why we like it:
There is an overlap support level.
Enjoying your TradingView experience? Review us!

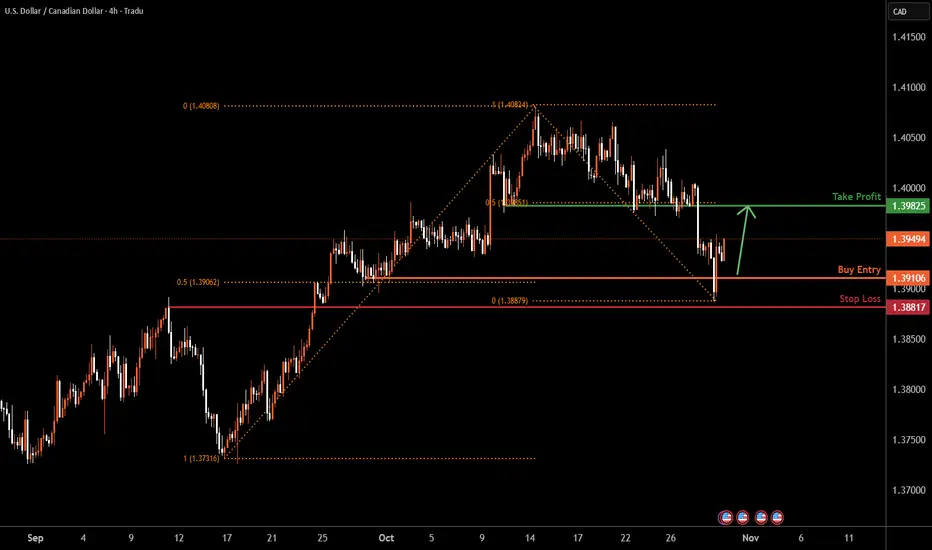
USDCAD H4 | Potential Bullish Bounce Off SupportBased on the H4 chart analysis, we can see that the price has bounced off the buy entry, which is a pullback support that lines up with the 50% Fibonacci retracemnt and could rise from this level to the take profit.
Buy entry is at 1.3910, whichis a pullback support that lines up with the 50% Fibonacci retracement.
Stop loss is at 1.3881, whichis a pullback support.
Take profit is at 1.3982, which s a pullback resistance that lines up with the 50% Fibonacci retracemnt.
Stratos Markets Limited (tradu.com ):
CFDs are complex instruments and come with a high risk of losing money rapidly due to leverage. 68% of retail investor accounts lose money when trading CFDs with this provider. You should consider whether you understand how CFDs work and whether you can afford to take the high risk of losing your money.
Stratos Europe Ltd (tradu.com ):
CFDs are complex instruments and come with a high risk of losing money rapidly due to leverage. 70% of retail investor accounts lose money when trading CFDs with this provider. You should consider whether you understand how CFDs work and whether you can afford to take the high risk of losing your money.
Potential bullish reversal?The Loonie (USD/CAD) has bounced off the pivot and could rise to the 1st resistance.
Pivot: 1.3913
1st Support: 1.3864
1st Resistance: 1.3981
Disclaimer:
The above opinions given constitute general market commentary, and do not constitute the opinion or advice of IC Markets or any form of personal or investment advice.
Any opinions, news, research, analyses, prices, other information, or links to third-party sites contained on this website are provided on an "as-is" basis, are intended only to be informative, is not an advice nor a recommendation, nor research, or a record of our trading prices, or an offer of, or solicitation for a transaction in any financial instrument and thus should not be treated as such. The information provided does not involve any specific investment objectives, financial situation and needs of any specific person who may receive it. Please be aware, that past performance is not a reliable indicator of future performance and/or results. Past Performance or Forward-looking scenarios based upon the reasonable beliefs of the third-party provider are not a guarantee of future performance. Actual results may differ materially from those anticipated in forward-looking or past performance statements. IC Markets makes no representation or warranty and assumes no liability as to the accuracy or completeness of the information provided, nor any loss arising from any investment based on a recommendation, forecast or any information supplied by any third-party.

Bullish bounce off pullback support?AUD/CAD is falling towards the support level, which is a pullback support that aligns with the 38.2% Fibonacci retracement and could bounce from this level to our take profit.
Entry: 0.91526
Why we like it:
There is a pullback support that aligns with the 38.2% Fibonacci retracement.
Stop loss: 0.90988
Why we like it:
There is a pullback support that aligns with the 78.6% Fibonacci retracement.
Take profit: 0.92437
Why we like it:
There is a swing high resistance level.
Enjoying your TradingView experience? Review us!
Please be advised that the information presented on TradingView is provided to Vantage (‘Vantage Global Limited’, ‘we’) by a third-party provider (‘Everest Fortune Group’). Please be reminded that you are solely responsible for the trading decisions on your account. There is a very high degree of risk involved in trading. Any information and/or content is intended entirely for research, educational and informational purposes only and does not constitute investment or consultation advice or investment strategy. The information is not tailored to the investment needs of any specific person and therefore does not involve a consideration of any of the investment objectives, financial situation or needs of any viewer that may receive it. Kindly also note that past performance is not a reliable indicator of future results. Actual results may differ materially from those anticipated in forward-looking or past performance statements. We assume no liability as to the accuracy or completeness of any of the information and/or content provided herein and the Company cannot be held responsible for any omission, mistake nor for any loss or damage including without limitation to any loss of profit which may arise from reliance on any information supplied by Everest Fortune Group.

USDCAD H4 | Bullish Bounce off Pullback SupportLoonie (USD/CAD) is falling towards the buy entry which is a pullback support that aligns with the 50% Fibonacci retracement and could bounce from this level to the take profit.
Buy entry is at 1.3910, which is a pullback support that aligns with th 50% Fibonacci retracemnt.
Stop loss is at 1.3881, which is an overlap support.
Take profit is at 1.3968, whichis an overlap resistance.
Stratos Markets Limited (tradu.com ):
CFDs are complex instruments and come with a high risk of losing money rapidly due to leverage. 68% of retail investor accounts lose money when trading CFDs with this provider. You should consider whether you understand how CFDs work and whether you can afford to take the high risk of losing your money.
Stratos Europe Ltd (tradu.com ):
CFDs are complex instruments and come with a high risk of losing money rapidly due to leverage. 70% of retail investor accounts lose money when trading CFDs with this provider. You should consider whether you understand how CFDs work and whether you can afford to take the high risk of losing your money.

Falling towards 50% Fibonacci support?USD/CAD is falling towards the support level which is a pullback support that aligns with the 50% Fibonacci retracement and could bounce from this level to our take profit.
Entry: 1.3910
Why we like it:
There is a pullback support level that aligns with the 50% Fibonacci retracement.
Stop loss: 1.3861
Why we like it:
There is a pullback support that is slightly below the 50% Fibonacci retracement.
Take profit: 1.3982
Why we like it:
There is a pullback resistance level.
Enjoying your TradingView experience? Review us!
Please be advised that the information presented on TradingView is provided to Vantage (‘Vantage Global Limited’, ‘we’) by a third-party provider (‘Everest Fortune Group’). Please be reminded that you are solely responsible for the trading decisions on your account. There is a very high degree of risk involved in trading. Any information and/or content is intended entirely for research, educational and informational purposes only and does not constitute investment or consultation advice or investment strategy. The information is not tailored to the investment needs of any specific person and therefore does not involve a consideration of any of the investment objectives, financial situation or needs of any viewer that may receive it. Kindly also note that past performance is not a reliable indicator of future results. Actual results may differ materially from those anticipated in forward-looking or past performance statements. We assume no liability as to the accuracy or completeness of any of the information and/or content provided herein and the Company cannot be held responsible for any omission, mistake nor for any loss or damage including without limitation to any loss of profit which may arise from reliance on any information supplied by Everest Fortune Group.

USDCAD Faces Pressure as DXY Correction Nears Key Resistance!!Hey Traders, in today’s trading session we are monitoring USDCAD for a potential selling opportunity around the 1.40200 zone.
The pair remains in a broader downtrend and is currently in a correction phase, approaching the trendline and resistance area at 1.40200.
From a macro perspective, the US Dollar Index (DXY) is testing its 98.900 channel resistance, where upside momentum may fade amid a weakening U.S. labour market and rising expectations for a dovish shift from the Fed.
A potential DXY rejection from that level could amplify downside pressure on USDCAD, especially if oil continues to find demand and supports the Canadian Dollar.
Next move: Watching for bearish confirmation near 1.40200 for potential continuation of the broader downtrend.
💬 What’s your view on USDCAD and the Dollar outlook this week? Share your thoughts below!

Bearish drop off?The Loonie (USD/CAD) is rising towards the pivot and could reverse to the 1st support.
Pivot: 1.4012
1st Support: 1.3969
1st Resistance: 1.4073
Disclaimer:
The above opinions given constitute general market commentary, and do not constitute the opinion or advice of IC Markets or any form of personal or investment advice.
Any opinions, news, research, analyses, prices, other information, or links to third-party sites contained on this website are provided on an "as-is" basis, are intended only to be informative, is not an advice nor a recommendation, nor research, or a record of our trading prices, or an offer of, or solicitation for a transaction in any financial instrument and thus should not be treated as such. The information provided does not involve any specific investment objectives, financial situation and needs of any specific person who may receive it. Please be aware, that past performance is not a reliable indicator of future performance and/or results. Past Performance or Forward-looking scenarios based upon the reasonable beliefs of the third-party provider are not a guarantee of future performance. Actual results may differ materially from those anticipated in forward-looking or past performance statements. IC Markets makes no representation or warranty and assumes no liability as to the accuracy or completeness of the information provided, nor any loss arising from any investment based on a recommendation, forecast or any information supplied by any third-party.

BULLISH ON GBP/CADGBP/CAD has completed its pullback to a nice demand/support zone and is now showing bullish presence.
I will be buying GBP/CAD looking to make 100-200 pips to the previous swing high.

USDCAD | Bearish Reversal Forming at Overlap ResistanceBased on the M30, we can see that the price is reacting off the sell entry whic is an overlap resistance and could drop from this level to the downside.
Sell entry is at 1.4004, which is an overlap resistance.
Stop loss is at 1.4019, which is a pullback resistance that aligns with the 61.8% Fibonacci retracement.
Take profit is at 1.3978, which is a multi swing low support.
Stratos Markets Limited (tradu.com ):
CFDs are complex instruments and come with a high risk of losing money rapidly due to leverage. 68% of retail investor accounts lose money when trading CFDs with this provider. You should consider whether you understand how CFDs work and whether you can afford to take the high risk of losing your money.
Stratos Europe Ltd (tradu.com ):
CFDs are complex instruments and come with a high risk of losing money rapidly due to leverage. 70% of retail investor accounts lose money when trading CFDs with this provider. You should consider whether you understand how CFDs work and whether you can afford to take the high risk of losing your money.

Bullish momentum expected?The Loonie (USD/CAD) is falling towards the pivot, which is a pullback support and could bounce to the 61.8% Fibonacci resistance.
Pivot: 1.3913
1st Support: 1.3753
1st Resistance: 1.4152
Disclaimer:
The above opinions given constitute general market commentary, and do not constitute the opinion or advice of IC Markets or any form of personal or investment advice.
Any opinions, news, research, analyses, prices, other information, or links to third-party sites contained on this website are provided on an "as-is" basis, are intended only to be informative, is not an advice nor a recommendation, nor research, or a record of our trading prices, or an offer of, or solicitation for a transaction in any financial instrument and thus should not be treated as such. The information provided does not involve any specific investment objectives, financial situation and needs of any specific person who may receive it. Please be aware, that past performance is not a reliable indicator of future performance and/or results. Past Performance or Forward-looking scenarios based upon the reasonable beliefs of the third-party provider are not a guarantee of future performance. Actual results may differ materially from those anticipated in forward-looking or past performance statements. IC Markets makes no representation or warranty and assumes no liability as to the accuracy or completeness of the information provided, nor any loss arising from any investment based on a recommendation, forecast or any information supplied by any third-party.

Bearish drop off for the Loonie?The price has reacted off the resistance level, which is a pullback resistance and could potentially drop from this level to our take profit.
Entry: 1.4003
Why we like it:
There is a pullback resistance level.
Stop loss: 1.4027
Why we like it:
There is a swing high resistance level.
Take profit: 1.3969
Why we like it:
There is a pullback support level.1
Enjoying your TradingView experience? Review us!
Please be advised that the information presented on TradingView is provided to Vantage (‘Vantage Global Limited’, ‘we’) by a third-party provider (‘Everest Fortune Group’). Please be reminded that you are solely responsible for the trading decisions on your account. There is a very high degree of risk involved in trading. Any information and/or content is intended entirely for research, educational and informational purposes only and does not constitute investment or consultation advice or investment strategy. The information is not tailored to the investment needs of any specific person and therefore does not involve a consideration of any of the investment objectives, financial situation or needs of any viewer that may receive it. Kindly also note that past performance is not a reliable indicator of future results. Actual results may differ materially from those anticipated in forward-looking or past performance statements. We assume no liability as to the accuracy or completeness of any of the information and/or content provided herein and the Company cannot be held responsible for any omission, mistake nor for any loss or damage including without limitation to any loss of profit which may arise from reliance on any information supplied by Everest Fortune Group.

#036: USD/CAD Long Investment Opportunity
In recent days, the USD/CAD cross has shown a consolidation phase within a medium-term structure characterized by progressively higher lows and a gradual absorption of supply in the lower part of the range. Hello, I'm Forex Trader Andrea Russo, an independent trader and prop trader with $200,000 in capital under management. Thank you in advance for your time.
Observing the price behavior in the last 8-hour candles, we see how buyers have resolutely defended the support zone, repelling any attempts to decline with increasing volume and clear wicks below key levels.
This type of price action, typical of accumulation environments, suggests that strong hands are gradually building long positions in anticipation of a new bullish leg.
On a technical level, the break of intermediate micro-resistance, accompanied by growing momentum on the US dollar and a weakening Canadian dollar, increases the likelihood of an extension into higher liquidity areas.
This movement would be consistent with the rebalancing dynamic of order flow, which in recent sessions has shown a marked reduction in short-term pressure.
At the intermarket level, the weakening energy market continues to be a drag on the Canadian currency, historically correlated with oil prices.
At the same time, the stability of US yields and still-tight interest rate expectations keep the greenback in a position of relative strength.
In summary, the overall picture shows a favorable environment for a continuation of the bullish movement, provided the price maintains its current support structure and confirms solid closes above minor resistance levels.

USDCAD H1 | Bearish Reversal in PlayLoonie (USD/CAD) has rejected off the sell entry which is a pullback resistance that aligns with he 50% Fibonacci retracement and could drop from this level to the downside.
sell entry is at 1.4020, which is a pullback resistance that lines up with the 50% Fibonacci retracement.
Stop loss is at 1.4043, which is a pullback resistance that lines up with he 78.6% Fibonacci retracement.
Take profit is at 1.3975, whic is a multi swing low support.
Stratos Markets Limited (tradu.com ):
CFDs are complex instruments and come with a high risk of losing money rapidly due to leverage. 68% of retail investor accounts lose money when trading CFDs with this provider. You should consider whether you understand how CFDs work and whether you can afford to take the high risk of losing your money.
Stratos Europe Ltd (tradu.com ):
CFDs are complex instruments and come with a high risk of losing money rapidly due to leverage. 70% of retail investor accounts lose money when trading CFDs with this provider. You should consider whether you understand how CFDs work and whether you can afford to take the high risk of losing your money.
