COMPREHENSIVE TECHNICAL ANALYSIS: INTRADAY & SWING TRADE SETUP 📊 EURUSD (1.16272) - COMPREHENSIVE TECHNICAL ANALYSIS: INTRADAY & SWING TRADE SETUP 📊
October 27-31, 2025 | Multiple Timeframe Deep Dive
🎯 EXECUTIVE SUMMARY 🎯
Current Spot: 1.16272 | Analysis Date: Oct 25, 2025 | Focus: 5M-1D Timeframes | Strategy: Intraday & Swing Trade
━━━━━━━━━━━━━━━━━━━━━━━━━━━━━━━━━
📈 1. MULTI-TIMEFRAME TREND ANALYSIS & DOW THEORY APPLICATION 📈
🔍 Daily (1D) Timeframe - Primary Trend Direction
The 1D chart reveals a consolidation phase with bullish bias . Elliott Wave structure suggests we're completing a 5th wave extension after a 4-wave correction. Dow Theory confirms higher lows forming around 1.1580-1.1600 support levels. The uptrend remains intact with RSI hovering in 40-60 zone (neutral-bullish). VWAP at 1.1620 acts as dynamic support.
⏰ 4H Timeframe - Swing Trade Entry Signals
The 4H setup shows bullish flag formation near 1.1625. Bollinger Bands are tightening, signaling potential breakout. RSI at 55-60 indicates strength without overbought conditions. Ichimoku Cloud shows bullish alignment with price above all moving averages. Target: 1.1680-1.1720 for swing positions.
🔥 1H to 5M Intraday Confluence
1H chart displays ascending triangle pattern with resistance at 1.1650. Harmonic patterns suggest Bullish Gartley forming near 1.1580 level—ideal for aggressive intraday entries. 30M shows clean EMA crossover (50>200 EMA bullish). Volume profile confirms institutional accumulation between 1.1590-1.1620.
━━━━━━━━━━━━━━━━━━━━━━━━━━━━━━━━━
🎪 2. ENTRY & EXIT STRATEGY + WYCKOFF METHOD 🎪
SWING TRADE ENTRIES (4H/1D): Buy breakout above 1.1650 with stop @ 1.1580 (Risk:Reward 1:3). Wyckoff Spring Pattern validation near support confirms institutional absorption.
INTRADAY ENTRIES (5M-30M): Enter on 30M EMA crossovers + RSI < 30 rejections from support zones. Stochastic divergence on 15M indicates pullback entries around 1.1610-1.1615.
EXIT TARGETS: 1D: 1.1750 | 4H: 1.1705 | 1H: 1.1670 | Intraday: 1.1650 (first profit). Take-profit at resistance clusters identified via Gann angles.
STOP LOSS PLACEMENT: Swing: 1.1560 (below double bottom structure) | Intraday: 1.1600 (15-20 pips from entry).
💡 Pro Tip: Use Ichimoku Kijun-sen (26P) as dynamic stop—trail on breakouts above 1.1650.
━━━━━━━━━━━━━━━━━━━━━━━━━━━━━━━━━
🔔 3. REVERSAL SIGNALS & JAPANESE CANDLESTICK ANALYSIS 🔔
⚠️ BULLISH REVERSAL INDICATORS:
Hammer candlesticks forming at 1.1580 (5M/15M confluence). Engulfing patterns on 30M confirm buyer strength. Ichimoku Chikou Span crossing above price action validates trend reversal completion. Morning Star pattern visible on 1H—classic reversal signal.
⛔ BEARISH REVERSAL WARNINGS:
If price fails to break 1.1650 with declining volume, watch for Evening Star on 4H. Gann resistance at 1.1680 acts as rejection zone. RSI divergence (lower highs with price higher highs) on 1D would signal exhaustion. VWAP rejection could trigger short setups.
⚡ Key Level: 1.1645-1.1650 acts as Decision Point. Break = Bullish Continuation | Reject = Intraday Reversal
━━━━━━━━━━━━━━━━━━━━━━━━━━━━━━━━━
💥 4. BREAKOUT RECOGNITION & PATTERN FORMATIONS 💥
✅ Bullish Breakout Setup (PRIMARY):
Ascending triangle breakout above 1.1650 resistance on 1H timeframe. Volume confirmation: need 20%+ volume spike above 20-period MA. Elliott Wave target 1.1750-1.1800 after 5th wave completion. Bollinger Band upper band at 1.1680—natural extension target.
🚀 Harmonic Patterns Identified:
Bullish Gartley at 1.1580 (D-point) with PRZ 1.1605-1.1620. Bat pattern on 4H suggesting potential for 161.8% extension. Butterfly pattern on 1D targeting 1.1850 in extended bull scenario.
⚡ Risk Pattern - Rising Wedge (WARNING):
If price fails breakout, 4H shows rising wedge trap. Potential bearish breakdown to 1.1550 if wedge collapses. Monitor Bollinger Band squeeze on 30M—breakout imminent within 48 hours.
━━━━━━━━━━━━━━━━━━━━━━━━━━━━━━━━━
📊 5. VOLATILITY, PRICE ACTION & INDICATOR CONFLUENCE 📊
🌊 Bollinger Bands & Volatility Analysis:
Band width compressed to 150 pips (1D)—lowest in 10 days. This signals imminent volatility expansion. Intraday (5M/15M) bands widening, indicating increased participation. Price bouncing within middle band suggests continuation pattern.
📍 Support & Resistance Clusters:
SUPPORT: 1.1600 (Previous swing low) | 1.1580 (Gartley D-point) | 1.1560 (Double Bottom)
RESISTANCE: 1.1650 (Ascending Triangle apex) | 1.1680 (Bollinger upper + Gann angle) | 1.1720 (Weekly pivot)
VWAP LEVELS: Daily VWAP: 1.1620 (support) | Weekly VWAP: 1.1610 (support)
📈 Moving Average Crossovers - Trend Confirmation:
EMA 50 > EMA 200 (bullish alignment on all timeframes). SMA 20 above SMA 50 on 1H/4H = buy signal. 5M: Recent EMA crossover indicates intraday uptrend initiation. Price maintaining above all key MAs confirms Wyckoff accumulation completion.
🎯 Overbought/Oversold Conditions:
RSI: Currently 58-62 range (neutral-bullish, NOT overbought). Stochastic on 15M: 45-55 range with upside momentum. Ichimoku RSI indicator below 50—room for upside run. CCI on 5M near +100 (strong momentum without extreme overbought).
━━━━━━━━━━━━━━━━━━━━━━━━━━━━━━━━━
🎓 6. ADVANCED TECHNICAL THEORIES SYNTHESIS 🎓
⭐ Elliott Wave Structure: 5-3-5 Pattern Complete - Currently Wave 1 (up) of new cycle targeting 1.1800 minimum | Fibonacci Extensions: 161.8% from swing = 1.1750
⭐ Gann Theory Application: 45-degree angle resistance @ 1.1680 | Square of Nine support @ 1.1580 | Time-Price analysis: 8-10 trading days for major move completion
⭐ Wyckoff Method: Spring Pattern (successful test of support) = Bullish signal | Schiff accumulation phase ending | Expected markup phase: 1.1650-1.1750 (next 7-10 days)
━━━━━━━━━━━━━━━━━━━━━━━━━━━━━━━━━
✨ TRADING PLAN SUMMARY ✨
🎯 LONG BIAS (PRIMARY SCENARIO):
Entry: 1.1645-1.1650 breakout | Stop: 1.1605 | Target 1: 1.1680 | Target 2: 1.1720 | Target 3: 1.1750
Risk/Reward: 1:3+ | Conviction: 75% | Timeframe: Swing (Hold 3-5 days) + Intraday scalp (1-4 hours)
⚠️ SHORT SCENARIO (CONTINGENCY):
Trigger: Rejection at 1.1650 + Volume decline | Entry: 1.1635 | Stop: 1.1655 | Target: 1.1600
Probability: 25% | Setup: Rising Wedge breakdown
⏱️ TIMEFRAME PRIORITY: 4H (swing base) + 1H (entry confirmation) + 5M (execution)
💰 POSITION SIZING: Risk max 1-2% per trade | Scaling in on pullbacks
🔔 ALERTS: Set at 1.1650 (buy signal) | 1.1605 (stop loss) | 1.1680 (partial profit)
━━━━━━━━━━━━━━━━━━━━━━━━━━━━━━━━━
Disclaimer: Educational analysis only. Not financial advice. Trade at your own risk. Always use proper risk management. Past performance ≠ future results.
J-DXY

EURUSD (Oct 25, ) — Structural Completion Before the Next moveEURUSD on the 4H timeframe is forming a rising channel structure (A–B–C–D–E).
Currently, price is testing the D–zone, which will decide the next direction.
Two possible cases:
1️⃣ Direct Bullish Continuation — if D holds, expecting breakout toward 1.2000–1.2100.
2️⃣ Short-term Sell then Strong Bull Rally — liquidity grab below D before the next impulsive wave.
Both align with the higher-timeframe bullish bias.
Patience around 1.1600–1.1650 could reward the disciplined trader.
Bias: Medium-Term Bullish
Timeframe: 4H
Pair: EUR/USD
#EURUSD #Forex #ForexTrading #ElliottWave #SmartMoneyConcept #PriceAction #TraderMindset #ForexCommunity #WaveAnalysis #MarketStructure #DisciplineOverEmotion

GBPUSD (Oct 25, 2025) — Two Possible Scenarios AheadGBPUSD is completing a contracting structure on the 4H chart.
Price is approaching point D, where two outcomes are possible:
1️⃣ Direct Bullish Breakout — price holds above 1.33 and targets 1.3650–1.38 zone.
2️⃣ Short-term Sell then Bullish Rally — a fakeout below D before wave E reversal.
Both cases point toward a medium-term bullish structure developing.
Market confirmation will decide the next leg — stay patient and disciplined.
Bias: Bullish after D
Timeframe: 4H
Pair: GBP/USD
#GBPUSD #WaveAnalysis #PriceAction #ElliottWave #ForexTrading #SmartMoneyConcept #TechnicalAnalysis #TraderMindset #ForexCommunity

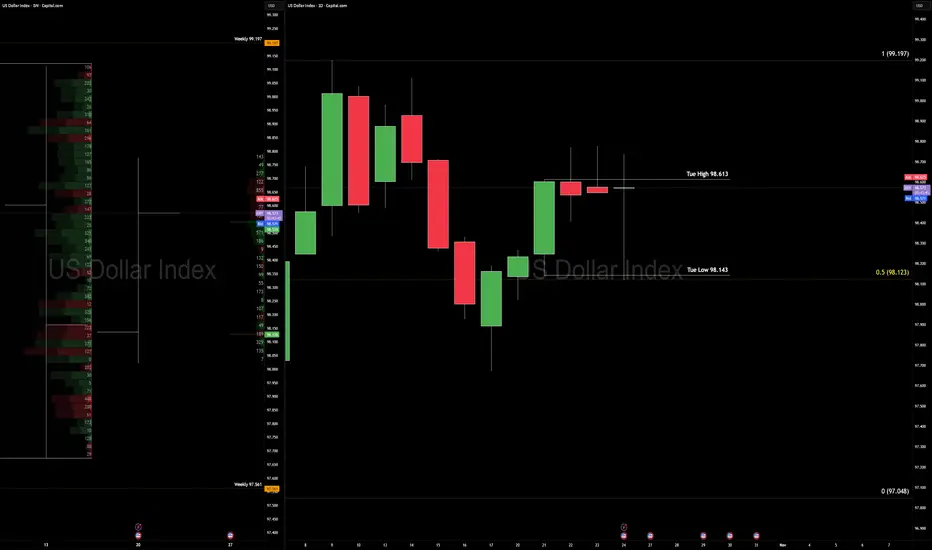
DXY — Triple Compression: CPI Meets a 3rd Weekly & 4th Daily Ins
The U.S. Dollar Index is locking in tight — 3rd consecutive weekly inside bar, and a 4th possible daily inside bar — as U.S. inflation holds firm and Japan’s core inflation uptick adds fuel.
Context
We’re locked in structural compression: three weeks of internal price action, and today presents a 4th daily inside bar formation.
Weekly key range: low 97.561 and high 99.197. Price is stuck in the mid-zone, patiently waiting.
For bias confirmation: Break of Tuesday’s 21 Oct daily candle low at 98.143 or high at 98.613 will signal directional bias.
Macro queue: Big data hits next week (inflation prints, central-bank focus). Volatility is coiled.
Technical
Weekly frame: Still inside the bearish range (97.561 – 99.197).
Daily frame: Bias leans bullish until the range breaks — think “bullish inside bar pending expansion”.
In symmetrical measures: Risk of overbought cognition; if today’s low holds and Monday fails to trade through it, we may see a higher low setup. Execution: Wait for clean breakout of the inside bar structure; use volume confirmation; avoid getting sucked into a false squeeze.
Fundamentals
U.S. inflation: The Consumer Price Index for September is published today (24 Oct) after delay due to shutdown.
Bureau of Labor Statistics +2
The Financial Express +2
Japan inflation: September core inflation rose to 2.9% YoY, moving above the Bank of Japan target and adding pressure to the JPY‐rate story.
Trading Economics
+2
Bloomberg
+2
Impact mechanism: Sticky inflation → reduces odds of immediate rate cuts → supports USD strength; yet structural squeeze in DXY means the market is holding its breath for breakout.
Plan & Mindset
Plan: Hold off trading until Monday’s price action gives clarity through breakout of the inside-bar structure. Then map cross-assets (EURUSD, GBPUSD) accordingly.
Mindset
Structure rules story. Don’t fight a tight coil. Today you “wait with purpose.” If price breaks, act decisively; if it breaks wrong, adapt quickly.
- Like waiting for the popcorn — you don’t eat the kernels while still heating.
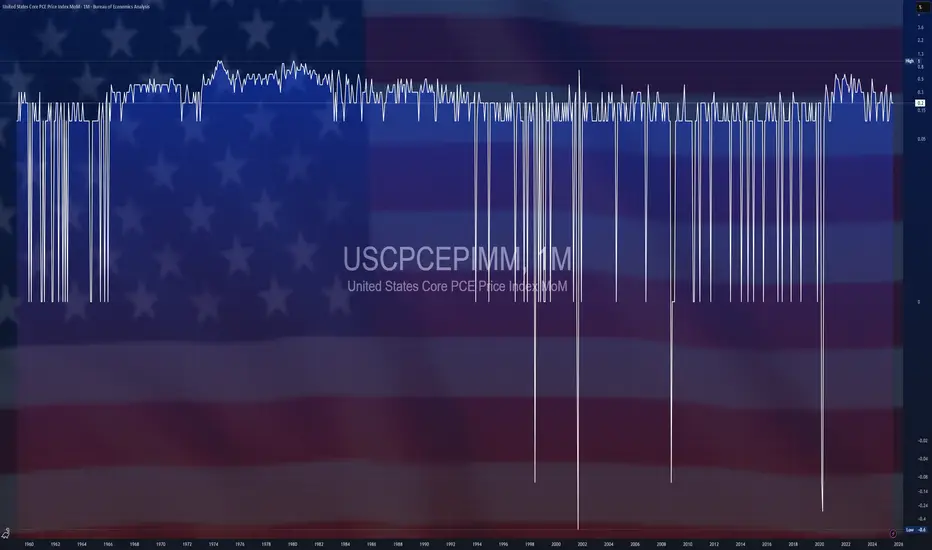
$USCPCEPIMM -U.S Core Inflation (September/2025)ECONOMICS:USCPCEPIMM +0.2%
September/2025
source: U.S. Bureau of Labor Statistics
- Core consumer prices in the US, which exclude food and energy, rose by 0.2% from the previous month in September of 2025, slowing from the 0.3% in the August and July, and slightly under market expectations of a 0.3% increase.
The data was released with weeks of delay as the ongoing US government shutdown suspended activity in the Bureau of Labor Statistics.
Prices rose slower for shelter (0.2% vs 0.4% in August), transportation services (0.3% vs 1%), and new vehicles (0.2% vs 0.3%).
In turn, the CPI rebounded for medical care services (0.3% vs -0.1%) and accelerate for apparel (0.7% vs 0.5%).
From the pervious year, core consumer prices rose by 3% in September.
EURUSD 2H | SMC + Elliott WaveKeeping it simple 💚
This chart blends Smart Money Concept with Elliott Wave structure to show how institutional zones align with wave corrections.
Currently expecting price to tap the 1.164–1.171 zone (seller’s area) before a possible wave 5 decline toward 1.150.
No signals — pure analysis to educate and share thought process 📚
Stay patient, follow structure, not emotions ⚡
#Forex #EURUSD #ElliottWave #SmartMoneyConcept #ForexEducation #PriceAction

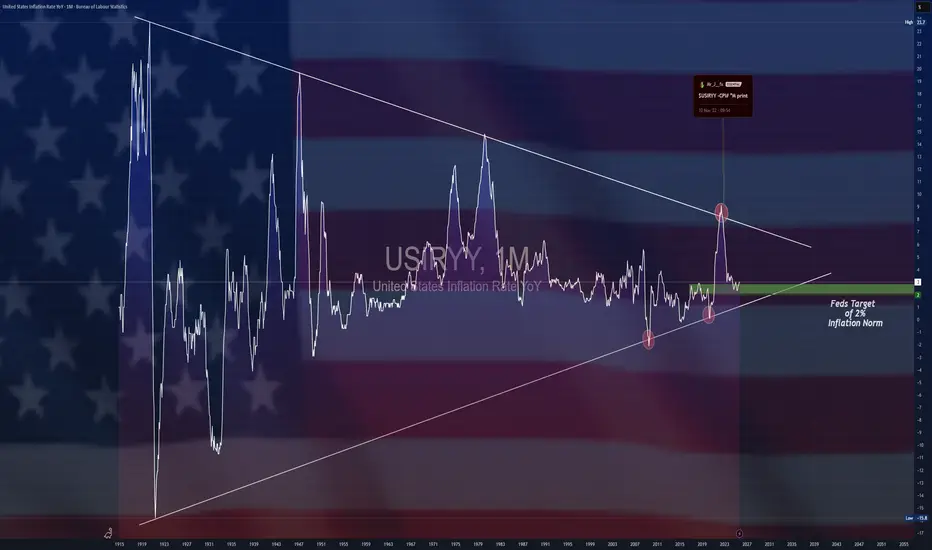
$USIRYY -U.S Inflation Rate (September/2025)ECONOMICS:USIRYY 3%
September/2025
source: U.S. Bureau of Labor Statistics
- The US annual inflation rate rose to 3.0% in September from 2.9% in August, slightly below market expectations of 3.1%.
It was the highest rate since January, mainly due to a jump in energy prices. Meanwhile, core inflation eased to 3.0% from 3.1%, while monthly headline and core CPI increased 0.3% and 0.2%, respectively.
DXY and EURUSD Consolidate Near Key Breakout LevelsOn the 4-hour chart, both DXY and EURUSD are consolidating near key levels, with DXY leaning bullish and EURUSD leaning bearish.
DXY Outlook
A breakout above 99.15 could redirect gains toward 99.50, setting up another test before confirming a move higher toward 100.20 (July 2023-September 2024 resistance), then 101 and 103.
On the downside, a hold below 98.80 could extend the consolidation between 98.60 and 98.40.
EURUSD Outlook
A breakout below 1.1600–1.1560 could extend the decline toward 1.1520, with deeper losses possible toward 1.1480 and 1.1380.
From the upside, holding above 1.1620 may allow a rebound toward 1.1680 and 1.1730, before targeting yearly highs if momentum builds further.
Razan Hilal, CMT

USD/CHF - Channel Breakout (24.10.2025) Setup Overview:
USD/CHF has completed a rising channel formation and is now showing signs of a bearish breakout below the lower trendline. The pair rejected the resistance zone near 0.7985 – 0.7970, confirming exhaustion in bullish momentum.
💡 Technical Setup:
Pattern: Rising Channel Breakout
Cloud Cross: Adds bearish confluence
Resistance Zone: 0.7985 – 0.7970
Trendline: Clear breakdown structure visible on 30-min timeframe
📉 Trading Plan:
Bias: Bearish below 0.7960
🟥 1st Support: 0.7925
🟥 2nd Support: 0.7906
Invalidation: A daily close above 0.7985 may negate this setup
📰 Market Context:
1.The U.S. dollar faces minor pullbacks as traders await upcoming inflation data and FOMC signals.
2.Swiss franc gains slight safe-haven demand amid geopolitical and risk market concerns.
3. Technically and fundamentally, short-term sentiment favors a downside correction on USD/CHF.
#USDCHF #Forex #TechnicalAnalysis #PriceAction #ChannelBreakout #BearishSetup #Ichimoku #TradingView #KABHI_TA_TRADING #ChartsDontLieTradersDontQuit #FXMarket #USD #CHF #TrendlineBreak #CloudCross
⚠️ Disclaimer:
This analysis is for educational purposes only — not financial advice. Please do your own research and use strict risk management when trading live markets.
📣 Support My Work
If you like my analysis — LIKE 👍, COMMENT 💬, and FOLLOW 🔔 for more daily Forex setups and updates!

Stop!Loss|Market View: GOLD🙌 Stop!Loss team welcomes you❗️
In this post, we're going to talk about the near-term outlook for GOLD ☝️
Potential trade setup:
🔔Entry level: 3995.914
💰TP: 3646.967
⛔️SL: 4195.976
"Market View" - a brief analysis of trading instruments, covering the most important aspects of the FOREX market.
👇 In the comments 👇 you can type the trading instrument you'd like to analyze, and we'll talk about it in our next posts.
💬 Description: The current accumulation of 4005 - 4143 has formed the basis for a further decline toward 3600 - 3700. Two sell scenarios are being looked for, the more likely of which involves a potential trade on a breakout of the lower border. An alternative scenario involves the formation of a false breakout at the upper border of this accumulation.
Thanks for your support 🚀
Profits for all ✅
❗️ Updates on this idea can be found below 👇

DXY FRGNT Daily Forecast -Q4 | W43 | D2| Y25 |
📅 Q4 | W43 | D2| Y25 |
📊 DXY FRGNT Daily Forecast
🔍 Analysis Approach:
I’m applying Smart Money Concepts, focusing on:
Identifying Points of Interest on the Higher Time Frames (HTFs) 🕰️
Using those POIs to define a clear trading range 📐
Refining those zones on Lower Time Frames (LTFs) 🔎
Waiting for a Break of Structure (BoS) for confirmation ✅
This method allows me to stay precise, disciplined, and aligned with the market narrative, rather than chasing price.
💡 My Motto:
"Capital management, discipline, and consistency in your trading edge."
A positive risk-to-reward ratio, paired with a high win rate, is the backbone of any solid trading plan 📈🔐
⚠️ Losses?
They’re part of the mathematical game of trading 🎲
They don’t define you — they’re necessary, they happen, and we move forward 📊➡️
🙏 I appreciate you taking the time to review my Daily Forecast.
Stay sharp, stay consistent, and protect your capital
— FRNGT 🚀
TVC:DXY

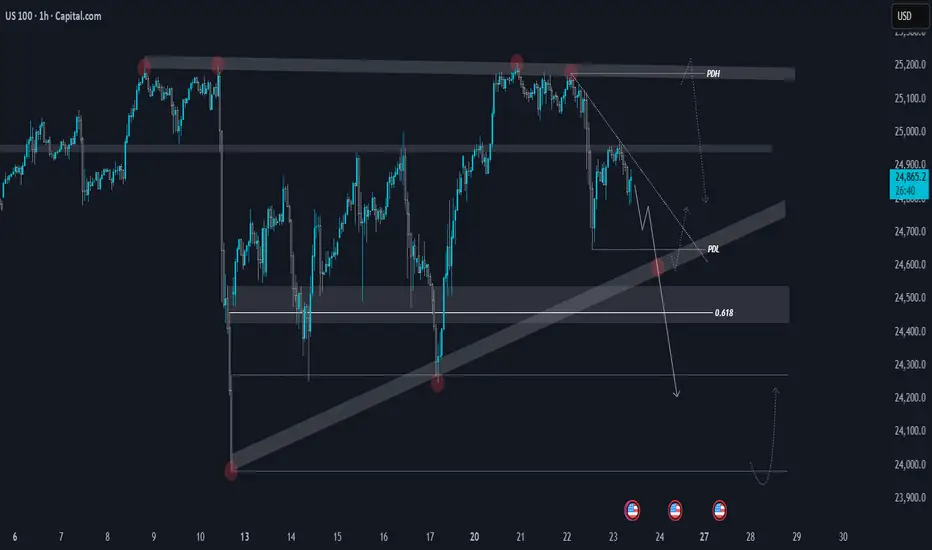
NASDAQ | Daily TF - Bearish Divergence with Double TopCAPITALCOM:US100 NASDAQ continues to hold a bearish tone on the 1-hour chart, with a clear bearish divergence confirming weakness in momentum. Price is respecting lower highs and lower lows, keeping the short-term structure bearish.
On the 4H timeframe, the index is approaching the trendline support around 24,600, which marks the third touch of this level. If this zone fails to hold, we could see an extended move toward the 24,000 area.
From a broader view, the daily chart shows a double top pattern along with a strong bearish divergence — both supporting a deeper pullback. However, a daily close above 25,220 would invalidate this view and could shift momentum back to the upside.
📰 With the ongoing U.S. government shutdown and heightened market uncertainty, sentiment remains mixed. Volatility is expected to stay elevated, so it’s best to wait for clear confirmation around key levels before taking any positions.
NO TRADE ZONE FOR GOLD!!!I was Looking for price to proceed with being bullish but it decided to breakdown. I'm not ready to buy again just yet. Need to see a full sweep on levels first. I think im going to sit on hands for the rest of the week.

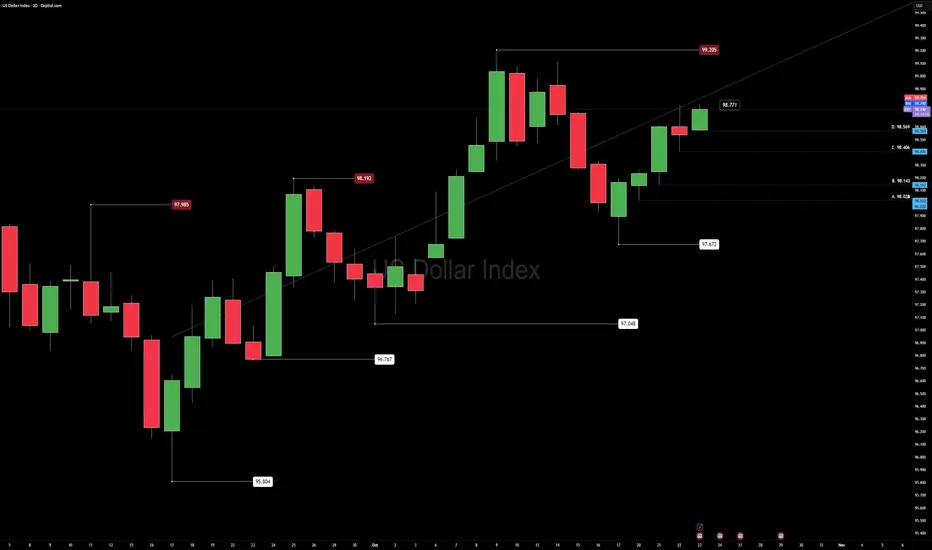
US DOLLAR AnalysisRespect the Higher Low: The Quiet Power of an Uptrend
U.S. Dollar Index (DXY) | 23 Oct 2025 | Pre–New York Session Outlook
By Daniel Fadeley
The U.S. Dollar continues to show a bullish bias, with higher lows forming consistently across both the weekly and daily structure. This ongoing strength keeps the broader tone positive for USD, while EURUSD and GBPUSD remain under cross-asset pressure.
We’re currently operating inside a bullish range with 97.672 as the range low and 99.205 as the range high.
Context
Momentum favors the dollar as buyers continue defending each pullback. If this month’s bullish structure holds, the market could confirm a longer-term upward phase.
However, conditions are slightly extended on Fibonacci sequence levels, suggesting reduced reward-to-risk for new swing positions until a clean retest offers better value.
Technical Map
Price took out yesterday’s high (98.771) and approaches the range ceiling at 99.205.
Volatility remains elevated through the week, and intraday momentum supports buy-the-dip behavior while daily lows continue to hold.
For cross-assets, this structure implies ongoing pressure on major USD pairs while the dollar holds above recent higher lows.
Fundamental Outlook
The week ahead features several key macro events:
U.S. GDP advance data
Core PCE inflation release
Multiple Federal Reserve speakers
Ongoing U.S. government funding discussions
Impact lens:
Yields rising → typically strengthens USD and tightens global liquidity.
Yields easing → can relieve pressure on risk assets such as equities and crypto.
Liquidity trends show ETF inflows slowing and capital rotating defensively, consistent with cautious macro positioning.
Plan
Current outlook remains bullish within range, focusing on position trades from defended lows and short-term rotational setups during volatility spikes.
Patience near 99.205 is key — a clean breakout with retest would confirm continuation; failure there could mean another controlled rotation inside the range.
Mindset
“Structure builds confidence. Clarity builds control.”
In fast markets, the goal is not prediction but preparation — follow structure, protect capital, and let confirmation lead conviction.
Educational use only — not financial advice.
Follow @CORE5DAN for calm, data-driven analysis and weekly structure lessons.
— CORE5DAN
Institutional Logic. Modern Technology. Real Freedom.
DXY Forming a Strong Base – Reversal Ahead?U.S. Dollar Index TVC:DXY – Daily Analysis
After a long downtrend, the Dollar Index seems to be forming a strong base at the bottom, as highlighted by multiple bounces from the same support zone. This area has been acting as a reliable floor, preventing further downside.
Currently, the price has also broken above the descending trendline, showing early signs of strength. If the price holds above this breakout, we could see a move toward the 100–101 zone, which is the next key resistance area.
However, if the price dips back below the trendline, a retest of the base zone near 97.00 could take place before any potential continuation higher.
Summary: DXY is showing a potential reversal structure. A sustained move above the trendline could confirm the start of a stronger bullish phase.
DYOR, NFA
Thanks for reading! Appreciate your support and engagement 🙏

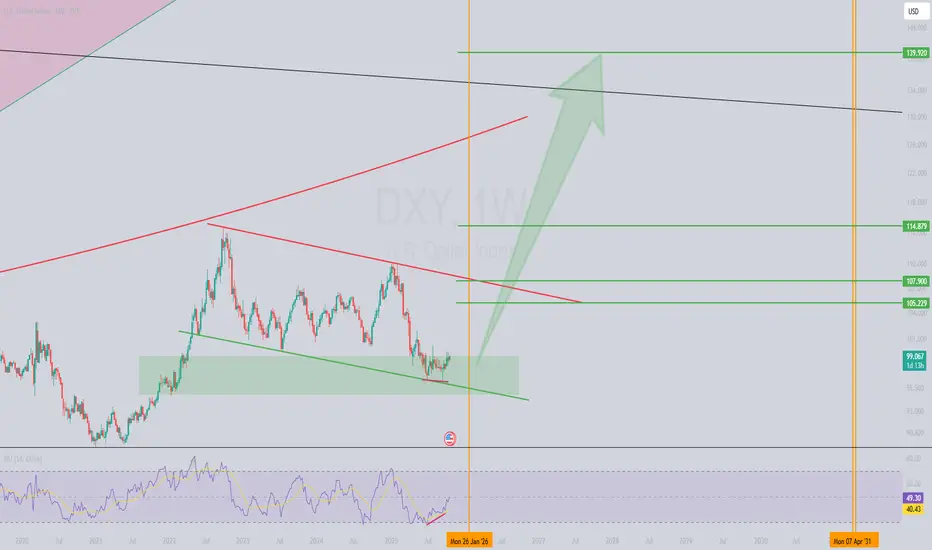
DXY: Bullish Setup Brewing at Key Weekly Support!The US Dollar Index (DXY) is showing a compelling setup on the weekly timeframe! 📈 The price has reached a critical support zone between 99.120 and 94.802. This level also aligns with the lower boundary of a descending channel, adding confluence to this high-probability zone.
🔍 Key Technical Observations:
Bullish Divergence: A clear bullish divergence has formed between the price and the RSI indicator, signaling potential exhaustion of sellers and a possible trend reversal.
Channel Support: The price is testing the lower trendline of the descending channel, a spot where buyers have stepped in before.
Support Zone: The 99.120–94.802 range is a high-value area for accumulation, making it a prime spot for a bounce.
📡 What’s Next?Technically, the DXY looks poised for a bullish reversal. However, global macroeconomic events and fundamental news (like Fed decisions or geopolitical developments) will play a crucial role in confirming this move. Keep an eye on upcoming economic data releases! 📅
What do you think of this setup? Are you bullish on DXY, or waiting for more confirmation? Drop your thoughts below! 👇
EUR/USD – Outlook (2H Chart)Scenario 1 – Bullish Correction (Preferred):
Market completed a 5-wave impulsive drop.
Price is now testing the 1.1580–1.1595 demand zone (Wave-B area).
If this zone holds, we expect a corrective wave-C rally toward 1.1638 – 1.1680.
Structure: (1-2-3-4-5) down → (A-B-C) up.
📈 Expectation: Short-term bullish retracement before next major move.
🟢 Confirmation: 1-hour candle close above 1.1600.
---
Scenario 2 – Bearish Continuation:
If price breaks below 1.1575, buyers lose control.
Market can extend deeper toward the 1.1545 – 1.1550 zone.
That would complete a larger Wave-5 extension before new correction begins.
📉 Expectation: Short-term selling continuation before trend reversal.
🔴 Invalidation for bulls: 1.1570 break and retest.
---
Summary:
The pair stands at a critical decision zone.
Hold = wave-C bounce 📈
Break = deeper drop to support 📉
---

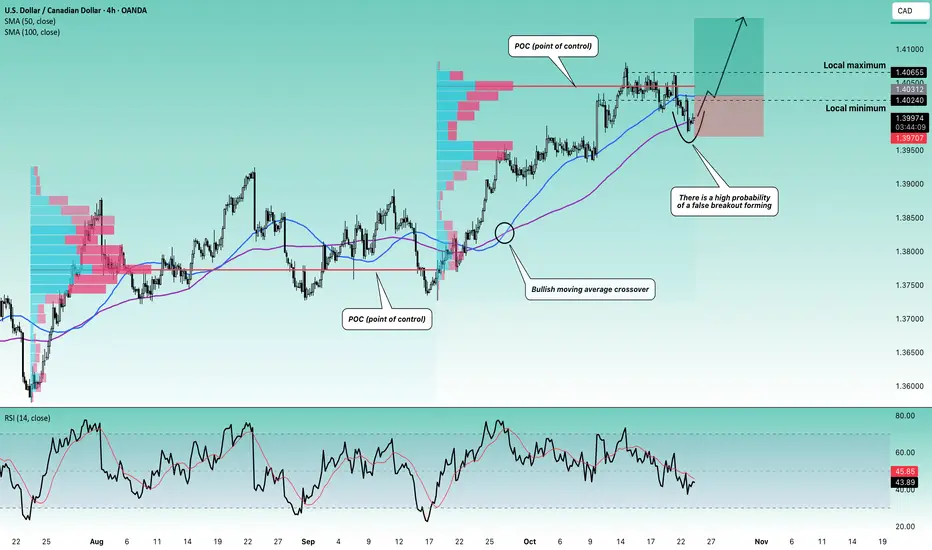
Stop!Loss|Market View: USDCAD🙌 Stop!Loss team welcomes you❗️
In this post, we're going to talk about the near-term outlook for the USDCAD currency pair☝️
Potential trade setup:
🔔Entry level: 1.40312
💰TP: 1.41455
⛔️SL: 1.39707
"Market View" - a brief analysis of trading instruments, covering the most important aspects of the FOREX market.
👇 In the comments 👇 you can type the trading instrument you'd like to analyze, and we'll talk about it in our next posts.
💬 Description: The focus on the accumulation area of 1.40240 - 1.40655 remains despite the breakout of its lower border. We are currently most likely observing the formation of a false breakout. The main scenario is the price closing above 1.40240 again, thereby forming a false breakout. Buy trades towards 1.41000 and 1.42000 can be actively looked for in this case. A more conservative option is to look for a buy trade via a breakout of the upper border of 1.40655.
Thanks for your support 🚀
Profits for all ✅
❗️ Updates on this idea can be found below 👇
Stop!Loss|Market View: GBPUSD🙌 Stop!Loss team welcomes you❗️
In this post, we're going to talk about the near-term outlook for the GBPUSD currency pair☝️
Potential trade setup:
🔔Entry level: 1.33425
💰TP: 1.32176
⛔️SL: 1.34167
"Market View" - a brief analysis of trading instruments, covering the most important aspects of the FOREX market.
👇 In the comments 👇 you can type the trading instrument you'd like to analyze, and we'll talk about it in our next posts.
💬 Description: For the pound, sell priorities are still in place. A retest of the 1.32870 support area is expected here in the near future. Sell trade is looked for from current prices (as the primary scenario), but manipulation (a false breakout) should be expected in the event of a further retest of the 1.34500 resistance area, after which a sell should be looked for again at more favorable prices. The 1.30000 level is considered a medium-term target.
Thanks for your support 🚀
Profits for all ✅
❗️ Updates on this idea can be found below 👇

USD/JPY – Buy Entry (H1- Channel Breakout Pattern)
The USD/JPY Pair, Price has been trading within a Channel Breakout Pattern on the H1 chart, forming consistent higher highs and higher lows. Price action is now testing the upper boundary of the Pattern, signalling a possible breakout. FX:USDJPY
✅Market Context:
1️⃣Strong Upward Structure Inside the Pattern.
2️⃣Buyers are showing strength near Resistance.
3️⃣Breakout above the Trendline indicates Momentum continuation toward higher zones.
✅Trade Plan:
Entry: Buy after Confirmed Breakout above the Resistance (H1 candle close above trendline or retest of the breakout).
💰Take Profit (TP): At the Key Zone – a Major Resistance area identified ahead.
🛑Stop Loss (SL): Below the Pattern Structure.
✅Psychological Discipline :
1️⃣Stick to plan – No Revenge Trades.
2️⃣Accept losing trades as Part of the Strategy.
3️⃣Risk only 1–2% of your account balance per trade.
💬 Support the community: If you found this useful, drop a 👍 like and share your thoughts in the comments!
⚠️ Disclaimer: This analysis is for educational purposes only and does not constitute financial advice. Forex trading involves high risk. Trade only with capital you can afford to lose and always do your own research.

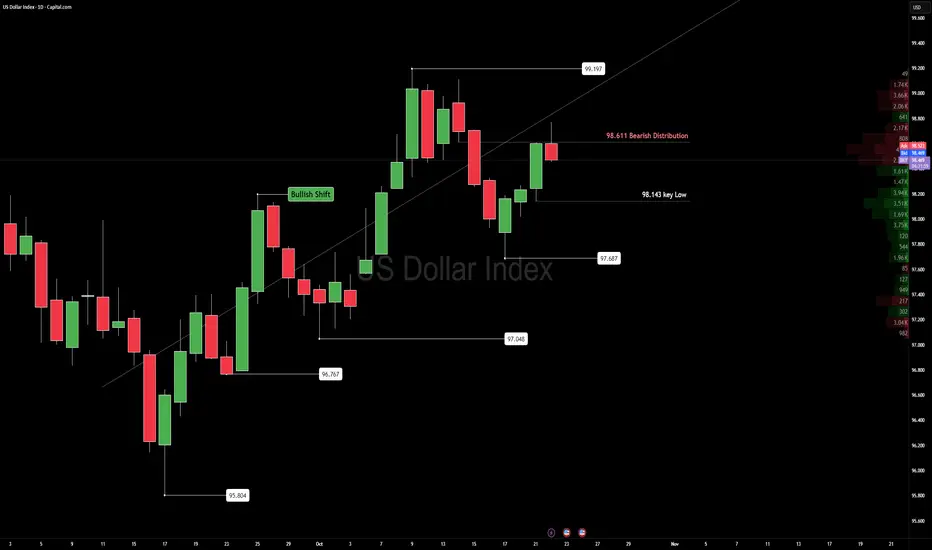
DXY UpdateDXY — Reaction at 98.611 Distribution Zone
The U.S. Dollar Index met firm resistance near 98.611, the same Bearish distribution area that capped momentum last week.
Price remains inside a wide daily range but shows the first sign of cooling after a strong stretch higher.
Below sits 98.143, the line that that changes chart bearish. Until then We are still good.
Acceptance under that level would confirm a structure shift and open space for continued rotation lower.
Upcoming jobless claims and Fed remarks may decide which side gains conviction.
For now, this is a market balancing inventory — not trending, just redistributing.
Trade confirmation, not anticipation.
Key levels:
98.611 — Distribution cap
98.143 — Structural pivot
— Institutional Logic. Modern Technology. Real Freedom.
EURUSDHello Traders! 👋
What are your thoughts on EURUSD?
EUR/USD has broken its ascending trendline and completed a pullback to the broken level.
The pair is now trading below a key resistance zone, showing continued signs of bearish pressure.
After some short-term consolidation in this area, the price is expected to continue its decline toward the highlighted support level.
As long as the price remains below the resistance zone, the downside scenario remains valid.
A confirmed daily close above resistance would invalidate this bearish setup.
Don’t forget to like and share your thoughts in the comments! ❤️

Mid week forecast: GOLD,EURUSD,GBPUSDHello traders, this is a complete multiple timeframe analysis of this pair. We see could find significant trading opportunities as per analysis upon price action confirmation we may take this trade. Smash the like button if you find value in this analysis and drop a comment if you have any questions or let me know which pair to cover in my next analysis.
