DXY: The Dollar’s Long Cycle — Heading Back to 9/11 Levels?The U.S. Dollar Index ( INDEX:DXY ) has navigated through decades of pivotal global shifts — from the end of the Gold Standard and the 1979 Oil Crisis to the Plaza Accord, the Global Financial Crisis, and now the post-pandemic monetary reset.
Each of these events marked critical macro turning points — and each time the dollar found new structural strength after major dislocations.
Now, DXY has consolidated above long-term resistance and appears to be building energy for another leg higher.
If history rhymes, we may see the dollar rally toward the levels reached during the aftermath of the September 11 attacks — a zone that historically represented both global uncertainty and U.S. capital inflows.
Bias: Bullish
Target Zone: 120–122
Timeframe: Multi-year (monthly chart perspective)
J-DXY

GBP/USD - Breakout Pattern (14.10.2025)The GBP/USD pair on the M30 timeframe presents a Potential Buying Opportunity due to a recent Formation of a Breakout Pattern.
This suggests a shift in momentum towards the upside and a higher likelihood of further advances in the coming hours.
Possible Long Trade:
Entry: Consider Entering A Long Position around Trendline Of The Pattern.
Target Levels:
1st Resistance – 1.3434
2nd Resistance – 1.3484
🎁 Please hit the like button and
🎁 Leave a comment to support for My Post !
Your likes and comments are incredibly motivating and will encourage me to share more analysis with you.
#GBPUSD #Forex #Trading #TechnicalAnalysis #PriceAction #ForexSignals #BreakoutTrading #Ichimoku #FXTrading #BullishSetup #TradingView
⚠️ Disclaimer:
This analysis is for educational purposes only and not financial advice. Always use proper risk management and conduct your own research before trading.
Best Regards, KABHI_TA_TRADING
Thank you.

DXY index Near Resistance – Will Powell Trigger the Next Move?To kick off this week, let's take a quick look at the upcoming key indexes in the economic calendar before diving into the DXY analysis ( TVC:DXY ).
On Tuesday, we have Fed Chair Powell speaking, which could stir some excitement in the DXY index and ripple through correlated financial markets . Then, on Thursday , we have a bunch of key indexes like Core PPI, Core Retail Sales, PPI, and Unemployment Claims coming out. These releases could spark some volatility as well.
So, before we jump into the DXY analysis , I wanted to give you a heads-up on this week’s events
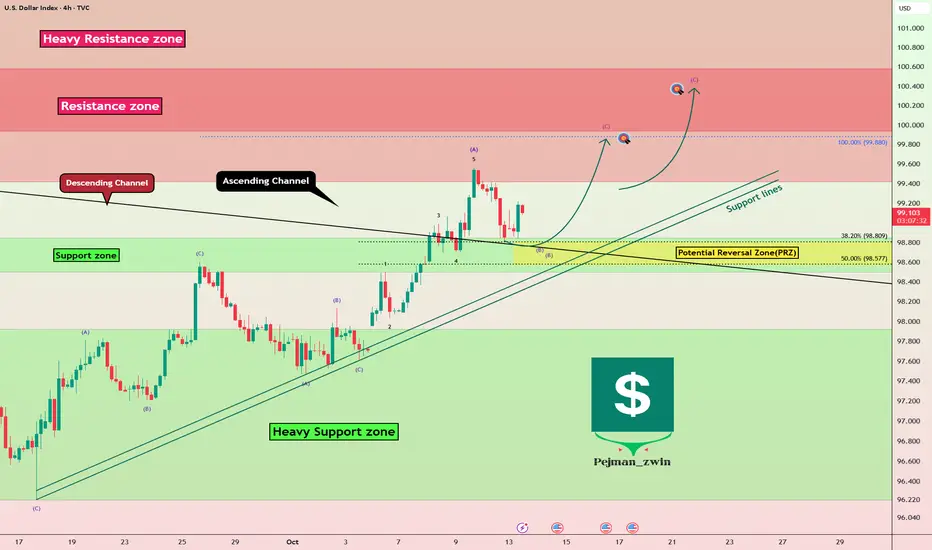
From a technical analysis standpoint , the DXY index is currently moving near a Heavy Resistance zone($101.30-$99.42) . At the same time, it has managed to break above the upper line of its descending channel and is now in a pullback phase to retest that broken line.
In terms of Elliott Wave theory , it seems that the DXY is completing wave B of a zigzag corrective(ABC/5-3-5) .
I expect that wave B will finish around the Potential Reversal Zone(PRZ) , and we might see the DXY index approach that Resistance zone($100.58-$99.93) before Powell’s speech tomorrow .
First Target: $99.770
Second Target: $100.06
Stop Loss(SL): $98.28
Please respect each other's ideas and express them politely if you agree or disagree.
U.S. Dollar Index Analysis (DXYUSD), 4-Hour Time Frame.
Be sure to follow the updated ideas.
Do not forget to put a Stop loss for your positions (For every position you want to open).
Please follow your strategy and updates; this is just my Idea, and I will gladly see your ideas in this post.
Please do not forget the ✅' like '✅ button 🙏😊 & Share it with your friends; thanks, and Trade safe.
Anticipating a Stronger DollarThe U.S. dollar ( TVC:DXY ) has been strengthening since the 2008 crisis, and I expect this trend to continue. I anticipate the Dollar Index (DXY) could reach a target of 120 by the next election or even sooner.

us100 looking weak us100 looking weak, expecting bearish rally towards descending trend line, and if it could not hold trend line, then we may see deeper correction in us100

Stop!Loss|Market View: GOLD🙌 Stop!Loss team welcomes you❗️
In this post, we're going to talk about the near-term outlook for GOLD ☝️
Potential trade setup:
🔔Entry level: -
💰TP: -
⛔️SL: -
"Market View" - a brief analysis of trading instruments, covering the most important aspects of the FOREX market.
👇 In the comments 👇 you can type the trading instrument you'd like to analyze, and we'll talk about it in our next posts.
💬 Description: Metals continue to demonstrate impressive results. As a result, we are seeing new all-time highs. It's difficult to find any potential buy or sell levels for gold, but we can highlight an area around 4200-4250, where sell trades, especially mid-term, are highly likely to be liquidated. This assumption is based on a 25% price move from the start of the current rally since August, as well as the point of control (POC) of the same rally around 3650. We should likely expect the end of the US shutdown, after which we could see a correction in metals.
Thanks for your support 🚀
Profits for all ✅
❗️ Updates on this idea can be found below 👇

Stop!Loss|Market View: EURUSD🙌 Stop!Loss team welcomes you❗️
In this post, we're going to talk about the near-term outlook for the EURUSD currency pair☝️
Potential trade setup:
🔔Entry level: 1.15326
💰TP: 1.14123
⛔️SL: 1.16348
"Market View" - a brief analysis of trading instruments, covering the most important aspects of the FOREX market.
👇 In the comments 👇 you can type the trading instrument you'd like to analyze, and we'll talk about it in our next posts.
💬 Description: The price continues to accumulate near short-term support 1.16600, indicating a likely breakout toward 1.15500. The most conservative entry points for selling are, surely, located directly at 1.16600, more aggressive - would be to look for selling from approximately current prices.
Thanks for your support 🚀
Profits for all ✅
❗️ [ b]Updates on this idea can be found below 👇

Gold Off to the Races | No Pullbacks, Just PressureNew week and Gold came out the gate running. Momentum’s been relentless — no pullbacks, no hesitation.
Price is still riding strong from last week’s 8HR FVG base, and now pressing into new highs around 4,150+.
With global tension fueling safe-haven demand, this could be a continuation week — but it’s getting stretched.
Watching 4,070–4,081 for possible re-entry if we get a midweek dip.
A close below 4,100 could signal exhaustion, while staying above keeps bulls firmly in control.
⚖️ Staying patient, no chasing — letting the market show if this leg still has fuel.
— Woodz | #NOFOMO #GoldFutures #MarketStructure

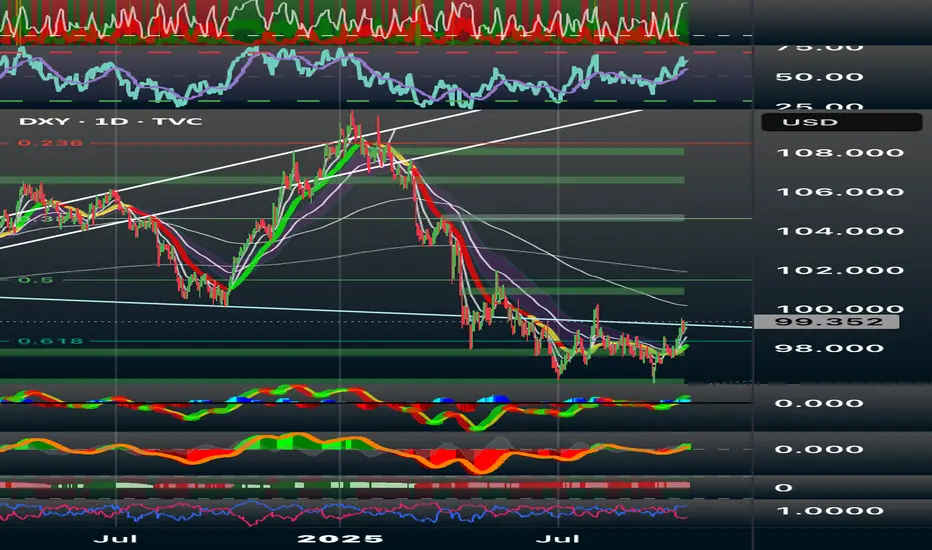
DXY: Key Reversal or Dead Cat Bounce?The U.S. Dollar Index has found footing around the 0.618 Fibonacci retracement near 97.8, breaking a long downtrend. Its push toward the 99.35–100 range suggests a possible retest of a broken structure and alignment with the 50-day EMA. I noticed this move also aligns with short-term recovery signals.
Technical View (1D)
RSI climbing above 50 hints at renewed momentum.
MACD turning green shows early signs of follow-through.
Price is testing 100–101, a former support turned resistance.
If momentum holds, 102, 104, and 106 are the next resistance zones.
Support remains steady at 98, 97, and 95.8, which are shown as strong confluence points with Fibonacci structure.
Scenarios:
If DXY closes above 100.3, I’d expect continuation toward 102.4 or 104.2.
Failure to clear 100 followed by a drop under 98.5 could send it back toward 97.2 or even 95.8.
For now, my bias stays neutral to slightly bullish in the short term. A clean breakout above 100 would confirm a structural shift upward. None the less, I’m watching U.S. yields and upcoming CPI data closely and considering the factor that stronger inflation or a hawkish Fed tone could fuel the next DXY leg higher.
Thank you for your time and support, and as always please remember that this is always NFA and DYOFR, respectfully.
Bullish bounce off?US Dollar Index (DXY) has bounced off the pivot which is an overlap support that lines up with the 38.2% Fibonacci retracement and could rise to the 1st resistance.
Pivot: 98.77
1st Support: 98.41
1st Resistance: 100.14
Disclaimer:
The above opinions given constitute general market commentary, and do not constitute the opinion or advice of IC Markets or any form of personal or investment advice.
Any opinions, news, research, analyses, prices, other information, or links to third-party sites contained on this website are provided on an "as-is" basis, are intended only to be informative, is not an advice nor a recommendation, nor research, or a record of our trading prices, or an offer of, or solicitation for a transaction in any financial instrument and thus should not be treated as such. The information provided does not involve any specific investment objectives, financial situation and needs of any specific person who may receive it. Please be aware, that past performance is not a reliable indicator of future performance and/or results. Past Performance or Forward-looking scenarios based upon the reasonable beliefs of the third-party provider are not a guarantee of future performance. Actual results may differ materially from those anticipated in forward-looking or past performance statements. IC Markets makes no representation or warranty and assumes no liability as to the accuracy or completeness of the information provided, nor any loss arising from any investment based on a recommendation, forecast or any information supplied by any third-party.

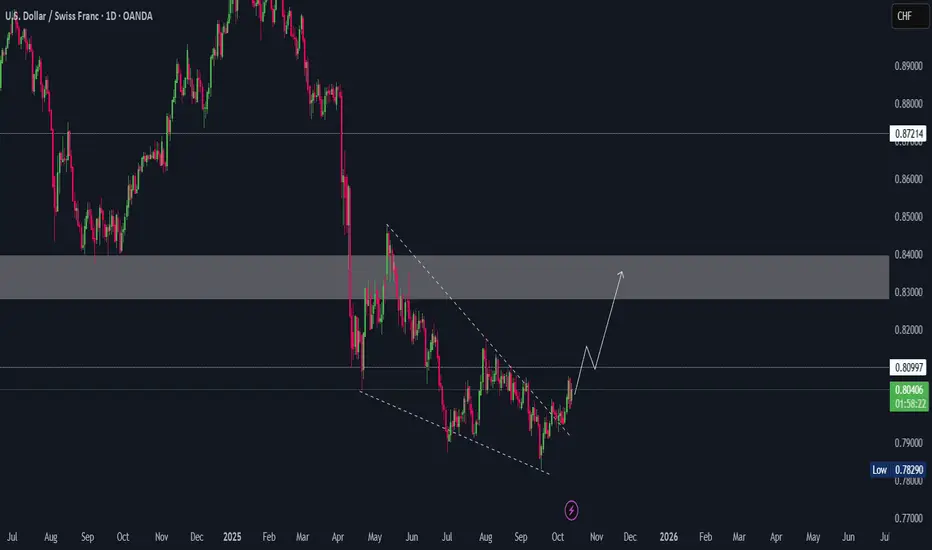
USD/CHF Technical Outlook – Building Bullish StructureThe U.S. Dollar vs Swiss Franc (USD/CHF) pair is showing early signs of a structural shift, trading near 0.8040 after forming a solid base around 0.7829, its recent multi-month low. Price action has transitioned from a prolonged bearish phase into a potential reversal pattern, suggesting a medium-term bullish continuation.
The key level to watch is 0.8100 — a breakout above this zone could confirm bullish intent, opening the way toward the 0.8300–0.8400 supply range, which previously acted as a major distribution area. If momentum sustains, an extended move toward 0.8720 remains on the table.
A healthy pullback into 0.8000–0.7950 may serve as a retest opportunity for traders looking to join the trend, while a drop back below 0.7820 would invalidate the bullish scenario.
📌 Summary:
Bias: Bullish above 0.8000
Targets: 0.8300 → 0.8400 → 0.8720
Risk: Rejection below 0.7820
This setup reflects a potential institutional accumulation phase, as USD strength re-emerges across safe-haven pairs. Keep an eye on DXY correlation and SNB policy tone for confluence before major breakouts.
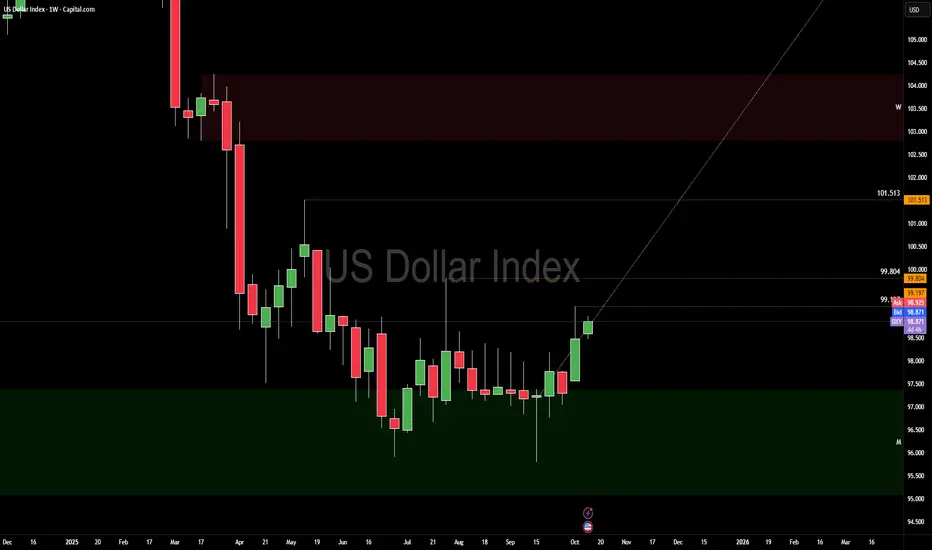
DOLLAR INDEX (DXY) — TECHNICALS FIRST, FUNDAMENTALS SECOND
Technically, the key level this week is 99.197. If DXY manages a bullish close above it, we should see a weekly structure shift higher. That opens the door for 99.8 → 101.5 as internal algorithmic targets. This isn’t wishful thinking — this is how systems behave when liquidity regimes flip.
Under that lens, any rejections beneath 99.197 or weak closes around it remain valid short setups — but only after structure gives the nod. Don’t force trades ahead of confirmation.
In the background, the dollar is reacting to trade-war rhetoric and political shifts. Trump’s 100 % tariffs on Chinese imports raised volatility, but he later softened his tone, suggesting more cooperation than conflict. Its complet currency war.
Meanwhile, some analysts argue a bullish case for the dollar remains due to relative U.S. productivity strength and higher real yields.
These narratives give motive, but do not override price structure.
So from CORE5’s frame: structure leads, news lags. Let clean price confirmation in the 99.197 zone tell you whether to lean into long bias or respect the risk of failure. Eyes locked.
Up onlyWe are at the light blue cross.
August 2020 after heavy deleverage, precious metals in ATH while Governments of the world are easing.
Dollar should fall a little more from here.
Tech and crypto will continue higher while commodities go up but underperform.
Cheers.

DXYU.S Dollar Index
- Bullish Channel as an corrective pattern in Short Time Frame
- Break of Structure
- Completed " 12345 " Impulsive Waves and " A " Corrective Waves
- RSI - Divergence
- Order Block

DXY Analysis – Bullish Structure Still IntactIn my latest DXY analysis, I mentioned that the 100.00 level remains the next key target for the U.S. Dollar Index.
After an initial push higher to 99.55, the index faced some selling pressure and is now trading slightly below 99.00.
However, the constructive bullish structure remains intact as long as price holds above the 99.60 support zone.
________________________________________
1. Technical Context
• The recent pullback looks more like a healthy correction rather than a trend reversal.
• The higher-lows pattern remains valid, keeping the bullish momentum alive.
• The 99.60 area now acts as a key pivot zone — holding above it favors a renewed push toward 100.00.
________________________________________
2. Trading Implications
Given this setup, selling rallies in EUR/USD and GBP/USD remains the preferred strategy, as both pairs are likely to face renewed dollar strength once DXY resumes its upward leg.
________________________________________
In short:
The Dollar Index remains bullish.
As long as 99.60 holds, the path of least resistance stays upward — and 100 remains on the radar. 🚀

Dxy index on high time frame
"Focusing on the DXY index on the high time frame, a downward trend is observed on the daily time frame. Utilizing the liquidity concept, the price has swept liquidity and appears poised for a decline. The first potential target could be around 97.5."
If you have more insights to share or need further assistance, feel free to let me know!

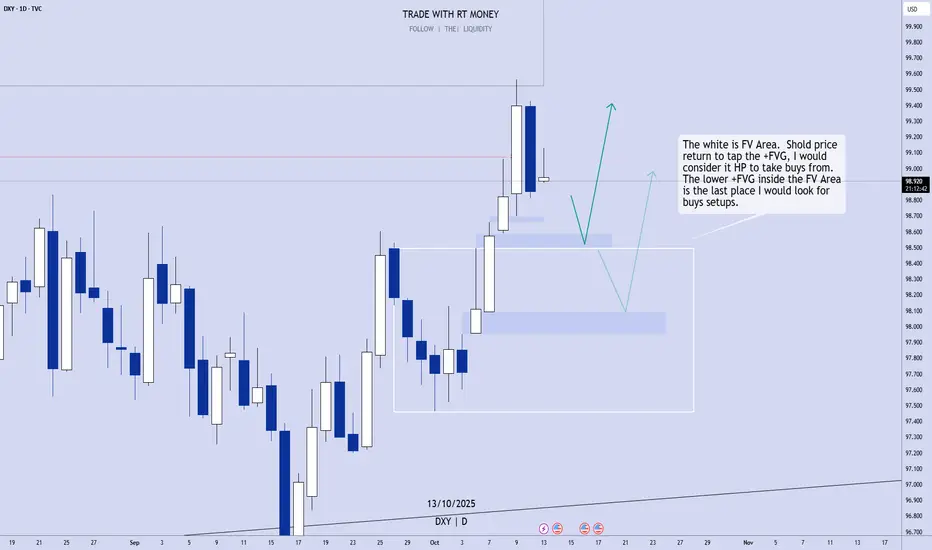
US Dollar: Still Bullish. Wait For Buy Setups!Friday's candle notwithstanding, the USD is strong, and still bullish. Taking sells into the bullish Fair Value Area is not a good option. Looking for buys at the _FVGs is!
Enjoy!
May profits be upon you.
Disclaimer:
I do not provide personal investment advice and I am not a qualified licensed investment advisor.
All information found here, including any ideas, opinions, views, predictions, forecasts, commentaries, suggestions, expressed or implied herein, are for informational, entertainment or educational purposes only and should not be construed as personal investment advice. While the information provided is believed to be accurate, it may include errors or inaccuracies.
I will not and cannot be held liable for any actions you take as a result of anything you read here.
Conduct your own due diligence, or consult a licensed financial advisor or broker before making any and all investment decisions. Any investments, trades, speculations, or decisions made on the basis of any information found on this channel, expressed or implied herein, are committed at your own risk, financial or otherwise.
Gold | Oil | Dollar | Silver | Natural Gas Price ForecastGold | Oil | Dollar | Silver | Natural Gas Price Forecast
COMEX:GC1! COMEX:SI1! NYMEX:CL1! AMEX:UNG

Bullish bounce?The US Dollar Index (DXY) is falling towards the pivot which is a pullback support and could bounce to the 1st resistance.
Pivot: 98.54
1st Suport: 96.63
1st Resistance: 101.95
Disclaimer:
The above opinions given constitute general market commentary, and do not constitute the opinion or advice of IC Markets or any form of personal or investment advice.
Any opinions, news, research, analyses, prices, other information, or links to third-party sites contained on this website are provided on an "as-is" basis, are intended only to be informative, is not an advice nor a recommendation, nor research, or a record of our trading prices, or an offer of, or solicitation for a transaction in any financial instrument and thus should not be treated as such. The information provided does not involve any specific investment objectives, financial situation and needs of any specific person who may receive it. Please be aware, that past performance is not a reliable indicator of future performance and/or results. Past Performance or Forward-looking scenarios based upon the reasonable beliefs of the third-party provider are not a guarantee of future performance. Actual results may differ materially from those anticipated in forward-looking or past performance statements. IC Markets makes no representation or warranty and assumes no liability as to the accuracy or completeness of the information provided, nor any loss arising from any investment based on a recommendation, forecast or any information supplied by any third-party.

EURUSDHello Traders! 👋
What are your thoughts on EURUSD?
In the EUR/USD chart, we can see that price failed to close above the marked resistance zone and was rejected from that area.
Additionally, the pair has broken its ascending trendline and closed below it, signaling a potential shift in short-term momentum.
We expect a pullback toward the broken trendline or resistance zone, followed by a downward continuation toward the next support level.
If a weekly candle closes above the resistance zone, this bearish scenario will be invalidated.
Don’t forget to like and share your thoughts in the comments! ❤️

DXY Demand Area! Buy!
Hello,Traders!
DXY pulls back into a well-defined horizontal demand area, aligning with ICT displacement logic. A bullish reaction from this level may confirm accumulation before expansion toward 99.10 liquidity. Time Frame 3H.
Buy!
Comment and subscribe to help us grow!
Check out other forecasts below too!
Disclosure: I am part of Trade Nation's Influencer program and receive a monthly fee for using their TradingView charts in my analysis.

Dollar at Max Deviation — Watching 99.197 CloselyThe dollar had another wild week, closing around 99.197 — right on the edge of major structure.
Most traders see strength, but when you zoom out, this move looks stretched.
Yields have started to cool off, which takes pressure off the dollar’s safe-haven run.
We still got smaller data releases like PMIs and Fed talks, but the big stuff like CPI is on hold until the U.S. shutdown clears.
Even the IMF warned about growing liquidity risks in global FX — meaning sudden spikes or fake outs can happen fast when markets get thin.
Technically, we’re in a bearish zone on the higher timeframe.
The last three months of liquidity targets are already taken, and the market’s now trading inside maximum deviation — a point where algorithms usually reset before any new trend forms.
That’s why 99.197 matters: it’s the last shelf before structure confirms the drop.
If price breaks and holds below that level early next week, momentum likely shifts bearish.
If it holds above, expect more sideways chop before a correction.
For now, it’s all about patience and tracking structure — not emotions.

DXYDXY has given us push up last week, now it needs correction or impulse down.
Disclosure: We are part of Trade Nation's Influencer program and receive a monthly fee for using their TradingView charts in our analysis.
