Maintaining purchases at the turn of the yearThe market has perfectly worked out the scenario outlined in the last review, and buyer activity is growing. We are approaching the end of the year, and we will consider the near-term prospects. On average, the market consolidated in anticipation of determining the opening level of a new annual candle for ETH and BTC. As I expected, ETH opened the second half of the month in the neutral zone, which smooths out sales. There is also a strong bullish signal for a retest of 3500. BTC has reached strong medium-term support around 85k, from which the probability of a rollback to a retest of 100k prevails, which I described in the last review. We have already seen one pullback, but there is still a possibility of an attempt to break through 100k after the opening of a new annual candle. Against the background of preparations for a new wave of purchases at the beginning of the year and the struggle for the closing level of the year, the probability of a new test of the range of 3100-3500 ETH prevails.
A pullback in brent with consolidation above $ 60 also inspires optimism among buyers. If the year opens above this level, a very rapid reaction of the cryptocurrency market with a large wave of purchases is likely. However, most of the market, especially large-cap coins, still retains the potential for a turnaround to a clear bull run, which may linger until the next seasonal bullish period in February. With this picture, it is worth carefully weighing the growth potential before additional purchases today and giving preference to heavily oversold assets with high technical goals for retest and slow issuance.
Today, I still prefer TURTLE NFP HOOK NTRN VIC MITO ENSO BMT SHELL, for which the growth potential is higher than the rest of the altcoin market, which may contribute to growth similar to RESOLV or STO in the near future. Among the coins with the tag monitoring for work, I consider only CHESS, which has high technical signals for retest up to 0.10-15.
Against the background of the annual rollback in CHZ, the probability of a bullying in fan tokens is also increasing. ATM ACM CITY JUV looks especially interesting. However, the dynamics of CHZ in the second half of the year is quite negative, I recommend working with fan tokens in a small volume and not increasing turnover if there are older unclosed positions.
J-hook

Growth up to 200% according to NFPTo date, the market continues to move exactly according to the scenario that I outlined in the last review. On Monday and Tuesday, the probability of a flat with sales attempts prevails, but from the middle of the week I expect the bullish trend to continue as part of a pullback on the annual candle and seasonal growth with an attempt to consolidate in the range of 3250-3500 ETH.
This week, NFP and SHELL reached medium-term supports, which I am now taking into account to work alongside TURTLE NTRN MITO VIC ENSO HOOK BMT. At the moment, 50% of tokens are already in circulation with further smooth unlocking, which will put minimal pressure on the price. In the future, the area for reliable scalping will shift slightly next year. For this instrument, there are long-term technical signals for growth up to 0.35-45, that is, 10X+. However, with the current bear market, we can still expect an attempt to retest the 0.060-75 range with a further pullback and resumption of growth in a new annual candle, which can already bring up to 150% profit. The intermediate resistance is the 0.05 level. If the daily or weekly candle opens higher, an active continuation of growth is likely. The opening of the second half of the month above this level will also be a signal for support.

BMT has prepared up to 400% growth In this review, I will consider in detail the BMT, which I previously took into account. First of all, it is worth noting the issue of this token. At the moment, 50% of tokens have already been unlocked and further issuance is slowing down, which will not put significant pressure on the price. For the next year, the 0.0250 level will remain the main support from which attempts will be made to gain a foothold above 0.05. A very important signal is the opening of the half-year above 0.125, which may lead to a sharp reversal of the half-year candle up to this level. If low volatility persists, the range of 0.100-125 will remain a medium-term target for retest and will be worked out, but with a possible pullback. On a smaller scale, the second half of the quarter opened above 0.0250, which is a signal for a test of 0.050-75. As a result, there is a fairly high probability of an attempt to close the current monthly candle above 0.05, with the trend continuing in the new month. After a local break in the 0.075-90 region, there is a high probability of a rollback to a 0.05 retest followed by an attempt to resume growth.
TURTLE MITO VIC NTRN ENSO CHESS HOOK has a similar growth potential today.

Opportunities for market growth at the end of the yearToday we have reached a new major bifurcation point in the middle of the quarter, which I have focused on. For individual coins, starting in the middle of this week, the probability of a bullish quarterly candle reversal with large growth waves will increase, similar to RESOLV and TNSR. Such reversals will be facilitated by a slowdown in the fall of ETH with attempts to change the trend before the end of the year.
So far, the bearish influence has prevailed in the market, with the opening of most major periods below key resistances and stable sales until the middle of the quarter to consolidate below 3,500, which I will indicate in the latest review. The ultimate goal of the bears in this quarter is to test the range of 2500-2750, with an attempt to close the annual candle in it under a negative scenario, and against the background of consolidation below 3500, this goal is still relevant. By the end of the month, we may still see new sales impulses to break through 2750, but with increasing buying activity at the end of each week, against which individual coins will try to grow. The second half of the quarter for ETH opened below 3,250, which gives a signal for sales below 3,000 up to 2,500, but an opening above 3,100 is a technical signal for growth up to 3,500-4,100. The attempt to reverse the quarterly candle is also facilitated by its opening above 4,100.
And so, under an optimistic scenario and a stable transition to a reversal of the quarterly candle in the second half of the week, purchases can be expected until the end of the week, with the aim of opening a new week above 3250, which will ensure continued growth until the end of the month and the possibility of opening a new month with a growth signal before the end of the year. With less volatility, there is a chance of opening a new week below 3,100, which could lead to a reversal next week.
As I wrote in a review at the beginning of October, BTC opened the quarter negatively, with a pullback signal down to 90-100 k, which the bears successfully worked out. There is a large medium-term support in the 85-90k zone, from which a pullback is likely. In addition to the growth of the altcoin index and the growth of ETH/BTC, which I expect at the turn of the quarter, the slowdown in the decline of BTC will also cease to put pressure on the market and allow individual coins to show major reversals.
Brent may once again have quite a big impact on the markets. If today and tomorrow the price fixes above $ 64 and, moreover, above $ 65, then the probability of growth of the crypt will prevail until the close of the week. In the event of US manipulation and a sudden new wave of brent sales below $62.5 today or tomorrow, there will be a chance for an ETH reversal before the weekend. Given the released data on stocks in the United States, the probability of a positive scenario prevails. All markets are connected, and no matter how absurd it may seem at first glance, it was the background manipulation of the commodity price that allowed the bears to break through key supports on ETH more than once, both on October 10 at 4,100, and at the subsequent 3,500, 3,250 and 3,100. By superimposing the dynamics of brent in the second half of the week on the dynamics of ETH by the weekend, you can see a chain reaction. That is why by the second half of October, I predicted a drop down to 3,500 by the end of the week, in the event of a drawdown of brent to $ 60.
Against the background of a slowdown in the fall of ETH and attempts to reverse the quarter, it is possible to make regular toppings for individual coins. First of all, it is worth paying attention to TURTLE and MITO, which have strong technical signals for growth up to 0.21-25 in the medium term. So the potential is the ground for dynamics similar to RESOLV. VIC BMT HOOK CHESS also has slightly weaker technical signals for growth, which I am also considering working with in the first place. On an attempt to reverse the quarter, there is a high probability of their growth to 50-70%, at least with the aim of breaking the last monthly candle. In the case of a stable ETH reversal, growth impulses of up to 200%+ can be expected.
Similarly, growth waves of up to 40-50% may show weaker instruments that do not have obvious signals, but are in an extremely oversold zone, such as QUICK COS FIO DATA. In my opinion, these tools are candidates for the assignment of the monitoring tag, given the dynamics, and therefore I recommend using a small position when working with them.
In addition to the positive note towards the end of the year that has appeared at the moment, I would like to focus on the overall negative dynamics of the market, which may continue at the beginning of the year. The current likely pullback on the quarterly and annual candles is still a temporary phenomenon and gives opportunities to coins that have technical growth signals left earlier. Most of the market, after attempts to roll back the tops at the turn of the year, is likely to continue falling until the second quarter. That is, coins without obvious growth signals, especially those with large capitalization, may remain flat until January or February without significant purchases followed by a major break.

Up to 150% on TURTLEToday, against the background of the general market pullback, new options are being formed for medium-term investments and scalping on coins recently added to binance. I would like to draw attention to TURTLE, which has reached probable medium-term support in the range of 0.085-100. With the current issue from this range, the probability of a price reversal prevails for at least a retest of large purchase volumes around 0.21. Today, the first investments have already been made to reverse the trend, more stable purchases can be expected in the second half of this week with the consolidation of ETH above 3,100. Also, as you pass through the middle of the quarter, there is a high probability of an attempt to reverse the quarterly candle both for the tops and for individual coins. A test of the lower support of 0.060-75 for TURTLE is possible only with an additional drawdown of ETH to the test of 2500-2600, which is less likely so far. From this range, a rapid price recovery above 0.1 is likely, which will serve as a good opportunity for additional scalping in addition to the main position. In case of a successful reversal of ETH from 3100-3250 to the 4100 retest on TURTLE, there is a fairly high probability of testing the range of 0.21-25.
The MITO VIC BMT HOOK has also reached levels for a new trend reversal attempt, which I am also considering working on. They can be used to top up in addition to the main position to take a reversal attempt up to 30-60%.
ADX and PIVX, which I recommended earlier, have performed well, but I am not considering them for further work, since the target levels for them have been worked out and it is possible to add the monitoring tag further.

Further market dynamicsTo date, the market has fully fulfilled its targets at the 3500 retest against the background of brent leaving below 64. Further, until the second half of Sunday, the probability of purchases up to the 4500 retest prevails. An important guideline for further dynamics will be the opening level of the new week and the second half of the month. If these periods open at least above 4,100, the probability of a flat and maintaining the market with the possibility of a breakout next month will remain. With weak purchase dynamics, there is a chance of opening the second half of the month below 4,100. In this case, in any case, we will see purchases before the end of the month for a pullback on the monthly candle, but then the market will consolidate around 3500. The available technical signals currently outweigh the bullish scenario. In this case, individual coins will turn the current month into a bullish one with significant interruptions.
The main contenders for this month's move are MITO VIC BMT HOOK, which are highly unlikely to be contenders for the monitoring tag and are more suitable for medium-term investments. It is also possible to consider scalping in the short term CHESS FIO COS QUICK DATA, which have reached supports and can show a deeper drawdown only when the ether falls below 3500. A signal has been left for a move to the ADX, however, there is a possibility of a deeper drawdown to 0.075-85 before the reversal.

Following PIVX, we take the X's on the HOOKAs I have already written, you should not try to jump on the departed train on pivx, which I recommended for purchase for more than a month, it is better to consider the options where the X's are just being prepared. First of all, they include CHESS HOOK BMT MITO VIC.
Consider the position of the HOOK. After listing on binance, the token left several strong technical signals for a retest up to 0-50-75, which is highly likely to lead to a major growth wave. The growth momentum last week was only the first investment in the upcoming trend. An uptrend line has been formed and there is a high probability of an attempt to consolidate above it before the end of this month. The quarter opened in a mixed zone, an opening above 0.09 gives a signal for growth up to 0.15, however, an opening below 0.1 is likely to give pullbacks in the event of a sharp increase. The main long-term support for the current issue is the 0.0750-850 range, from which there was a rebound after a long-term rebidding. A hike below this range is likely only with an additional significant drawdown of ETH. The most likely target is an attempt to close the current monthly candle above 0.21-21 in order to continue the trend in the new month. With negative overall market dynamics, there is a possibility of a pullback from 0.21-25. In this case, in the new month, we can expect a new attempt to return to the trend line from 0.110-125, which will provide an additional opportunity for scalping.

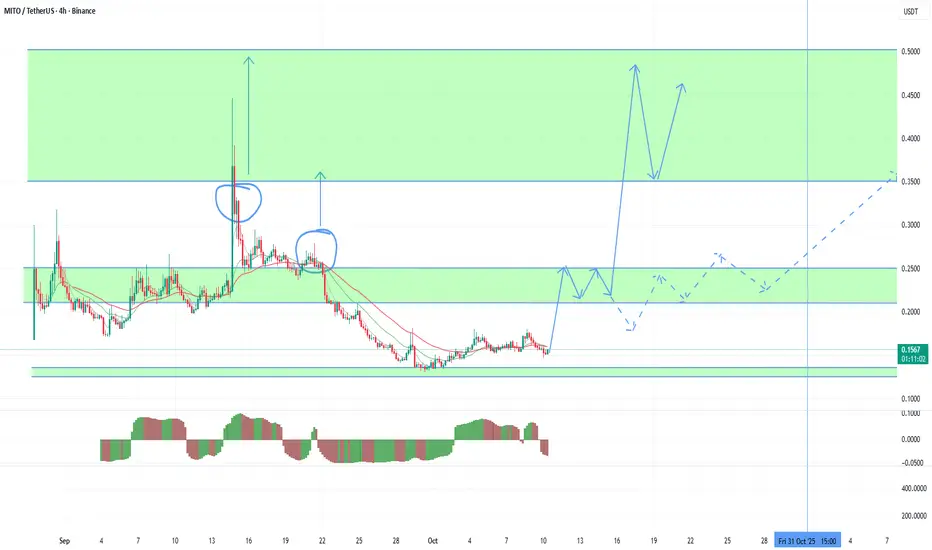
MITO is ready to repeat the achievements of STOStarting this weekend, the probability of new waves of growth in alcoins is growing, and I want to consider the situation with the coins that I keep in mind for work.
First of all, I will consider more reliable options for working in the mid-range, where you can hold a position from current levels and top up in case of a test of lower support in a falling market, such as the MITO VIC HOOK BMT. In this review, I will pay attention to MITO, which can repeat the STO picture this month. With the current issue, the main support is the range of 0.125-35, below which a fall is possible only if ETH falls to 3500-3750, which will create a good opportunity for additional confident earnings. This week, the 4750 level was re-broken for ETH, which is a signal for a second attempt to break 5000. It is more likely that this attempt will be made as early as next month. However, reducing the threat of a further drop in ether is already giving rise to purchases on MITO. And so purchases can be kept from the current levels, as there has been a rebound from the main support. In an optimistic scenario, a sharp increase may begin as early as this weekend with the closing of the weekly bullish candle and the continuation of the trend in the new week. The immediate goal is to return to the resistance in the range of 0.21-25, after the rebidding, which will open the possibility for a test of 0.35-50. This range is the main target for current emissions. With the negative dynamics of ETH, there is a possibility of a decrease in growth rates. In this case, we can see a significant pullback from 0.25 with the continuation of the trend after the opening of a new monthly candle above 0.21.
Among the weak coins, PIVX proved to be the main option for working with the greatest growth potential. There was an open zone until the 0.35-50 test, however, the breakdown occurred against a rather negative opening of the quarter, which is highly likely to lead to sharp disruptions in growth. Also, this token is essentially a dummy and carries only speculative interest, being a potential contender for adding the monitoring and delisting tag. I will consider it back to work only after returning to the range 0.100-125. However, this weekend the trend may still hold against the background of the absence of further decline in ETH.
Among similar coins with weak dynamics, the probability of assigning the monitoring tag, but high undeveloped targets are chess with a probability of growth up to 100%+ from current levels and ADX FIO with a potential for growth up to 50%+ from current levels, but also an additional drawdown before rising to 20-25%.
ATM ACM CITY JUV fantokens have a similar growth potential to PIVX. However, it is worth bearing in mind the extremely low liquidity and long accumulation of these instruments when choosing a position size.
#HOOK/USDT (Binance Futures) Descending wedge on support#HOOK
The price is moving within a descending channel on the 1-hour frame, adhering well to it, and is heading for a strong breakout and retest.
We have a bearish trend on the RSI indicator that is about to be broken and retested, which supports the upward breakout.
There is a major support area in green at 0.0960, representing a strong support point.
We are heading for consolidation above the 100 moving average.
Entry price: 0.0994
First target: 0.1052
Second target: 0.1095
Third target: 0.1158
Don't forget a simple matter: capital management.
When you reach the first target, save some money and then change your stop-loss order to an entry order.
For inquiries, please leave a comment.
Thank you.

#HOOK/USDT#HOOK
The price is moving within a descending channel on the 1-hour frame, adhering well to it, and is heading for a strong breakout and retest.
We have a bearish trend on the RSI indicator that is about to be broken and retested, which supports the upward breakout.
There is a major support area in green at 0.0953, representing a strong support point.
We are heading for stability above the 100 moving average.
Entry price: 0.1070
First target: 0.1135
Second target: 0.1200
Third target: 0.1300
Don't forget a simple matter: capital management.
When you reach the first target, save some money and then change your stop-loss order to an entry order.
For inquiries, please leave a comment.
Thank you.

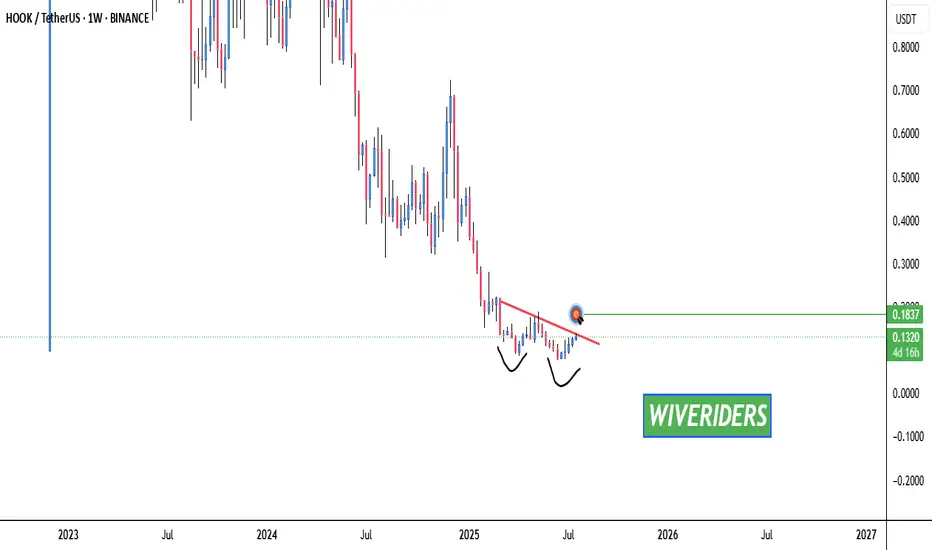
HOOK Testing Red Resistance & Forming Double Bottom🚨 HOOK Testing Red Resistance & Forming Double Bottom 🔴📈
HOOK is currently testing the red resistance trendline and has formed a bullish double bottom pattern, which could indicate a potential reversal.
🎯 If breakout is confirmed:
✅ First Target – Green line level
📊 A confirmed breakout of both the resistance trendline and the double bottom structure could signal strong bullish momentum.
Watch for confirmation before entering! 💼💸
#HOOK/USDT | Long Bias ?#HOOK
The price is moving within a descending channel on the 1-hour frame, adhering well to it, and is on its way to breaking it strongly upwards and retesting it.
We have a bounce from the lower boundary of the descending channel. This support is at 0.0882.
We have a downtrend on the RSI indicator that is about to break and retest, supporting the upside.
There is a major support area in green at 0.0857, which represents a strong basis for the upside.
Don't forget a simple thing: ease and capital.
When you reach the first target, save some money and then change your stop-loss order to an entry order.
For inquiries, please leave a comment.
We have a trend to hold above the 100 Moving Average.
Entry price: 0.0941
First target: 0.0989
Second target: 0.1045
Third target: 0.1121
Don't forget a simple thing: ease and capital.
When you reach the first target, save some money and then change your stop-loss order to an entry order.
For inquiries, please leave a comment.
Thank you.

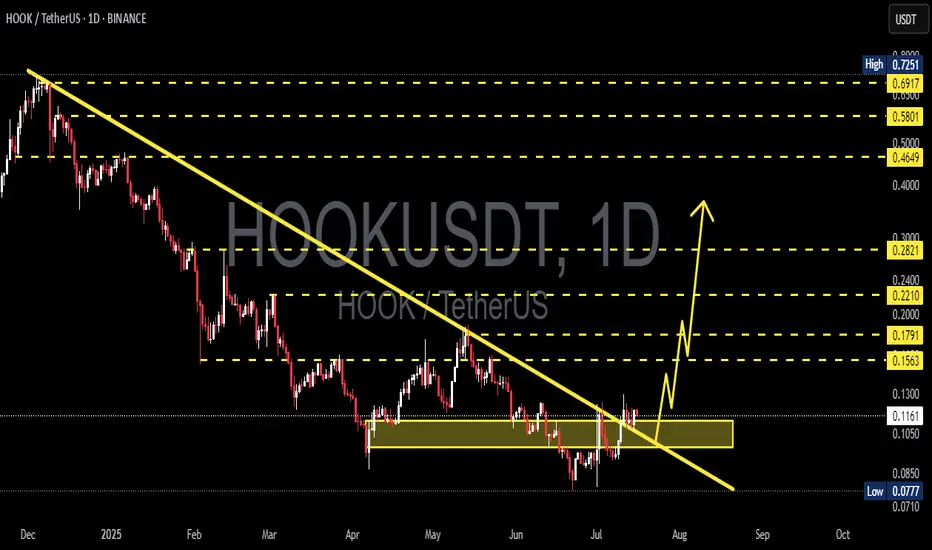
HOOK/USDT Major Downtrend Breakout — Reversal in Play🔍 Chart Overview
HOOK/USDT has finally broken out of its macro downtrend, which had been holding the price down since December 2024. This breakout is not just a technical move — it could mark the beginning of a mid- to long-term reversal. The price is now retesting the breakout area (yellow box), offering an ideal entry point before a potential rally.
📈 Pattern & Technical Structure
🟡 1. Breakout from Long-Term Downtrend
The yellow trendline shows a 7-month-long bearish trendline.
Price has now closed daily candles above this line, indicating a clear shift in market structure.
The breakout occurred after a sideways accumulation phase between $0.1050 – $0.1200, which also acts as a demand zone.
🟢 2. Inverse Head and Shoulders (IH&S) Pattern
Left and right shoulders formed around $0.1050
Head formed at the $0.0710 – $0.0777 zone
Price has broken above the neckline, validating the IH&S reversal pattern
📊 3. Volume & Momentum
Increased volume during the breakout confirms strong buying interest
If the retest holds, bullish momentum could accelerate toward key resistance levels
🟢 Bullish Scenario (Positive Outlook)
If price holds above the retest zone ($0.1167 – $0.1200) and confirms support:
Bullish Targets:
1. $0.1300 – Nearest minor resistance
2. $0.1563 – Breakout confirmation zone
3. $0.1791 – Psychological and fib confluence
4. $0.2210 – IH&S pattern target
5. $0.2821 – Key horizontal resistance
6. $0.4649 – $0.5801 – Golden pocket zone (Fibonacci retracement)
✅ Potential ROI: 100%+ from current levels
🔴 Bearish Scenario (Negative Outlook)
If HOOK fails to hold above $0.1050:
The breakout may become a false breakout (bull trap)
Price could fall back toward $0.0850
A deeper drop toward $0.0777 – $0.0710, the last major demand zone
🚫 Breakdown below this zone would re-enter a long consolidation phase
🎯 Conclusion & Strategy
HOOK is at a critical turning point. A confirmed breakout from the macro downtrend + IH&S pattern signals a high-probability bullish reversal. The current pullback serves as a textbook retest — a prime area for entries.
Aggressive traders can consider entering now with SL below $0.1050. Conservative traders may wait for confirmation candles above $0.1300.
✅ Quick Checklist:
✅ Confirmed breakout from macro downtrend
✅ Inverse Head and Shoulders pattern active
✅ Volume spike supports breakout
✅ Retest in progress at key demand zone
#HOOKUSDT #HookBreakout #CryptoReversal #AltcoinSeason #InverseHeadAndShoulders #TechnicalBreakout #CryptoAnalysis #ChartPattern #TradingSignals #HookAnalysis #BreakoutCrypto
#HOOK/USDT#HOOK
The price is moving in a head and shoulders pattern on the 1-hour frame, adhering well to it, and is heading for a strong breakout upwards and retesting it, forming the right shoulder.
We have a bounce from the lower channel line to the right shoulder, which is support at 0.0890.
We have a downtrend on the RSI indicator that is about to be broken and retested, supporting the upside.
We have a trend of consolidation above the 100 moving average.
Entry price: 0.0970
First target: 0.1000
Second target: 0.1039
Third target: 0.1096

Will #HOOK Continue to Rise or a Trap is Being Set? Must Watch Yello Paradisers! Have you seen the recent price action of the #HookedProtocol or not? Let's see what's happening with #HOOK and its next move:
💎#HOOKUSDT has been moving in a clear falling wedge pattern, with price respecting both the descending resistance and support levels since late April. After multiple rejections from the lows, we finally saw a breakout from the wedge, which is a potential sign that bulls are preparing for a shift in structure.
💎Currently, #HOOKUSD is trading near 0.1120, and the 50EMA is now acting as support, which increases the probability of a continued move higher. The first area we are watching is 0.1242, which now acts as the moderate resistance. If the market manages to hold above this level, it opens up the path toward 0.1938, the next strong resistance, and a level where profit-taking becomes critical.
💎However, if bulls fail to hold the structure and price breaks back below 0.0779, then the entire bullish setup becomes invalid. In that case, we’ll likely revisit the 0.0600 region, and the trapdoor opens for late buyers who ignored the warning signs.
Stay sharp, Paradisers. The market is about to pick a side and we’ll be on the right one.
MyCryptoParadise
iFeel the success🌴

Hooked Protocol Preparing 3,000% Rise, No ATH NeededA 3,000% rise on Hooked Protocol would match prices from January-February 2023, not even an all-time high is needed for this huge potential profits.
The calm before the storm
Is it calmed? In some ways it is because people are enjoying their summer vacations. The market is calm but I can feel the energy boiling under the surface. I can see, sense, feel and even hear future FOMO building up. I am already seeing the huge market growth.
How much will it take the action to intensify?
Is it possible that everything will pick up steam, so to speak, after the 4th of July. It is possible indeed. There is something about prices going up. When the market starts to rise... See, prices first will be high and then people show up. That is because people tend to be around when the action is strong. What catches the attention of retail is the news cycle, the sharing and exchanging, and for this to happen something needs to happen and what actually happens is rising prices.
We are seeing some of this but we are looking at it up-close. People that are not in the market can't see it but they will be able to see it when the altcoins start growing 300% within days and mainly when Bitcoin breaks resistance and hit a new all-time high. Two weeks maximum but I believe the market is hot now but hard to detect for those without experience. You've seen the charts in the past few weeks, you've seen how 22-June marked a new low. Similar to 7-April but higher, the start of the next bullish impulse.
There is still time but early is best
Opportunities are endless and many more will continue to develop throughout the coming weeks and days. Early is best but the market will grow for at least 6 months so we can even say that we are still early.
3,000% profits potential
Hooked Protocol here can grow 3,000% or more. Notice the size of the candles on the chart, I am using the linear chart.
On the left, the candles are big as prices go up and then start to fall. The further we go to the right, the smaller the candles. This reveals a transition. We will have big candles again in the 2025 bull market.
1,772% is a strong but easy target. 3,000% is possible but there is also 2,420% on the chart.
This is just one pair, one project, one altcoin, one opportunity, there are plenty more. Choose wisely. Cryptocurrency is here to stay. You can change your life in a matter of years, for the better.
Thank you for reading.
Namaste.

Hook USDT SWING and Scalp TradeFor spot, try to accumulate hook from here 0.1680 and 0.12, scalp trade tp 0.19 Swing TP 0.22$. If you are taking it in future then book some on 0.19 and rest on 0.22$.

HOOKUSDT 1D AnalysisHOOK ~ 1D Analysis
#HOOK Buy gradually from here if you still have conviction in this coin, with a short-term target of at least 10%+ from this point.

Hook (SPOT)BINANCE:HOOKUSDT
HOOK / USDT
4H time frame
analysis tools
____________
SMC
FVG
Trend lines
Fibonacci
Support & resistance
MACD Cross
EMA Cross
______________________________________________________________
Golden Advices.
********************
* Please calculate your losses before any entry.
* Do not enter any trade you find it not suitable for you.
* No FOMO - No Rush , it is a long journey.
Useful Tags.
****************
My total posts
www.tradingview.com

#HOOK/USDT#HOOK
The price is moving in a descending channel on the 1-hour frame and is expected to continue upwards
We have a trend to stabilize above the moving average 100 again
We have a descending trend on the RSI indicator that supports the rise by breaking it upwards
We have a support area at the lower limit of the channel at a price of 0.1560
Entry price 0.1700
First target 0.1800
Second target 0.1906
Third target 0.2030

#HOOK/USDT#HOOK
The price is moving in a descending channel on the 1-hour frame and is adhering to it well and is heading to break it strongly upwards and retest it
We have a bounce from the lower limit of the descending channel, this support is at a price of 0.1670
We have a downtrend on the RSI indicator that is about to break and retest, which supports the rise
We have a trend to stabilize above the moving average 100
Entry price 0.1740
First target 0.1816
Second target 0.1897
Third target 0.2000

HOOKUSDT Breakdown Incoming? Key Signals Point to Bearish Move!Yello, Paradisers! Is HOOKUSDT gearing up for a major drop? The current structure suggests a strong probability for further downside as the price follows a triple three-wave pattern within a descending channel.
💎HOOKUSDT recently faced strong resistance from multiple confluences: 50 EMA rejection, Key resistance zone, Descending channel’s trendline, Formation of an "M" pattern. These factors increase the likelihood of a wave Z move downward. However, for confirmation, we need a clear breakdown of the support level with a candle close below it and high volume.
💎The broader crypto market also leans bearish, but waiting for the actual breakdown will further strengthen our probability of a successful trade.
💎Invalidation? If the price bounces and closes candle above the resistance zone, the bearish outlook gets invalidated. In that case, it’s smarter to stay patient and wait for a stronger setup.
🎖 Discipline and patience are key, Paradisers! The market always rewards those who wait for the highest-probability trades. Stay sharp!
MyCryptoParadise
iFeel the success🌴

Is HOOK About to Bounce or Break? Critical Levels to watch!Yello, Paradisers! Are we on the verge of a bullish move with HOOKUSDT, or is a breakdown lurking around the corner? Let’s dive in!
💎HOOKUSDT is currently sitting at a key support zone, and the probability of a bullish bounce from this level is high. However, probabilities in trading are never guarantees, so here’s what you need to watch for to confirm the next move.
💎If we see a bullish I-CHoCH (Internal Change of Character) or classic bullish patterns like the W pattern or Inverse Head and Shoulders on lower timeframes, the chances of a bounce will increase significantly. These patterns indicate that buyers are stepping in at these critical levels.
💎We also need to watch TOTAL2 (the altcoin market cap excluding BTC) and TOTAL3 (altcoin market cap excluding BTC and ETH). These broader market indicators provide context for altcoin sentiment and help avoid making isolated decisions based solely on one chart. Remember, the crypto market moves as a system — you can’t ignore the bigger picture!
💎If the price breaks down and closes below this strong support zone, it will invalidate the entire bullish setup. In that case, waiting for more clear and confident price action before jumping in will be the smarter move. Chasing trades after a breakdown can lead to unnecessary losses, and patience is what separates professional traders from gamblers.
🎖 This is exactly why discipline and patience are your most powerful tools in this market. If the bounce comes, it could be highly profitable, but don’t let emotions drive your decisions if the price breaks down. Staying objective and waiting for confirmations is what makes long-term winners.
MyCryptoParadise
iFeel the success🌴
