Litecoin Entering Its Blast Off Point LTC/USDThis is what it looks like to me. It looks like we may be finding some support around here. If I am right and this fractal is repeating I think we see Litecoin actually go straight up to $250 before it comes back down to retest the now support previous resistance at around 135, quite quickly then reverse sharply to the upside. Im long here, lets hope Im right cause this would wash out alot of longs and shorts right before the real big move. None of this is financial advice just my opinion.
J-LTC

LITECOIN H4 | Bearish reversalBased on the H4 chart analysis, we could see the price rise to the sell entry which acts as a pullback resistance and could drop from this level to the downside.
Sell entry is at 126.19, which is a pullback resistance.
Stop loss is at 133.27, which is a swing high resistance.
Take profit is at 111.07, which is a pullback support that is slightly above the 78.6% Fibonacci retracement.
High Risk Investment Warning
Trading Forex/CFDs on margin carries a high level of risk and may not be suitable for all investors. Leverage can work against you.
Stratos Markets Limited (tradu.com ):
CFDs are complex instruments and come with a high risk of losing money rapidly due to leverage. 65% of retail investor accounts lose money when trading CFDs with this provider. You should consider whether you understand how CFDs work and whether you can afford to take the high risk of losing your money.
Stratos Europe Ltd (tradu.com ):
CFDs are complex instruments and come with a high risk of losing money rapidly due to leverage. 66% of retail investor accounts lose money when trading CFDs with this provider. You should consider whether you understand how CFDs work and whether you can afford to take the high risk of losing your money.
Stratos Global LLC (tradu.com ):
Losses can exceed deposits.
Please be advised that the information presented on TradingView is provided to Tradu (‘Company’, ‘we’) by a third-party provider (‘TFA Global Pte Ltd’). Please be reminded that you are solely responsible for the trading decisions on your account. There is a very high degree of risk involved in trading. Any information and/or content is intended entirely for research, educational and informational purposes only and does not constitute investment or consultation advice or investment strategy. The information is not tailored to the investment needs of any specific person and therefore does not involve a consideration of any of the investment objectives, financial situation or needs of any viewer that may receive it. Kindly also note that past performance is not a reliable indicator of future results. Actual results may differ materially from those anticipated in forward-looking or past performance statements. We assume no liability as to the accuracy or completeness of any of the information and/or content provided herein and the Company cannot be held responsible for any omission, mistake nor for any loss or damage including without limitation to any loss of profit which may arise from reliance on any information supplied by TFA Global Pte Ltd.
The speaker(s) is neither an employee, agent nor representative of Tradu and is therefore acting independently. The opinions given are their own, constitute general market commentary, and do not constitute the opinion or advice of Tradu or any form of personal or investment advice. Tradu neither endorses nor guarantees offerings of third-party speakers, nor is Tradu responsible for the content, veracity or opinions of third-party speakers, presenters or participants.

Heikin Ashi Trade Idea📈 Hey Traders!
Here’s a fresh outlook from my trading desk. If you’ve been following me for a while, you already know my approach:
🧩 I trade Supply & Demand zones using Heikin Ashi chart on the 4H timeframe.
🧠 I keep it mechanical and clean — no messy charts, no guessing games.
❌ No trendlines, no fixed sessions, no patterns, no indicator overload.
❌ No overanalyzing market structure or imbalances.
❌ No scalping, and no need to be glued to the screen.
✅ I trade exclusively with limit orders, so it’s more of a set-and-forget style.
✅ This means more freedom, less screen time, and a focus on quality setups.
✅ Just a simplified, structured plan and a calm mindset.
💬 Let’s Talk:
💡Do you trade supply & demand too ?
💡What’s your go-to timeframe ?
💡Ever tried Heikin Ashi ?
📩 Got questions about my strategy or setup? Drop them below — ask me anything, I’m here to share.
Let’s grow together and keep it simple. 👊

LTC Litecoin Short Term Pull Back Quick and SharpI believe Litecoin Is topping out on the 2 hour. Looks like we may come back down and tap support at around 104 but I wouldn't be surprised a wick hits 100. I have buy orders around 103-106. I am not super confident on a deeper pullback so thats why my buys are there is so i don't miss the dip. Id rather make a little less money than miss a buy in trying to nail the bottom. Litecoin is starting its breakout from a 7 year consolidation and accumulation phase. This should be pretty massive. Litecoin is going to benefit considerably from these new bills that are being signed and many of the favorites in the top 100 will soon disappear!
The time for Litecoin to shine as I have been talking about for years is now. I am almost certain that this is that time. My predictions all still hold if you would like to go read them. I was just off on timing. Timing is the hardest thing to predict especially with how wild this planet has been lately. None of this is financial advice its just my opinion.
Litecoin is approaching a critical breakout point.
LTC has been consolidating within this symmetrical triangle for an extended period, showing decreasing volatility and tighter price action. The structure suggests that a significant move is imminent.
🎯 Target 1: $400
🎯 Target 2: $1,000
If the breakout occurs in the coming weeks, we could see Litecoin reaching the $400 level within the next 2 to 3 months, with potential to hit $1,000 over the next 12 months — especially if bullish momentum picks up across the crypto market.
Watch closely — the move could be explosive.
Best of luck to everyone! 🚀

LTCUSDTI think the BINANCE:LTCUSDT price 📈 may pull back to $110.60 before pumping to higher levels 🚀.
Watch for reactions at $116.50 and $128.20 🔍 — key decision zones.
Supports: $116.50 – $110.60 – $104.60 🛡️
Resistance: $128.20 – $140 🏔️
Manage your risk ⚠️.


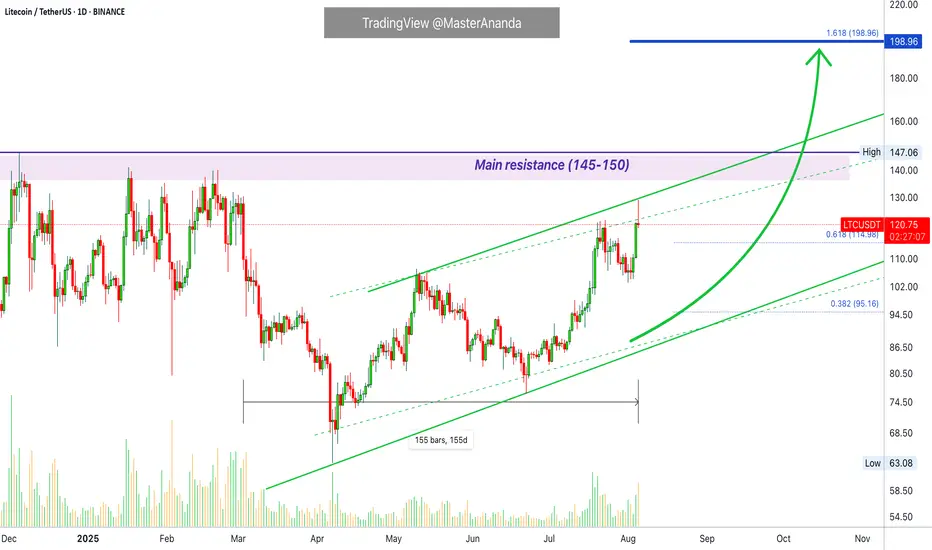
Litecoin Long-Term · Update · $642 & $1012We looked at Litecoin recently, it was on the daily timeframe. Immediate resistance sits at $150/$145. Think about this...
Looking at this chart, it is easy to see that Litecoin is trading at bottom prices. It is a bit high compared to all the peaks since 2022 but still low compared to 2021.
Now, this is all good. The "bit high" shows that buyers are present and buying, there is interest in accumulating Litecoin because prices continue to grow. Then the bottom has also been rising, a rising trendline, and this since June 2022.
If you go back to 2018-2020, there is a similar period. Litecoin hit bottom from a bear market and then started to consolidate. The consolidation phase had some bullish action coupled with higher lows. Same as now.
Needless to say, the end result was a massive bullish run, the 2021 bull market. We are seeing the same now but in 2025, market conditions are all the same. Litecoin hit bottom after a strong bear market and started to consolidate. The consolidation period shows a ranging market but still with higher highs and higher lows.
Litecoin is now at resistance while pushing higher, volume is starting to show.
The next target is $642 but Litecoin can go higher, this is only the next high. We have to wait and see for how long the bull market will go. The next target after $642 is $1012.
Thank you for reading.
Namaste.

LTCThe first ever altcoin
Lite coin was the second crypto currency ever created
It has never really marked up in price beyond the 1st wave and appears to have been accumulating this range since the 2017 cycle. ~8 years
Macro economic conditions aswell as a fresh market cycle this time with traditional finance at the helm means we likely see diversification of portfolios at some point. Ltc would be well placed to be included in some etfs and could see a range mark up due to this as well as several halving events with no markup.
Digital silver narrative could heat up aswell idk. Technically speaking it looks like accumulation is finishing and we could see expansion phase begin soon, heading into a late q3 or 4 rally but this is very speculative. I have seen one announcement of a tradfi firm announcing an ltc buy but that's it so far.
~2x to the range high with potential for claiming that high and consolidating.

LitecoinLtc usdt daily analysis
Time frame hourly
Risk rewards ratio >2.7👈👌
Short position
Target 100.5 $

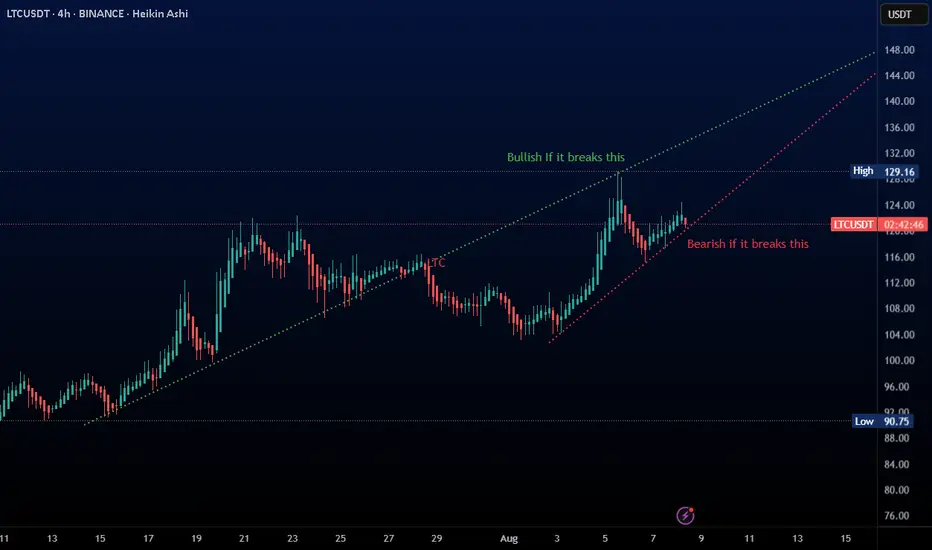
LTC Following Perfect Trend, May Breakout SOON !!! Keep an eye on these 2 trendlines for perfect setup
I have bought LTC as per below :
Bought Price : 120
TP : 130 +
Tight SL : 118 (To avoid risk)
LTCUSD H4 | Bullish bounceLitecoin (LTC/USD) is falling towards the buy entry which is an overlap support and could bounce to the upside.
Buy entry is at 110.50, an overlap support that is slightly above the 78.6% Fibonacci retracement.
Stop loss is at 101.23, which is a swing low support.
Take profit is at 123.91, which is a swing high resistance.
High Risk Investment Warning
Trading Forex/CFDs on margin carries a high level of risk and may not be suitable for all investors. Leverage can work against you.
Stratos Markets Limited (tradu.com ):
CFDs are complex instruments and come with a high risk of losing money rapidly due to leverage. 65% of retail investor accounts lose money when trading CFDs with this provider. You should consider whether you understand how CFDs work and whether you can afford to take the high risk of losing your money.
Stratos Europe Ltd (tradu.com ):
CFDs are complex instruments and come with a high risk of losing money rapidly due to leverage. 66% of retail investor accounts lose money when trading CFDs with this provider. You should consider whether you understand how CFDs work and whether you can afford to take the high risk of losing your money.
Stratos Global LLC (tradu.com ):
Losses can exceed deposits.
Please be advised that the information presented on TradingView is provided to Tradu (‘Company’, ‘we’) by a third-party provider (‘TFA Global Pte Ltd’). Please be reminded that you are solely responsible for the trading decisions on your account. There is a very high degree of risk involved in trading. Any information and/or content is intended entirely for research, educational and informational purposes only and does not constitute investment or consultation advice or investment strategy. The information is not tailored to the investment needs of any specific person and therefore does not involve a consideration of any of the investment objectives, financial situation or needs of any viewer that may receive it. Kindly also note that past performance is not a reliable indicator of future results. Actual results may differ materially from those anticipated in forward-looking or past performance statements. We assume no liability as to the accuracy or completeness of any of the information and/or content provided herein and the Company cannot be held responsible for any omission, mistake nor for any loss or damage including without limitation to any loss of profit which may arise from reliance on any information supplied by TFA Global Pte Ltd.
The speaker(s) is neither an employee, agent nor representative of Tradu and is therefore acting independently. The opinions given are their own, constitute general market commentary, and do not constitute the opinion or advice of Tradu or any form of personal or investment advice. Tradu neither endorses nor guarantees offerings of third-party speakers, nor is Tradu responsible for the content, veracity or opinions of third-party speakers, presenters or participants.

Litecoin LTC price analysisToday we will analyze the third candidate for ETF in the near future is CRYPTOCAP:LTC
An old coin, good fundamentals, 1:1 tokenomics like CRYPTOCAP:BTC but 4 times more coins, untapped potential, and the list goes on...
♎️ The main difference from the previous two candidates is the current market cap of the coins: CRYPTOCAP:XRP - $118 billion, CRYPTOCAP:SOL - $72 billion, #Litecoin only $6 billion
Accordingly, the prospects for growth in the price of OKX:LTCUSDT are many times greater
🔥 Currently, #LTCUSD price is near the potential purchase zone of $71.25-76.25
📈 Growth potential of at least $170-180
🐻Critical level of $67
_____________________
Did you like our analysis? Leave a comment, like, and follow to get more

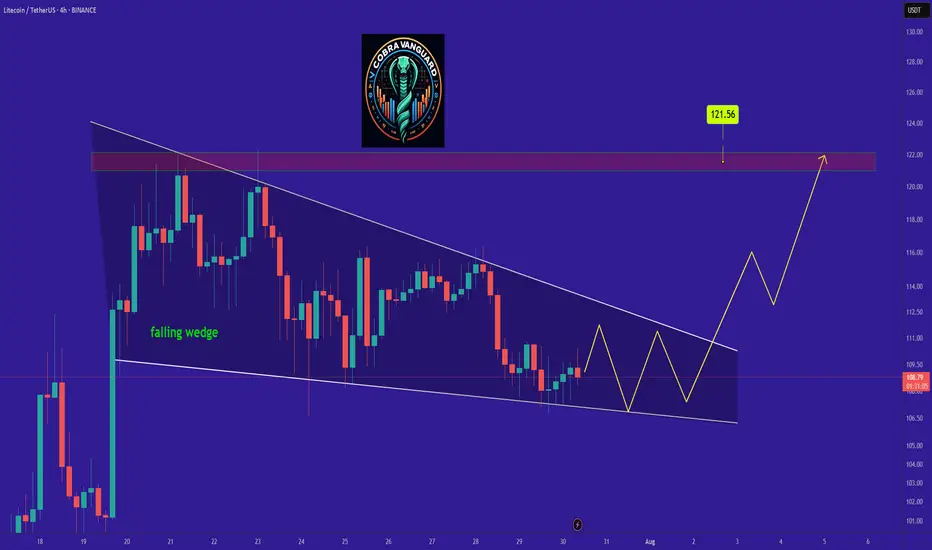
LTC is bullish now and many Traders don't see itSo if you pay attention to the LTC chart you can see that the price has formed a Ascending wedge which means it is expected to price move as equal as the measured price movement.( AB=CD )
NOTE: wait for break of the WEDGE .
Best regards CobraVanguard.💚
LTC/USDT Trade Plan: Litecoin & Nasdaq CorrelationKeeping a close eye on Litecoin (LTC/USDT) ⚡ — after a bullish breakout from a healthy pullback 📈, I’m eyeing the potential for continued upside momentum 🚀. This perspective remains heavily correlated to the performance of the NASDAQ; if equities continue their bullish trajectory 🟢, I’ll be looking to position myself in line with Litecoin strength.
In the video, we also dive into the Fibonacci extension tool to identify potential targets 🎯 and combine this with historical support and resistance levels 📍. Another key component of my analysis is the anchored volume profile, which I’ve demonstrated throughout the walkthrough 📉.
This is all part of my execution plan 📊 — full details are provided in the video and should not be considered financial advice ⚠️.

Litecoin Hits a New High · Update · Highest Price in 5 MonthsToday Litecoin hit its highest price in more than five months, since March 2025. Soon Litecoin will break its December 2024 high and produce the highest prices since the last bull market, 2021. We are getting very close now.
A few weeks back the market was in a similar situation, doubt started to creep in and people wondered if the market was set to endure a long-term correction or resume higher. We used Bitcoin Cash which was moving ahead to prove the rest of the market would do the same and it happened as predicted. Before Bitcoin Cash, further back, we used XRP and it worked.
Today we are looking at Litecoin and the action this chart is showing matches additional growth. While some pairs are retracing or consolidating, others continue to move ahead. This only happens in a bull market, and, when Bitcoin retraces while the altcoins continue to grow, this is a sure sign that the bulls are buying and the market expects additional growth.
Additional growth but remember retraces will always be present along the way. The market grows steadily but it takes time. Five steps: three steps forward, two step back. Allow time for variations. Retraces and corrections are an opportunity to rebuy and reload.
Secure profits when prices are up; buy back at support.
Sell when prices are high; sell when the market is green.
Sell when everything feels fine and great.
Buy when prices are low; buy when the market is red.
Buy when everything feels down and depressed.
Go against the market impulse. Make your decisions based on information. The market is growing and set to continue growing long-term. Choose wisely and let the market take care of the rest.
Namaste.
Litecoin (LTC) – Re-Entry After 44% RallyLTC rallied over 44% since our last trade setup. Now, we’re looking for a re-entry opportunity as the broader crypto market shows signs of a potential pullback.
🔍 Setup Overview:
Entry Zone: $108 – $103
Take Profits: $125 / $140 / $150
Stop Loss: Daily close below $100
Bias: Bullish continuation (as long as structure holds)
🧠 Trade Idea:
Expecting a possible sweep of the $104 low before upside resumes. Key condition: Daily candle must not close below $100—wicks are fine. If price respects this level, the bullish structure remains intact.
This is a classic liquidity grab scenario. Entering in the $108–103 zone allows favorable risk-to-reward if LTC catches support and reclaims momentum.
⚠️ Invalidation:
If LTC posts a daily close below $100, trade setup becomes invalid. Monitor price action closely around this key support zone.
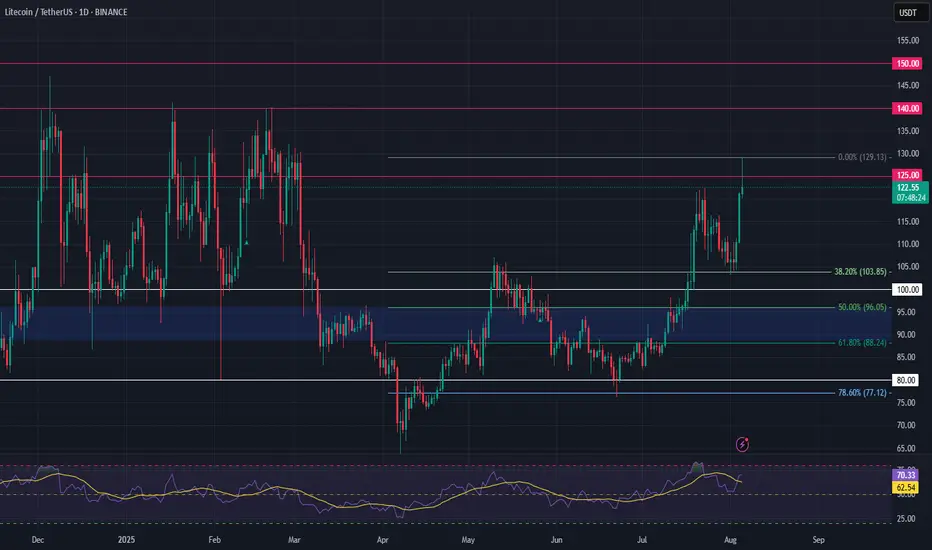
LTC Wakes Up — Bullish Adam & Eve Targets $150+LTC is gaining serious momentum, breaking through key resistance levels and printing a clean Adam & Eve bullish reversal pattern. The breakout signals a potential shift in the macro trend — and the chart is offering clear setups.
✅ Breakout Through $100 & Pattern Confirmation
LTC confirmed the Adam & Eve double bottom with a breakout above $100, a major psychological resistance.
The neckline retest around $105 acted as a Market Structure Shift (MSS) confirmation, with upside wicks signaling strong demand and a reversal.
$100–$105 Support Zone: Stacked Confluence
This zone offered a high-probability long setup due to multiple overlapping technical factors:
Yearly Open (via DriftLine - Pivot Open Zones ): $103.28
0.382 Fib Retracement: $104.67 (from $76.17 low to $122.29 high)
Anchored VWAP from the $76.17 low
POC of 1-Year Trading Range: ~$102
233 EMA & SMA (4H TF): Both moving averages aligned between $103–$100, acting as dynamic support
✍️ A clean, high-confluence demand zone between $100–$105 — ideal for long setups.
Upside Structure & Next Long Opportunity
➡️ Current Price: ~$127
A fresh long setup may present itself around $120 on a pullback
➡️ Pattern Target: $150
🌀 1.0 TBFE: $149.28
🌀 1.618 TBFE: $147.31
🔺 Key Swing High / Liquidity Pool (BSL): $147–$150 — an area to watch for possible rejection
🔴 Short Setup Consideration
➡️ Short zone: $147–$151
Only short on clear confirmation: SFPs, rejections, or bearish order flow
➡️ Downside target: $135 (1:2 R:R potential)
Macro Bullish Target: $198–$200
If LTC breaks and holds above $150, the next macro target becomes:
🌀 0.618 Fib Retracement (from $295.7 high to $40.3 low): $198.14
$200 Psychological Resistance: Major round number, likely to act as magnet and profit-taking zone
🛠 Indicators Used:
DriftLine — Pivot Open Zones
↳ For key levels like the Yearly Open, crucial in confluence stacking
📚 Educational Insight: Understanding the Adam & Eve Pattern
The Adam & Eve pattern is a classic bullish reversal formation that often marks the end of a downtrend or a major correction phase.
Adam forms first: a sharp, V-shaped low — often panic-driven or capitulation.
Eve follows: a rounded, more gradual bottom, showing accumulation and stabilisation.
Once price breaks above the neckline, the pattern is considered confirmed.
A retest of the neckline (like LTC at ~$105) is often the best entry point, especially when supported by confluence like Fib levels, VWAP, or key levels.
In LTC’s case, the breakout above $100 and successful retest at $100–$105 validates the pattern — with a measured move pointing toward $150, and a macro Fib target at $198.14 aligning with the $200 psychological level.
Summary:
With a confirmed breakout, strong technical confluence, and clearly defined targets, LTC is setting up for continuation. Watch $120 for long entries and monitor $150 for potential rejection.
_________________________________
💬 If you found this helpful, drop a like and comment!

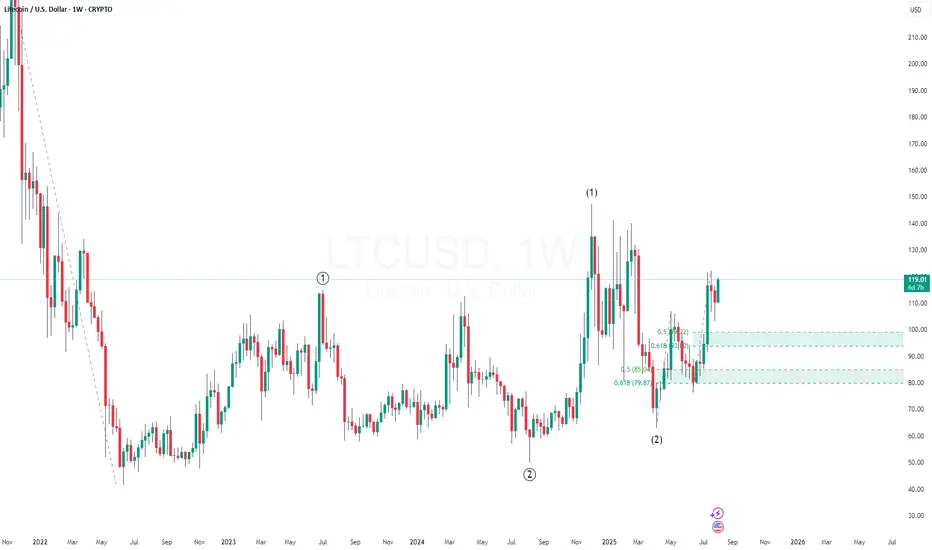
LTC Could Be Gearing Up for a Massive Wave 3 post 1-2, 1-2 Litecoin (LTC) appears to have completed a 1-2, 1-2 wave pattern, a classic bullish setup in Elliott Wave theory that often precedes an explosive move.
This nested formation signals strong internal momentum, where both the higher and lower degree structures are aligned for upside. If the count holds, LTC is now positioned to launch into Wave 3 of the larger Wave 3 — typically the most powerful and extended rally in the entire wave cycle.
Will MEXC hit $12 in this bull run?🚨 NYSE:MX (MEXC) Looks Ready to Explode 🚨
Since 2018, MX has been forming clean HH & HL on the HTF.
Now it's approaching another potential Higher High — and if this plays out…
👉 $12 is on the table.
Structure is king. Bullish momentum is real.
⚠️ Only invalidation? Below $0.77 (CHoCH zone).
So here’s the real question:
Will NYSE:MX hit $12 next… or break the entire bullish structure?
Drop your thoughts 👇
NFA & DYOR

Is Litecoin a free ride to $400?Taking a look at what I believe may be the most undervalued asset in the market as it has broken out of a trend line and is headed towards another test of a monthly level. This level has proven multiple times to be very rewarding. I think this may end up being one of the easiest trades in the market right now.

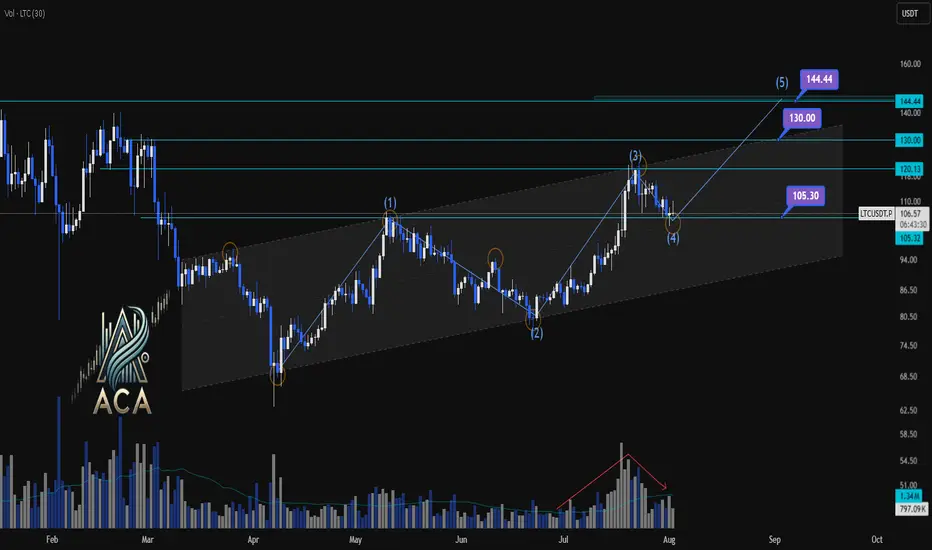
LTCUSDT | Daily Chart Analysis | Bullish Structure UnfoldingLTCUSDT | Daily Chart Analysis | Bullish Structure Unfolding
🔍 Let’s break down LTC/USDT’s technical setup, focusing on volume, Elliot Wave structure, and key target levels for this bullish scenario. If you're following this channel, be sure to react and let us know your thoughts on the roadmap!
⏳ Daily Overview
LTCUSDT is moving within a defined ascending channel, supported by increasing bullish momentum and clear Elliot Wave progression. The recent wave count points to a textbook impulse, setting up the next key move.
🔺 Long Setup:
The market has completed Waves (1) through (4), and we’re now looking at the development of Wave (5) to the upside.
- Wave (5) Target Zones:
- $130.00
- $144.44
These are the next resistance levels based on previous highs and channel dynamics.
- Key support to watch:
- $105.30 — this zone may act as a springboard for the next rally if tested.
📊 Key Highlights:
- Volume has shown a clear bullish divergence as price advances, signaling growing interest and strength heading into Wave (5).
- The bullish channel remains intact, and each dip has been met with higher lows, confirming the ongoing uptrend.
- Elliot Wave structure suggests further upside, with the $130.00 and $144.44 levels as potential targets.
🚨 Conclusion:
LTC bulls should keep an eye on price action as it approaches support at $105.30 — a bounce here could ignite the next leg higher toward our target zones. Reaction from the channel community will be crucial as Wave (5) unfolds. Show your support with a reaction below if you’re riding this wave!
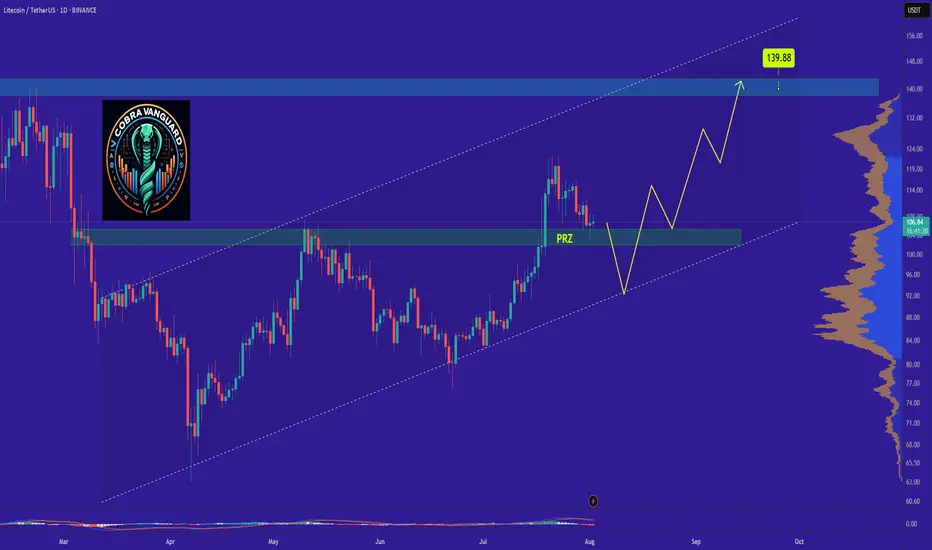
LTCs Situation (Daily) !!!If the price loses the PRZ range, it will drop to the bottom of the channel and then rise to the top of the ascending channel, which will take some time.
Best regards CobraVanguard.💚