EURUSD 1M MA200 rejection kickstarted 1 year Bear Cycle.The EURUSD pair is currently on its 2nd straight red 1M candle following September's rejection near the 1M MA200 (orange trend-line). That level is of the utmost importance as since January 2018 it has kickstarted the last two major Bearish Legs of the 10-year Channel Down.
Both of those legs hit at least the Channel's 0.618 Fibonacci level and on a remarkable display of symmetry, their candles that hit that level completed a -15.25% decline from their respective tops.
As a result, we expect 2026 to be a new Bearish Leg that will could hit at least 1.0300 upon making contact with the 0.618 Fib.
Notice also the excellent Support and Resistance Zones of the 1M RSI. The market hit the Resistance Zone on June's High and since then it's been declining on a Bearish Divergence. Both previous Channel Down tops have been priced when the 1M RSI hit and got rejected on this Resistance Zone.
-------------------------------------------------------------------------------
** Please LIKE 👍, FOLLOW ✅, SHARE 🙌 and COMMENT ✍ if you enjoy this idea! Also share your ideas and charts in the comments section below! This is best way to keep it relevant, support us, keep the content here free and allow the idea to reach as many people as possible. **
-------------------------------------------------------------------------------
💸💸💸💸💸💸
👇 👇 👇 👇 👇 👇
J-USD

AUDUSD Potential DownsidesHey Traders, in today's trading session we are monitoring AUDUSD for a selling opportunity around 0.65300 zone, AUDUSD is trading in a downtrend and currently is in a correction phase in which it is approaching the trend at 0.65300 support and resistance area.
Trade safe, Joe.

AUDUSD Breakout and Potential Retrace!Hey Traders, in today's trading session we are monitoring AUDUSD for a selling opportunity around 0.65800 zone, AUDUSD was trading in an uptrend and currently is in a correction phase in which it is approaching the retrace area at 0.65800 support and resistance area.
Trade safe, Joe.

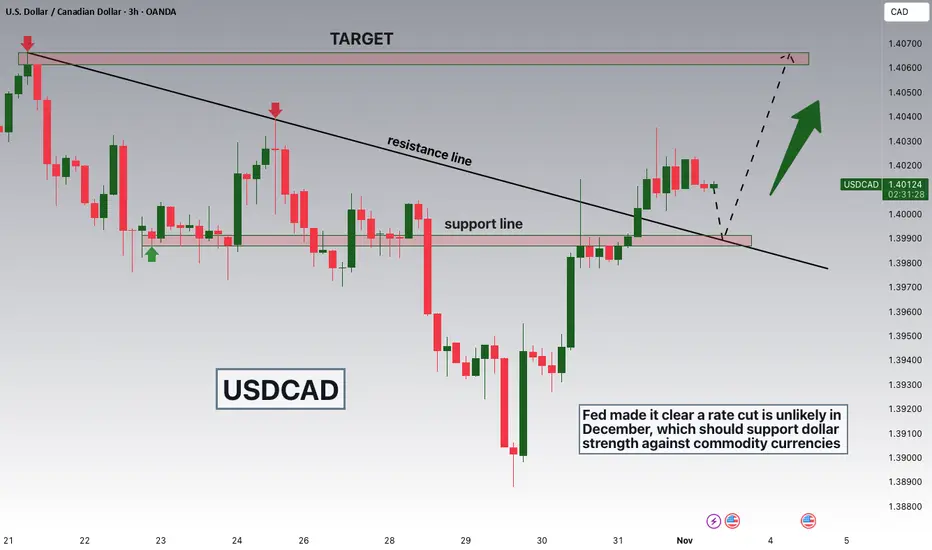
USDCAD Breakout and Potential RetraceHey Traders, in today's trading session we are monitoring USDCAD for a buying opportunity around 1.39900 zone, USDCAD was trading in a downtrend and successfully managed to break it out. Currently is in a correction phase in which it is approaching the retrace area at 1.39900 support and resistance area.
Fundamentally fed made it clear that a rate cut is unlikely in December which should strengthen the dollar against commodity currency!
Trade safe, Joe.
EURUSD Short: Sellers Targeting Move Toward 1.1480 SupportHello traders! EURUSD continues to move within a clear bearish structure after facing strong rejection from the 1.1660 Supply Zone. The pair recently formed a Pivot Point at the top of the Ascending Channel, where a Fake Breakout signaled exhaustion among buyers and triggered renewed selling pressure.After breaking below the Ascending Channel, EURUSD established a new Descending Channel, confirming that sellers have regained momentum. The Supply Line has been well-respected, with each pullback offering another opportunity for sellers to enter the market.
Currently, the price is hovering near the Demand Line, around the 1.1520–1.1500 area, which coincides with a previous pivot zone. While a minor rebound from this level is possible, overall momentum remains bearish as long as price trades below the 1.1600–1.1660 Supply Zone.
From my perspective, EURUSD is likely to continue its downward move toward the 1.1480 Demand Level, aligning with the lower boundary of the current channel. A confirmed breakdown below 1.1480 could open the door for a deeper decline toward 1.1450. However, a strong bullish reaction from this area could lead to a temporary pullback toward 1.1560–1.1580 before the next leg lower. For now, I remain bearish on EURUSD, monitoring potential short setups from the upper channel boundary with a primary target near 1.1480. Manage your risk!

XAUUSD H4 | Bearish Drop OffGold (XAU/USD) has rejected off the sell entry, which is a pullback resistance that lines up with the 23.6% Fibonacci retracement and could drop from this level to the downside.
Sell entry is at 4,017.82, whic his a pullback resistance that lines up witht he 23.6% Fibonacci retracemnt.
Stop loss is at 4,135.96, whic is a pullback resistance that aligns with the 50% Fibonacci retracement.
Take profit is at 3,789.94, which is a pullback support that is slightly above the 61.8% Fibonacci projection.
Stratos Markets Limited (tradu.com ):
CFDs are complex instruments and come with a high risk of losing money rapidly due to leverage. 68% of retail investor accounts lose money when trading CFDs with this provider. You should consider whether you understand how CFDs work and whether you can afford to take the high risk of losing your money.
Stratos Europe Ltd (tradu.com ):
CFDs are complex instruments and come with a high risk of losing money rapidly due to leverage. 70% of retail investor accounts lose money when trading CFDs with this provider. You should consider whether you understand how CFDs work and whether you can afford to take the high risk of losing your money.

USDJPY H4 | Bullish Bounce Off Key SupportUSD/JPY is falling towards the buy entry which is a pullback support that aligns with the 23.6% Fibonacci retracement and could bounce from this levle to the upside.
Buy entry is at 153.25, which is a pullbakc support that aligns with the 23.6% Fibonacci retracement
Stop loss is at 151.99, whic is a pullback support that aligns with the 50% Fibonacci retracement.
Take profit is at 155.83, which aligns with the 161.8% Fibonacci extension.
Stratos Markets Limited (tradu.com ):
CFDs are complex instruments and come with a high risk of losing money rapidly due to leverage. 68% of retail investor accounts lose money when trading CFDs with this provider. You should consider whether you understand how CFDs work and whether you can afford to take the high risk of losing your money.
Stratos Europe Ltd (tradu.com ):
CFDs are complex instruments and come with a high risk of losing money rapidly due to leverage. 70% of retail investor accounts lose money when trading CFDs with this provider. You should consider whether you understand how CFDs work and whether you can afford to take the high risk of losing your money.

USDCHF H4 | Potential Bullilsh ContinuationUSD/CHF has bounced off the buy entry, which is a pullback support that aligns with the 23.6% Fibonacci retracement and could rise from this level to the upside.
Buy entry is at 0.8064, which is a pullback support that aligns with the 23.6% Fibonacci retracement
Stop loss is at 0.8024, which is a pullbakc support that aligns with the 38.2% Fibonacci retracement.
Take profit is at 0.8172, which is a swing high resistance.
Stratos Markets Limited (tradu.com ):
CFDs are complex instruments and come with a high risk of losing money rapidly due to leverage. 68% of retail investor accounts lose money when trading CFDs with this provider. You should consider whether you understand how CFDs work and whether you can afford to take the high risk of losing your money.
Stratos Europe Ltd (tradu.com ):
CFDs are complex instruments and come with a high risk of losing money rapidly due to leverage. 70% of retail investor accounts lose money when trading CFDs with this provider. You should consider whether you understand how CFDs work and whether you can afford to take the high risk of losing your money.

EURUSD H4 | Bearish Momentum In PlayBased on the H4 chart analysis, we can see that the price has reacted off the sell entry, which is a pullback resistance, and could potentially drop from this level to the downside.
Sell entry is at 1.1582, which is a pullback resistance.
Stop loss is at 1.1668, which is a pullback resistance.
Take profit is at 1.1450, which is a pullback support that is slightly above the 78.6% Fibonacci projection.
Stratos Markets Limited (tradu.com ):
CFDs are complex instruments and come with a high risk of losing money rapidly due to leverage. 68% of retail investor accounts lose money when trading CFDs with this provider. You should consider whether you understand how CFDs work and whether you can afford to take the high risk of losing your money.
Stratos Europe Ltd (tradu.com ):
CFDs are complex instruments and come with a high risk of losing money rapidly due to leverage. 70% of retail investor accounts lose money when trading CFDs with this provider. You should consider whether you understand how CFDs work and whether you can afford to take the high risk of losing your money.

USD/JPY Rejection Expected from Key Resistance ZoneThis USD/JPY 1-hour chart shows price approaching a resistance zone around 154.8–155.0. After a recent bullish breakout (BoS), the analysis suggests a potential pullback from this resistance area, with a short-term bearish target around 153.300. The setup implies a possible short trade opportunity if price rejects the resistance zone.

Bullish bounce off?WTI Oil (XTI/USD) has bounced off the pivot, which has been identified as a pullback suport and could potentially rise to the 1st resistance.
Pivot: 60.13
1st Support: 58.86
1st Resistance: 63.19
Disclaimer:
The above opinions given constitute general market commentary, and do not constitute the opinion or advice of IC Markets or any form of personal or investment advice.
Any opinions, news, research, analyses, prices, other information, or links to third-party sites contained on this website are provided on an "as-is" basis, are intended only to be informative, is not an advice nor a recommendation, nor research, or a record of our trading prices, or an offer of, or solicitation for a transaction in any financial instrument and thus should not be treated as such. The information provided does not involve any specific investment objectives, financial situation and needs of any specific person who may receive it. Please be aware, that past performance is not a reliable indicator of future performance and/or results. Past Performance or Forward-looking scenarios based upon the reasonable beliefs of the third-party provider are not a guarantee of future performance. Actual results may differ materially from those anticipated in forward-looking or past performance statements. IC Markets makes no representation or warranty and assumes no liability as to the accuracy or completeness of the information provided, nor any loss arising from any investment based on a recommendation, forecast or any information supplied by any third-party.

Potential bearish drop?The Aussie (AUD/USD) has rejected off the pivot, which is a pullback resistance and could potentially drop to the 1st support, which acts as a pullback suport that aligns with the 61.8% Fibonacci projection.
Pivot: 0.6558
1st Support: 0.6446
1st Resistance: 0.6624
Disclaimer:
The above opinions given constitute general market commentary, and do not constitute the opinion or advice of IC Markets or any form of personal or investment advice.
Any opinions, news, research, analyses, prices, other information, or links to third-party sites contained on this website are provided on an "as-is" basis, are intended only to be informative, is not an advice nor a recommendation, nor research, or a record of our trading prices, or an offer of, or solicitation for a transaction in any financial instrument and thus should not be treated as such. The information provided does not involve any specific investment objectives, financial situation and needs of any specific person who may receive it. Please be aware, that past performance is not a reliable indicator of future performance and/or results. Past Performance or Forward-looking scenarios based upon the reasonable beliefs of the third-party provider are not a guarantee of future performance. Actual results may differ materially from those anticipated in forward-looking or past performance statements. IC Markets makes no representation or warranty and assumes no liability as to the accuracy or completeness of the information provided, nor any loss arising from any investment based on a recommendation, forecast or any information supplied by any third-party.

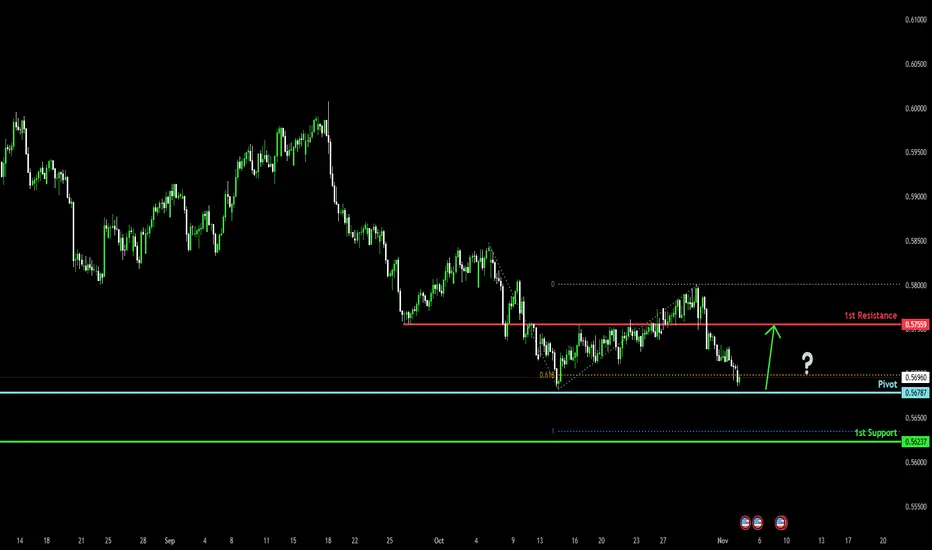
Bullish reversal foff pullback support?The Kiwi (NZD/USD) is falling towards the pivot and could bounce to the 1st resistance.
Pivot: 0.5678
1st Support: 0.5623
1st Resitance: 0.5755
Disclaimer:
The above opinions given constitute general market commentary, and do not constitute the opinion or advice of IC Markets or any form of personal or investment advice.
Any opinions, news, research, analyses, prices, other information, or links to third-party sites contained on this website are provided on an "as-is" basis, are intended only to be informative, is not an advice nor a recommendation, nor research, or a record of our trading prices, or an offer of, or solicitation for a transaction in any financial instrument and thus should not be treated as such. The information provided does not involve any specific investment objectives, financial situation and needs of any specific person who may receive it. Please be aware, that past performance is not a reliable indicator of future performance and/or results. Past Performance or Forward-looking scenarios based upon the reasonable beliefs of the third-party provider are not a guarantee of future performance. Actual results may differ materially from those anticipated in forward-looking or past performance statements. IC Markets makes no representation or warranty and assumes no liability as to the accuracy or completeness of the information provided, nor any loss arising from any investment based on a recommendation, forecast or any information supplied by any third-party.
Potential bearish reversal?USD/JPY is reacting off the pivot, which is a pullback resistance that aligns with the 78.6% Fibonacci projection, and could drop to the 1st support.
Pivot: 154.44
1st Support: 151.94
1st Resistance: 156.08
Disclaimer:
The above opinions given constitute general market commentary, and do not constitute the opinion or advice of IC Markets or any form of personal or investment advice.
Any opinions, news, research, analyses, prices, other information, or links to third-party sites contained on this website are provided on an "as-is" basis, are intended only to be informative, is not an advice nor a recommendation, nor research, or a record of our trading prices, or an offer of, or solicitation for a transaction in any financial instrument and thus should not be treated as such. The information provided does not involve any specific investment objectives, financial situation and needs of any specific person who may receive it. Please be aware, that past performance is not a reliable indicator of future performance and/or results. Past Performance or Forward-looking scenarios based upon the reasonable beliefs of the third-party provider are not a guarantee of future performance. Actual results may differ materially from those anticipated in forward-looking or past performance statements. IC Markets makes no representation or warranty and assumes no liability as to the accuracy or completeness of the information provided, nor any loss arising from any investment based on a recommendation, forecast or any information supplied by any third-party.

Bearish reversal off pullback resistance?The Swissie (USD/CHF) is rising towards the pivot that aligns witht he 127.2% Fibonacci extension and could reverse to the 1st support.
Pivot: 0.8125
1st Support: 0.8014
1st Resistance: 0.8219
Disclaimer:
The above opinions given constitute general market commentary, and do not constitute the opinion or advice of IC Markets or any form of personal or investment advice.
Any opinions, news, research, analyses, prices, other information, or links to third-party sites contained on this website are provided on an "as-is" basis, are intended only to be informative, is not an advice nor a recommendation, nor research, or a record of our trading prices, or an offer of, or solicitation for a transaction in any financial instrument and thus should not be treated as such. The information provided does not involve any specific investment objectives, financial situation and needs of any specific person who may receive it. Please be aware, that past performance is not a reliable indicator of future performance and/or results. Past Performance or Forward-looking scenarios based upon the reasonable beliefs of the third-party provider are not a guarantee of future performance. Actual results may differ materially from those anticipated in forward-looking or past performance statements. IC Markets makes no representation or warranty and assumes no liability as to the accuracy or completeness of the information provided, nor any loss arising from any investment based on a recommendation, forecast or any information supplied by any third-party.

Could we see a bullish reversal on the Cable?The price is falling towards the pivot and could bounce to the 1st resistance which acts as a pullback resistance.
Pivot: 1.3049
1st Support: 1.2956
1st Resistance: 1.3293
Disclaimer:
The above opinions given constitute general market commentary, and do not constitute the opinion or advice of IC Markets or any form of personal or investment advice.
Any opinions, news, research, analyses, prices, other information, or links to third-party sites contained on this website are provided on an "as-is" basis, are intended only to be informative, is not an advice nor a recommendation, nor research, or a record of our trading prices, or an offer of, or solicitation for a transaction in any financial instrument and thus should not be treated as such. The information provided does not involve any specific investment objectives, financial situation and needs of any specific person who may receive it. Please be aware, that past performance is not a reliable indicator of future performance and/or results. Past Performance or Forward-looking scenarios based upon the reasonable beliefs of the third-party provider are not a guarantee of future performance. Actual results may differ materially from those anticipated in forward-looking or past performance statements. IC Markets makes no representation or warranty and assumes no liability as to the accuracy or completeness of the information provided, nor any loss arising from any investment based on a recommendation, forecast or any information supplied by any third-party.

Bullish reversal?The Fiber (EUR/USD) is falling towards the pivot, which is a pullback support and could bounce to the 1st resistance.
Pivot: 1.1453
1st Support: 1.1371
1st Resistance: 1.1558
Disclaimer:
The above opinions given constitute general market commentary, and do not constitute the opinion or advice of IC Markets or any form of personal or investment advice.
Any opinions, news, research, analyses, prices, other information, or links to third-party sites contained on this website are provided on an "as-is" basis, are intended only to be informative, is not an advice nor a recommendation, nor research, or a record of our trading prices, or an offer of, or solicitation for a transaction in any financial instrument and thus should not be treated as such. The information provided does not involve any specific investment objectives, financial situation and needs of any specific person who may receive it. Please be aware, that past performance is not a reliable indicator of future performance and/or results. Past Performance or Forward-looking scenarios based upon the reasonable beliefs of the third-party provider are not a guarantee of future performance. Actual results may differ materially from those anticipated in forward-looking or past performance statements. IC Markets makes no representation or warranty and assumes no liability as to the accuracy or completeness of the information provided, nor any loss arising from any investment based on a recommendation, forecast or any information supplied by any third-party.

Potential bearish drop?EUR/GBP is reacting off the resistance level, which is a pullback resistance and could drop from this level to our take profit.
Entry: 0.8784
Why we like it:
There is a pullback resistance level.
Stop loss: 0.8816
Why we like it:
There is a multi-swing high resistance level.
Take profit: 0.8743
Why we like it:
There is a pullback support that is slightly above the 50% Fibonacci retracement.
Enjoying your TradingView experience? Review us!
Please be advised that the information presented on TradingView is provided to Vantage (‘Vantage Global Limited’, ‘we’) by a third-party provider (‘Everest Fortune Group’). Please be reminded that you are solely responsible for the trading decisions on your account. There is a very high degree of risk involved in trading. Any information and/or content is intended entirely for research, educational and informational purposes only and does not constitute investment or consultation advice or investment strategy. The information is not tailored to the investment needs of any specific person and therefore does not involve a consideration of any of the investment objectives, financial situation or needs of any viewer that may receive it. Kindly also note that past performance is not a reliable indicator of future results. Actual results may differ materially from those anticipated in forward-looking or past performance statements. We assume no liability as to the accuracy or completeness of any of the information and/or content provided herein and the Company cannot be held responsible for any omission, mistake nor for any loss or damage including without limitation to any loss of profit which may arise from reliance on any information supplied by Everest Fortune Group.

DXY Has 99 Problems, Getting Above 100 Is One!Here we have TVC:DXY on the Weekly Chart.
Now clearly outlined we can see there is a very valuable level here @ 99-100 that the USD:
- Used as Resistance from 2015 til the Bullish Breakout in April 2020
- Used as Support from 2023 til the Bearish Breakdown in April 2025
Fundamentally is a very sketchy scenario because with the Shutdown causing lack of important data needed, The Federal Reserve is making Interest Rate cuts. This weakens the Dollar because it makes it less favorable to Foreign Investing.
On the flip side, Consumers Dollars are able to stretch further allowing them to purchase more but unfortunately we still combat the inflated prices on goods. Companies have the ability to get there raw ingredients cheaper, resume hiring processes, etc.
The slow creeping rise in Inflation has the Federal Reserve in a position to want to be ready to potentially Hike Rates when the Inflation, they believe, from the Tariffs will hit but as of yet, the recent CPI numbers came out not as hot as they thought, possibly playing into the reason for making the latest cut.
Nevertheless, by the last FOMC meeting, it would seem that there is a chance that was the last cut this year that may be made, if:
- Inflation continues to rise
or
- Continued softening labor market

EURUSD - Preparing for the Next Wave of Bearish Momentum!🏹EURUSD remains trapped within a well-defined descending channel, with the market structure clearly favoring the bears.
Each rally has been met with selling pressure, forming a series of lower highs and lower lows, a textbook example of controlled downside continuation.
⚔️As price approaches the confluence zone, where the upper red trendline meets the horizontal structure around 1.1680–1.1700, I’ll be looking for potential trend-following short setups. This intersection has acted as a strong rejection point in previous moves, and it remains a key decision zone for sellers to step back in.
If rejection confirms there, the next leg lower could retest the 1.1550, then 1.1500 support areas.
On the flip side, a daily close above 1.1720 would be the first sign of a possible short-term shift in sentiment.
Until proven otherwise, the trend is clear — rallies are for selling.
⚠️ Disclaimer: This is not financial advice. Always do your own research and manage risk properly.
📚All Strategies Are Good; If Managed Properly!
~Richard Nasr

EUR/USD: Classic Breakout Trade - Don't Miss the Move!The 📉EURUSD pair experienced a decisive breakout and closed below a significant daily/intraday horizontal support cluster on Friday.
Following this breakout, the pair started to consolidate on an hourly timeframe, on the previously breached structure.
The bearish violation of this consolidation serves as a strong bearish confirmation.
Conversely, the price is projected to continue its downward trajectory, with a likely target of at least 1.1500.

EURUSD: Bounce from Support Could Trigger Move Toward 1.1640Hello everyone, here is my breakdown of the current Euro setup.
Market Analysis
EURUSD has been trading in a corrective phase after breaking down from the Upward Channel that previously guided its bullish movement. The pair formed a Range near the 1.1760 Resistance Area, showing consolidation before sellers regained control. Multiple Breakouts confirmed shifts in market structure — first to the upside within the channel, and later to the downside, signaling the transition from bullish to neutral-bearish momentum.
Recently, price found strong demand within the 1.1550–1.1560 Support Zone, which aligns with the Triangle Support Line. This level has been tested multiple times, acting as a significant pivot point for potential bullish reactions. The Triangle Resistance Line above continues to limit upward movement, forming a contracting structure that reflects growing pressure from both sides.
My Scenario & Strategy
From my view, EURUSD is currently setting up for a possible bullish rebound from the support zone near 1.1560. If buyers defend this level, the price could rise toward the Triangle Resistance Line around 1.1630–1.1640. A confirmed breakout above this resistance could open the way toward the key 1.1760 Resistance Zone, signaling a shift in sentiment back to bullish.
However, if the pair fails to hold above the Triangle Support Line, a breakdown could trigger a deeper decline toward 1.1500. For now, I maintain a short-term bullish bias, looking for long opportunities near support with clear confirmation signals.
That's the setup I'm tracking. Thank you for your attention, and always manage your risk.

EURUSD: Bearish Channel Continuation SetupHi guys!
The EURUSD pair continues to trade within a well-defined descending channel. This confirms that the broader market structure remains bearish.
Important Levels
Resistance Zone: 1.1535 – 1.1550
Resistance Line: Aligns with the top of the highlighted resistance zone and channel structure.
Support Zone: Around 1.1517
Market Context
Recently, the pair formed a bearish flag or pennant pattern following a sharp downward move, suggesting that sellers remain in control. The price has since retested the resistance zone, where bearish pressure is expected to re-emerge.
Trading Outlook
Bearish Scenario (Primary Bias):
If the price fails to break above 1.1578, the bias remains bearish. A rejection from this zone could trigger a continuation move toward 1.1517 and potentially extend lower along the channel’s bottom boundary.
Bullish Scenario (Alternative):
A clear breakout and close above the resistance zone and channel midpoint would invalidate the short-term bearish setup. I
Disclaimer: As part of ThinkMarkets’ Influencer Program, I am sponsored to share and publish their charts in my analysis.
