EURUSD Last chance to maintain the long-term bullish trend.The EURUSD pair has been trading within a Channel Up since the April 21 High and today it came to the closest its been to the 1D MA100 (green trend-line). That is the trend-line that formed its last Higher Low on August 01.
As long as it holds, we expect a rebound, targeting at least Resistance 1 at 1.19190. A 1D candle close below it though, would be the first strong sign of a potential long-term bearish reversal on the market, targeting Support 2 and a potential contact with the 1D MA200 (orange trend-line) at 1.13905.
The fact that the price is so close to the 1D MA100 makes it perfect for a tight SL strategy implementation on either case.
-------------------------------------------------------------------------------
** Please LIKE 👍, FOLLOW ✅, SHARE 🙌 and COMMENT ✍ if you enjoy this idea! Also share your ideas and charts in the comments section below! This is best way to keep it relevant, support us, keep the content here free and allow the idea to reach as many people as possible. **
-------------------------------------------------------------------------------
💸💸💸💸💸💸
👇 👇 👇 👇 👇 👇
J-USD

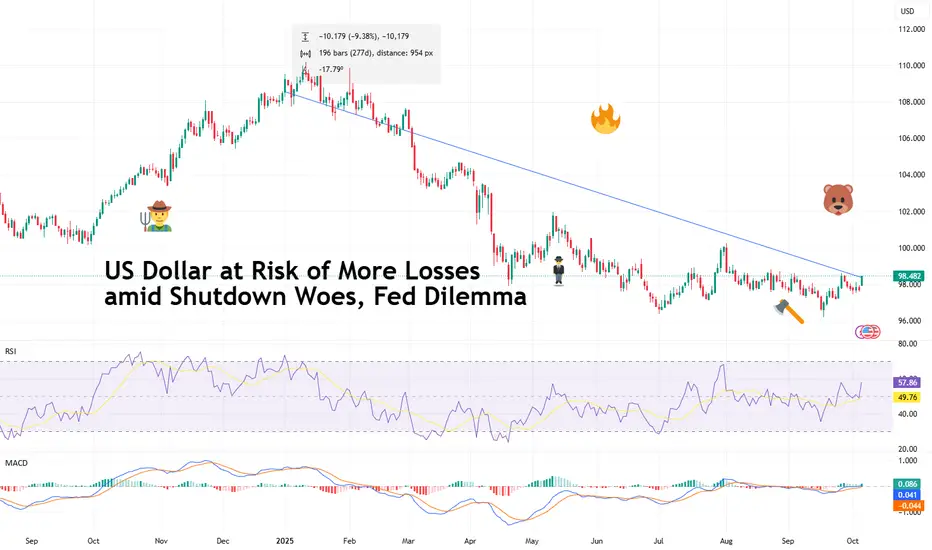
US Dollar at Risk of More Losses amid Shutdown Woes, Fed DilemmaThe US dollar TVC:DXY has been knocked by last week’s US government shutdown and the subsequent economic blackout. At the same time, the Federal Reserve can’t figure out what’s worse – inflation or job crunch.
After Congress failed to pass a funding bill, the government officially went dark at 12:01 a.m. Wednesday.
Traders, however, didn’t panic. Stocks climbed to fresh record highs , gold OANDA:XAUUSD popped, yields dipped — and the dollar slipped further into the red .
The greenback, usually the go-to safe haven during global turmoil, is acting like it forgot about that job description. With the Federal Reserve cornered between a slowing economy and stubborn inflation, plus fresh political uncertainty in D.C., the dollar’s shine is fading fast.
⚖️ When Politics and Policy Collide
Let’s start with the elephant in the room: the government shutdown. Historically, these dark D.C. moments shave about a tenth of a percentage point off GDP per week. In other words, the economy loses a few hairs — not a limb. But this one hits differently.
That’s because the Fed is already walking a tightrope. With unemployment creeping up ( 4.3% in August and lost jobs in June ) and inflation still running at 2.9% , the central bank has little margin for error.
The longer the shutdown drags on, the harder it becomes for policymakers to parse what’s real economic weakness and what’s just delayed government paychecks.
Investors, meanwhile, are pricing in a full quarter-point rate cut at the Fed’s next meeting and another one in December. The market is betting that Powell & Co. will prioritize saving jobs over fighting inflation. And that typically means one thing: a softer dollar.
📉 The Dollar’s Safe-Haven Cred Takes a Hit
Remember when the dollar used to rally whenever things got messy? Not this year. Despite trade tensions, geopolitical flare-ups, and now a full-blown government shutdown, the dollar has lost roughly 10% since January.
Part of that weakness stems from shifting interest-rate expectations. When the Fed signals it’s going to cut, yields on US assets drop — and so does the appeal of holding dollars.
Lower rates make borrowing cheaper, but they also mean less income for investors parking money in dollar-denominated bonds.
The euro took advantage, climbing above $1.17 as traders rotated out of the greenback.
Gold also basked in the dollar’s weakness, closing Friday at $3,886 an ounce — a fresh all-time closing high.
And just to rub salt in the wound, even cryptocurrencies have outperformed. Bitcoin BITSTAMP:BTCUSD , the digital rebel of finance, has gained about 35% this year and on Sunday hit a record high above $125,000 per coin.
🧩 Fed Dilemma: Jobs vs. Inflation
The Federal Reserve’s dual mandate is simple on paper: keep prices stable and employment high. But right now, the two goals are in open conflict.
On the one hand, the labor market is clearly slowing. August brought just 22,000 new jobs — the weakest print since early 2020. Revised data for June showed the economy actually lost 13,000 staffers net. Those aren’t the kinds of numbers that inspire confidence.
On the other side, inflation is still running above target. Core PCE, the Fed’s favorite measure, clocked in at 2.9% in August — unchanged from July but still nearly a full percentage point above the goal.
So what’s the play? Cut rates to support jobs and risk stoking inflation? Or hold firm, keep inflation contained, and risk a deeper slowdown? That’s the central banker’s version of “Would you rather.”
👀 The Fed’s Independence (and the Trump Factor)
There’s another layer of intrigue: politics. The Supreme Court just deferred a hearing on President Trump’s attempt to remove Fed Governor Lisa Cook — a Biden appointee — until January.
Cook can remain at the Fed in the meantime, but the episode has traders questioning just how independent the central bank really is under the new administration.
Fed Chair Jerome Powell, nearing the end of his term, has been caught between maintaining credibility and avoiding direct political confrontation. His latest move — a quarter-point rate cut in September — was meant to show responsiveness to data, not pressure. But optics matter, and the market is watching for signs of interference.
If investors start believing the Fed is bending to political will, confidence in US monetary policy could erode further — another potential strike against the dollar.
💡 What It Means for Traders
Here’s the breakdown:
• For FX traders: The dollar remains vulnerable, especially if the Fed confirms more cuts are on the way. Pairs like FX:EURUSD and FX:GBPUSD could see more upside. Meanwhile, FX:USDJPY might stay volatile as yen buyers return to their comfort zone.
• For gold bulls: Lower yields and a weaker dollar create the perfect storm. Gold looks strong despite charting new horizons, though traders should watch for a potential pullback if the Fed’s tone shifts.
• For equity investors: Rate cuts are generally bullish. Cheaper money means higher valuations — at least until inflation becomes a problem again.
• For crypto enthusiasts: A dovish Fed tends to favor risk assets, and Bitcoin could benefit as a hedge against both inflation and institutional confusion.
🧮 The Shutdown Math: Small Impact, Big Symbolism
Economists will tell you that a shutdown doesn’t tank the economy — but it does rattle sentiment. Each week of a federal closure trims GDP growth by about 0.1 percentage point. If this one matches the 35-day record from 2018–19 (during Trump’s first term), we’re looking at a 0.5% haircut. Manageable, but not ideal when the economy’s already wobbling.
More concerning is what a prolonged shutdown means for data flow. If key reports like nonfarm payrolls ECONOMICS:USNFP or CPI ECONOMICS:USCPI get delayed, the Fed will be in the dark heading into its next meeting — and that’s when mistakes happen.
Markets hate uncertainty, and uncertainty is the shutdown’s main export.
🧭 The Road Ahead
The dollar’s trajectory from here depends on whether the Fed can strike the right balance. If Powell emphasizes employment and doubles down on cuts, you may expect the greenback to weaken further. But if inflation surprises to the upside, markets could quickly reverse their dovish bets.
Make sure to keep an eye on the Economic calendar . September’s inflation hits October 15 and the Fed’s meeting is on deck for October 28-29.
Off to you : Where do you see the dollar by year end? Share your thoughts in the comment section!
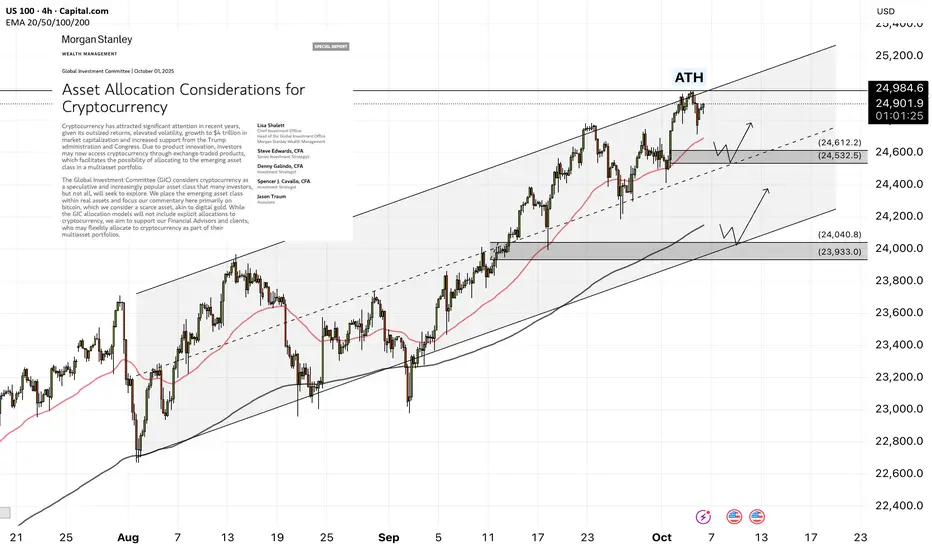
NAS100 - Stock Market on Federal Holiday!The index is above the EMA200 and EMA50 on the four-hour time frame and is in its long-term ascending channel. If the upward momentum decreases, we can expect a correction to the demand zones and buy Nasdaq in that range with an appropriate reward for the risk.
Traders in prediction markets now estimate that the U.S. federal government shutdown could last more than a week and potentially extend into mid-October. These projections suggest that Washington’s political environment has reached a deadlock, making a swift agreement in Congress increasingly unlikely.
The shutdown began early Wednesday morning after Democrats and Republicans—along with President Donald Trump—failed to reach a compromise on a temporary funding bill. As a result, hundreds of thousands of federal employees have been placed on unpaid leave, and numerous government programs and public services have been suspended.
According to data from Bank of America, since 1990, U.S. government shutdowns have lasted an average of 14 days. Although the S&P 500 has typically risen about 1% during such periods, an extended impasse could weigh heavily on an already fragile economy and markets near record highs.
The credit rating agency Fitch stated that the current shutdown will not have a direct impact on the United States’ credit rating, which remains at AA+ with a stable outlook. However, the agency noted that repeated reliance on short-term funding resolutions reflects persistent weaknesses in U.S. fiscal governance. Still, Fitch expects the U.S. dollar’s status as the world’s reserve currency to remain intact in the near future.
Fitch also added that a short-lived shutdown is unlikely to affect most public-finance credits, though a prolonged one could pose negative risks for bond issuers—particularly those dependent on federal funding in areas such as healthcare, housing, and higher education.
Meanwhile, UBS argued that concerns over the U.S. government shutdown have been overstated, predicting that its economic impact will be limited and short-lived. The bank advised investors to look beyond political noise and instead focus on Federal Reserve rate cuts, corporate earnings, and opportunities in artificial intelligence.
Economists at Citi expect the Federal Reserve to implement two 25-basis-point rate cuts in October and December, in line with its Dot Plot projections. However, the shutdown could delay access to key labor and inflation data, forcing investors to rely more heavily on private sources such as ADP reports.
Similarly, Bank of America forecasts a rate cut in October but notes that markets have already priced in this outcome, assigning a 95% probability for October and 85% for December. In essence, this projection merely aligns with the consensus that has already formed among traders.
In actual market developments, expectations have shifted back toward easing policies. Over the past two weeks, the hawkish pressure that had supported the dollar has eased, and markets are once again pricing in a lower-rate trajectory. Currently, about 105 basis points of rate cuts are priced in for next year, compared with a previous low of 94 basis points—a shift that favors equities while weighing on the dollar.
According to Daniel Pavilonis, senior commodities broker at RJO Futures, the government shutdown will not significantly impair the Fed’s ability to assess labor market conditions. “The Fed relies more on its proprietary datasets than on official government statistics,” he explained. “Even amid a shutdown, policymakers maintain a fairly accurate picture of the economy.”
After a week dominated by employment data—some released and others delayed due to the shutdown—the upcoming week is expected to be relatively quiet for official U.S. economic releases unless a resolution is reached.Instead, market attention will pivot toward remarks from Federal Reserve officials.
On Wednesday, the minutes of the September FOMC meeting will be released, offering deeper insight into policymakers’ views on the rate path and inflation risks. Then, on Friday, the University of Michigan’s preliminary Consumer Sentiment Index for October will shed light on household perceptions of the economy and their financial conditions—a key gauge for domestic demand strength.
In addition, investors will closely monitor speeches from several Fed officials, including Bostic, Bowman, Miran, Kashkari, Barr, and Musalem. Their comments could directly influence market expectations for monetary policy and shape trading sentiment in the days ahead.
USDJPY - Range Floor + Trend Support = ConfluenceUSDJPY remains overall bullish within a rising channel, while price has been ranging between a lower demand band and the upper supply.
We’re now dipping into the 146.0–146.7 support area, which aligns with the channel’s lower boundary — a classic confluence zone to hunt for longs.
🔑 Key levels
Support: 146.0–146.7 (range floor + channel support)
Resistance: 149.8–151.0 (range top / supply)
📊 Scenarios
Bullish 📈 Look for a higher-low / bullish candle from 146s → path toward 149.8–151.0.
Bearish 📉 Daily close below 146.0 would invalidate the setup and open a deeper pullback before buyers try again.
Do you buy the retest into the 146s, or wait for momentum to kick in first? 🤔
⚠️ Disclaimer: This is not financial advice. Always do your own research and manage risk properly.
📚 Stick to your trading plan regarding entries, risk, and management.
Good luck! 🍀
All Strategies Are Good; If Managed Properly!
~Richard Nasr

XAGUSD H1 | Potential Bullish Continuation AheadXAG/USD is falling towards the buy entry which is a pullback support that aligns withthe 38.2% Fibonacci retracement and could bounce from this level to the upside.
Buy entry is at 47.61, which is a pullback support that aligns with the 38.2% Fibonacci retracement.
Stop loss is at 46.74, which is a pullback support that is slightly above the 78.6% Fibonacci retracement.
Take profit is at 49.46, which is aligns with the 161.8% Fibonacci extension.
High Risk Investment Warning
Trading Forex/CFDs on margin carries a high level of risk and may not be suitable for all investors. Leverage can work against you.
Stratos Markets Limited (tradu.com/uk ):
CFDs are complex instruments and come with a high risk of losing money rapidly due to leverage. 65% of retail investor accounts lose money when trading CFDs with this provider. You should consider whether you understand how CFDs work and whether you can afford to take the high risk of losing your money.
Stratos Europe Ltd (tradu.com/eu ):
CFDs are complex instruments and come with a high risk of losing money rapidly due to leverage. 66% of retail investor accounts lose money when trading CFDs with this provider. You should consider whether you understand how CFDs work and whether you can afford to take the high risk of losing your money.
Stratos Global LLC (tradu.com/en ):
Losses can exceed deposits.
Please be advised that the information presented on TradingView is provided to Tradu (‘Company’, ‘we’) by a third-party provider (‘TFA Global Pte Ltd’). Please be reminded that you are solely responsible for the trading decisions on your account. There is a very high degree of risk involved in trading. Any information and/or content is intended entirely for research, educational and informational purposes only and does not constitute investment or consultation advice or investment strategy. The information is not tailored to the investment needs of any specific person and therefore does not involve a consideration of any of the investment objectives, financial situation or needs of any viewer that may receive it. Kindly also note that past performance is not a reliable indicator of future results. Actual results may differ materially from those anticipated in forward-looking or past performance statements. We assume no liability as to the accuracy or completeness of any of the information and/or content provided herein and the Company cannot be held responsible for any omission, mistake nor for any loss or damage including without limitation to any loss of profit which may arise from reliance on any information supplied by TFA Global Pte Ltd.
The speaker(s) is neither an employee, agent nor representative of Tradu and is therefore acting independently. The opinions given are their own, constitute general market commentary, and do not constitute the opinion or advice of Tradu or any form of personal or investment advice. Tradu neither endorses nor guarantees offerings of third-party speakers, nor is Tradu responsible for the content, veracity or opinions of third-party speakers, presenters or participants.

GOLD H1 | Bullish ContinuationBased on the H1 chart analysis, we could see the price fall to the buy entry at 3,894.11, which is a pullback support that aligns with the 38.2% Fibonacci retracement and could bounce from this level to the upside.
Stop loss is at 3,853.38, which is a pullback support that is slightly above the 78.6% Fibonacci retracement.
Take profit is at 3,946.56, which is a pullback resistance.
High Risk Investment Warning
Trading Forex/CFDs on margin carries a high level of risk and may not be suitable for all investors. Leverage can work against you.
Stratos Markets Limited (tradu.com ):
CFDs are complex instruments and come with a high risk of losing money rapidly due to leverage. 65% of retail investor accounts lose money when trading CFDs with this provider. You should consider whether you understand how CFDs work and whether you can afford to take the high risk of losing your money.
Stratos Europe Ltd (tradu.com ):
CFDs are complex instruments and come with a high risk of losing money rapidly due to leverage. 66% of retail investor accounts lose money when trading CFDs with this provider. You should consider whether you understand how CFDs work and whether you can afford to take the high risk of losing your money.
Stratos Global LLC (tradu.com ):
Losses can exceed deposits.
Please be advised that the information presented on TradingView is provided to Tradu (‘Company’, ‘we’) by a third-party provider (‘TFA Global Pte Ltd’). Please be reminded that you are solely responsible for the trading decisions on your account. There is a very high degree of risk involved in trading. Any information and/or content is intended entirely for research, educational and informational purposes only and does not constitute investment or consultation advice or investment strategy. The information is not tailored to the investment needs of any specific person and therefore does not involve a consideration of any of the investment objectives, financial situation or needs of any viewer that may receive it. Kindly also note that past performance is not a reliable indicator of future results. Actual results may differ materially from those anticipated in forward-looking or past performance statements. We assume no liability as to the accuracy or completeness of any of the information and/or content provided herein and the Company cannot be held responsible for any omission, mistake nor for any loss or damage including without limitation to any loss of profit which may arise from reliance on any information supplied by TFA Global Pte Ltd.
The speaker(s) is neither an employee, agent nor representative of Tradu and is therefore acting independently. The opinions given are their own, constitute general market commentary, and do not constitute the opinion or advice of Tradu or any form of personal or investment advice. Tradu neither endorses nor guarantees offerings of third-party speakers, nor is Tradu responsible for the content, veracity or opinions of third-party speakers, presenters or participants.

NZDUSD H1 | Signs of a Bearish ReversalNZD/USD has rejected off the sell entry, which acts as a multi-swing high resistance and could drop from this level to the downside.
Sell entry is at 0.5839, which is a multi-swing high resistance.
Stop loss is at 0.5869, which is a multi swing high resistance that aligns with the 78.6% Fibonacci projection.
Take profit is at 0.5806, which is an overlap support.
High Risk Investment Warning
Trading Forex/CFDs on margin carries a high level of risk and may not be suitable for all investors. Leverage can work against you.
Stratos Markets Limited (tradu.com ):
CFDs are complex instruments and come with a high risk of losing money rapidly due to leverage. 65% of retail investor accounts lose money when trading CFDs with this provider. You should consider whether you understand how CFDs work and whether you can afford to take the high risk of losing your money.
Stratos Europe Ltd (tradu.com ):
CFDs are complex instruments and come with a high risk of losing money rapidly due to leverage. 66% of retail investor accounts lose money when trading CFDs with this provider. You should consider whether you understand how CFDs work and whether you can afford to take the high risk of losing your money.
Stratos Global LLC (tradu.com ):
Losses can exceed deposits.
Please be advised that the information presented on TradingView is provided to Tradu (‘Company’, ‘we’) by a third-party provider (‘TFA Global Pte Ltd’). Please be reminded that you are solely responsible for the trading decisions on your account. There is a very high degree of risk involved in trading. Any information and/or content is intended entirely for research, educational and informational purposes only and does not constitute investment or consultation advice or investment strategy. The information is not tailored to the investment needs of any specific person and therefore does not involve a consideration of any of the investment objectives, financial situation or needs of any viewer that may receive it. Kindly also note that past performance is not a reliable indicator of future results. Actual results may differ materially from those anticipated in forward-looking or past performance statements. We assume no liability as to the accuracy or completeness of any of the information and/or content provided herein and the Company cannot be held responsible for any omission, mistake nor for any loss or damage including without limitation to any loss of profit which may arise from reliance on any information supplied by TFA Global Pte Ltd.
The speaker(s) is neither an employee, agent nor representative of Tradu and is therefore acting independently. The opinions given are their own, constitute general market commentary, and do not constitute the opinion or advice of Tradu or any form of personal or investment advice. Tradu neither endorses nor guarantees offerings of third-party speakers, nor is Tradu responsible for the content, veracity or opinions of third-party speakers, presenters or participants.

AUDUSD H1 | Bearish Drop Confirmation onAUD/USD has rejected off the sell entry, which is a pullback resistance and could drop from this level to the take profit.
Sell entry is at 0.6606, which is a pullback resistance.
Stop loss is at 0.6627, which is a pullback resistance that lines up with the 127.2% Fibonacci extension.
Take profit is at 0.6581, which is a pullback support.
High Risk Investment Warning
Trading Forex/CFDs on margin carries a high level of risk and may not be suitable for all investors. Leverage can work against you.
Stratos Markets Limited (tradu.com ):
CFDs are complex instruments and come with a high risk of losing money rapidly due to leverage. 65% of retail investor accounts lose money when trading CFDs with this provider. You should consider whether you understand how CFDs work and whether you can afford to take the high risk of losing your money.
Stratos Europe Ltd (tradu.com ):
CFDs are complex instruments and come with a high risk of losing money rapidly due to leverage. 66% of retail investor accounts lose money when trading CFDs with this provider. You should consider whether you understand how CFDs work and whether you can afford to take the high risk of losing your money.
Stratos Global LLC (tradu.com ):
Losses can exceed deposits.
Please be advised that the information presented on TradingView is provided to Tradu (‘Company’, ‘we’) by a third-party provider (‘TFA Global Pte Ltd’). Please be reminded that you are solely responsible for the trading decisions on your account. There is a very high degree of risk involved in trading. Any information and/or content is intended entirely for research, educational and informational purposes only and does not constitute investment or consultation advice or investment strategy. The information is not tailored to the investment needs of any specific person and therefore does not involve a consideration of any of the investment objectives, financial situation or needs of any viewer that may receive it. Kindly also note that past performance is not a reliable indicator of future results. Actual results may differ materially from those anticipated in forward-looking or past performance statements. We assume no liability as to the accuracy or completeness of any of the information and/or content provided herein and the Company cannot be held responsible for any omission, mistake nor for any loss or damage including without limitation to any loss of profit which may arise from reliance on any information supplied by TFA Global Pte Ltd.
The speaker(s) is neither an employee, agent nor representative of Tradu and is therefore acting independently. The opinions given are their own, constitute general market commentary, and do not constitute the opinion or advice of Tradu or any form of personal or investment advice. Tradu neither endorses nor guarantees offerings of third-party speakers, nor is Tradu responsible for the content, veracity or opinions of third-party speakers, presenters or participants.

EURUSD M30 | Price Signals a Bearish Drop After RejectionEUR/USD has rejected off the sell entry, which is a pullback resistance that aligns with the 50% Fibonacci retracement and could drop from his level to the downside.
Sell entry is at 1.1732, which is a pullback resistance that aligns with the 50% Fibonacci retracement.
Stop loss is at 1.1757, which is a multi-swing high resistance.
Take profit is at 1.1688, which is a pullback support.
High Risk Investment Warning
Trading Forex/CFDs on margin carries a high level of risk and may not be suitable for all investors. Leverage can work against you.
Stratos Markets Limited (tradu.com ):
CFDs are complex instruments and come with a high risk of losing money rapidly due to leverage. 65% of retail investor accounts lose money when trading CFDs with this provider. You should consider whether you understand how CFDs work and whether you can afford to take the high risk of losing your money.
Stratos Europe Ltd (tradu.com ):
CFDs are complex instruments and come with a high risk of losing money rapidly due to leverage. 66% of retail investor accounts lose money when trading CFDs with this provider. You should consider whether you understand how CFDs work and whether you can afford to take the high risk of losing your money.
Stratos Global LLC (tradu.com):
Losses can exceed deposits.
Please be advised that the information presented on TradingView is provided to Tradu (‘Company’, ‘we’) by a third-party provider (‘TFA Global Pte Ltd’). Please be reminded that you are solely responsible for the trading decisions on your account. There is a very high degree of risk involved in trading. Any information and/or content is intended entirely for research, educational and informational purposes only and does not constitute investment or consultation advice or investment strategy. The information is not tailored to the investment needs of any specific person and therefore does not involve a consideration of any of the investment objectives, financial situation or needs of any viewer that may receive it. Kindly also note that past performance is not a reliable indicator of future results. Actual results may differ materially from those anticipated in forward-looking or past performance statements. We assume no liability as to the accuracy or completeness of any of the information and/or content provided herein and the Company cannot be held responsible for any omission, mistake nor for any loss or damage including without limitation to any loss of profit which may arise from reliance on any information supplied by TFA Global Pte Ltd.
The speaker(s) is neither an employee, agent nor representative of Tradu and is therefore acting independently. The opinions given are their own, constitute general market commentary, and do not constitute the opinion or advice of Tradu or any form of personal or investment advice. Tradu neither endorses nor guarantees offerings of third-party speakers, nor is Tradu responsible for the content, veracity or opinions of third-party speakers, presenters or participants.

Strategic Buy Zones on My USDJPY 4H Analysis | Trader Tilki📊 USDJPY 4H Analysis: Buy Setup
Hello Guys,
Here’s my 4-hour USDJPY analysis for you.
These are the exact buy levels I’ll be watching:
🔵 1st BUY level: 147.018
🔵 2nd BUY level: 146.347
🔴 Stop level: 145.509 (or adjust based on your own margin)
🟢 Target level: 150.019
Risk-to-reward ratio on this setup: 2.02
If USDJPY reaches these levels, I’ll definitely take a buy position.
Every like is my biggest motivation to keep sharing these analyses.
Thanks to everyone supporting me!

Bullish bounce off?USD/JPY is falling towards the pivot and could bounce to the 1st resistance, which acts as an overlap resistance.
Pivot: 145.27
1st Support: 143.29
1st Resistance: 151.15
Disclaimer:
The above opinions given constitute general market commentary, and do not constitute the opinion or advice of IC Markets or any form of personal or investment advice.
Any opinions, news, research, analyses, prices, other information, or links to third-party sites contained on this website are provided on an "as-is" basis, are intended only to be informative, is not an advice nor a recommendation, nor research, or a record of our trading prices, or an offer of, or solicitation for a transaction in any financial instrument and thus should not be treated as such. The information provided does not involve any specific investment objectives, financial situation and needs of any specific person who may receive it. Please be aware, that past performance is not a reliable indicator of future performance and/or results. Past Performance or Forward-looking scenarios based upon the reasonable beliefs of the third-party provider are not a guarantee of future performance. Actual results may differ materially from those anticipated in forward-looking or past performance statements. IC Markets makes no representation or warranty and assumes no liability as to the accuracy or completeness of the information provided, nor any loss arising from any investment based on a recommendation, forecast or any information supplied by any third-party.

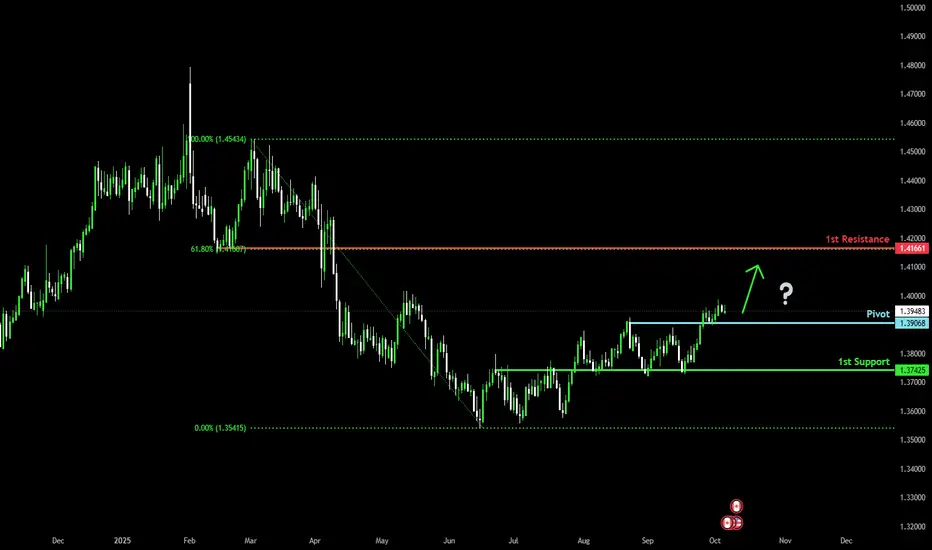
Bullish momentum set to continue?The loonie (USD/CAD) is falling towards the pivot and could bounce to the 61.8% Fibonacci resistance.
Pivot: 1.3906
1st Support: 1.3742
1st Resistance: 1.4166
Disclaimer:
The above opinions given constitute general market commentary, and do not constitute the opinion or advice of IC Markets or any form of personal or investment advice.
Any opinions, news, research, analyses, prices, other information, or links to third-party sites contained on this website are provided on an "as-is" basis, are intended only to be informative, is not an advice nor a recommendation, nor research, or a record of our trading prices, or an offer of, or solicitation for a transaction in any financial instrument and thus should not be treated as such. The information provided does not involve any specific investment objectives, financial situation and needs of any specific person who may receive it. Please be aware, that past performance is not a reliable indicator of future performance and/or results. Past Performance or Forward-looking scenarios based upon the reasonable beliefs of the third-party provider are not a guarantee of future performance. Actual results may differ materially from those anticipated in forward-looking or past performance statements. IC Markets makes no representation or warranty and assumes no liability as to the accuracy or completeness of the information provided, nor any loss arising from any investment based on a recommendation, forecast or any information supplied by any third-party.
Bearish continuation?The Swissie (USD/CHF) is rising towards the pivot and oculd reverse to the pullback support.
Pivot: 0.8040
1st Support: 0.7916
1st Resistance: 0.8162
Disclaimer:
The above opinions given constitute general market commentary, and do not constitute the opinion or advice of IC Markets or any form of personal or investment advice.
Any opinions, news, research, analyses, prices, other information, or links to third-party sites contained on this website are provided on an "as-is" basis, are intended only to be informative, is not an advice nor a recommendation, nor research, or a record of our trading prices, or an offer of, or solicitation for a transaction in any financial instrument and thus should not be treated as such. The information provided does not involve any specific investment objectives, financial situation and needs of any specific person who may receive it. Please be aware, that past performance is not a reliable indicator of future performance and/or results. Past Performance or Forward-looking scenarios based upon the reasonable beliefs of the third-party provider are not a guarantee of future performance. Actual results may differ materially from those anticipated in forward-looking or past performance statements. IC Markets makes no representation or warranty and assumes no liability as to the accuracy or completeness of the information provided, nor any loss arising from any investment based on a recommendation, forecast or any information supplied by any third-party.

Bullish bounce in play?The Cable (GBP/USD) has bounced off the pivot and oculd rise to the 1st resistance.
Pivot: 1.3369
1st Support: 1.3200
1st Resistance: 1.3575
Disclaimer:
The above opinions given constitute general market commentary, and do not constitute the opinion or advice of IC Markets or any form of personal or investment advice.
Any opinions, news, research, analyses, prices, other information, or links to third-party sites contained on this website are provided on an "as-is" basis, are intended only to be informative, is not an advice nor a recommendation, nor research, or a record of our trading prices, or an offer of, or solicitation for a transaction in any financial instrument and thus should not be treated as such. The information provided does not involve any specific investment objectives, financial situation and needs of any specific person who may receive it. Please be aware, that past performance is not a reliable indicator of future performance and/or results. Past Performance or Forward-looking scenarios based upon the reasonable beliefs of the third-party provider are not a guarantee of future performance. Actual results may differ materially from those anticipated in forward-looking or past performance statements. IC Markets makes no representation or warranty and assumes no liability as to the accuracy or completeness of the information provided, nor any loss arising from any investment based on a recommendation, forecast or any information supplied by any third-party.

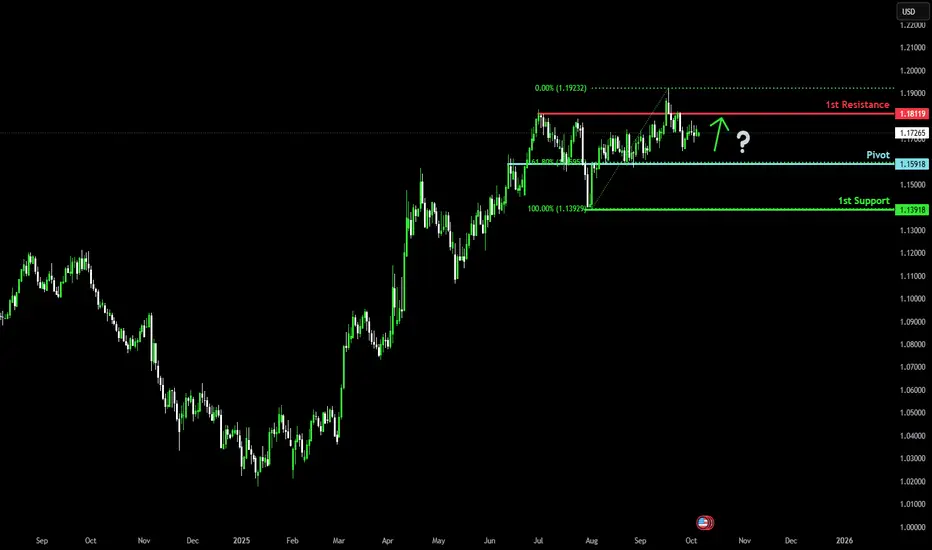
Potential bullish bounce setup?The Fiber (EUR/USD) is falling towards the pivot, which acts as an overlap support and could bounce to the 1st resistance.
Pivot: 1.1591
1st Support: 1.1391
1st Resistance: 1.1811
Disclaimer:
The above opinions given constitute general market commentary, and do not constitute the opinion or advice of IC Markets or any form of personal or investment advice.
Any opinions, news, research, analyses, prices, other information, or links to third-party sites contained on this website are provided on an "as-is" basis, are intended only to be informative, is not an advice nor a recommendation, nor research, or a record of our trading prices, or an offer of, or solicitation for a transaction in any financial instrument and thus should not be treated as such. The information provided does not involve any specific investment objectives, financial situation and needs of any specific person who may receive it. Please be aware, that past performance is not a reliable indicator of future performance and/or results. Past Performance or Forward-looking scenarios based upon the reasonable beliefs of the third-party provider are not a guarantee of future performance. Actual results may differ materially from those anticipated in forward-looking or past performance statements. IC Markets makes no representation or warranty and assumes no liability as to the accuracy or completeness of the information provided, nor any loss arising from any investment based on a recommendation, forecast or any information supplied by any third-party.
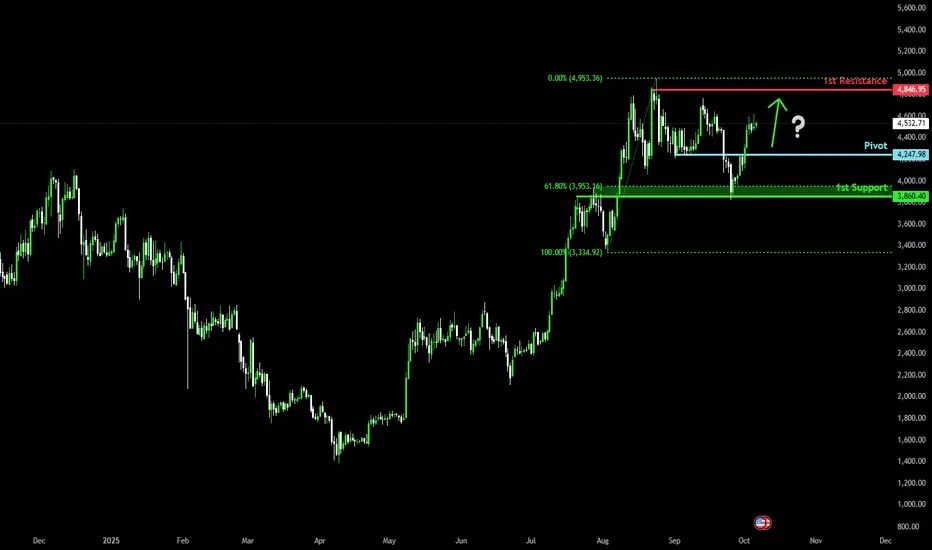
Bullish bounce from support?The Ethereum (ETH/USD) is falling towards the pivot which acts as a pullback support and could bounce to the 1st resistance.
Pivot: 4,247.98
1st Support: 3,860.40
1st Resistance: 4,846.95
Disclaimer:
The above opinions given constitute general market commentary, and do not constitute the opinion or advice of IC Markets or any form of personal or investment advice.
Any opinions, news, research, analyses, prices, other information, or links to third-party sites contained on this website are provided on an "as-is" basis, are intended only to be informative, is not an advice nor a recommendation, nor research, or a record of our trading prices, or an offer of, or solicitation for a transaction in any financial instrument and thus should not be treated as such. The information provided does not involve any specific investment objectives, financial situation and needs of any specific person who may receive it. Please be aware, that past performance is not a reliable indicator of future performance and/or results. Past Performance or Forward-looking scenarios based upon the reasonable beliefs of the third-party provider are not a guarantee of future performance. Actual results may differ materially from those anticipated in forward-looking or past performance statements. IC Markets makes no representation or warranty and assumes no liability as to the accuracy or completeness of the information provided, nor any loss arising from any investment based on a recommendation, forecast or any information supplied by any third-party.
Bullish bounce off major support?AUD/USD has bounced off the support level, which is a pullback support that aligns with the 50% Fibonacci retracement and could bounce from this level to our take profit.
Entry: 0.6579
Why we like it:
There is a pullback support that aligns with the 50% Fibonacci retracement.
Enjoying your TradingView experience? Review us!
Please be advised that the information presented on TradingView is provided to Vantage (‘Vantage Global Limited’, ‘we’) by a third-party provider (‘Everest Fortune Group’). Please be reminded that you are solely responsible for the trading decisions on your account. There is a very high degree of risk involved in trading. Any information and/or content is intended entirely for research, educational and informational purposes only and does not constitute investment or consultation advice or investment strategy. The information is not tailored to the investment needs of any specific person and therefore does not involve a consideration of any of the investment objectives, financial situation or needs of any viewer that may receive it. Kindly also note that past performance is not a reliable indicator of future results. Actual results may differ materially from those anticipated in forward-looking or past performance statements. We assume no liability as to the accuracy or completeness of any of the information and/or content provided herein and the Company cannot be held responsible for any omission, mistake nor for any loss or damage including without limitation to any loss of profit which may arise from reliance on any information supplied by Everest Fortune Group.
Stop loss: 0.6529
Why we like it:
There is a pullback support level.
Take profit: 0.6682
Why we like it:
There is a swing high resistance.

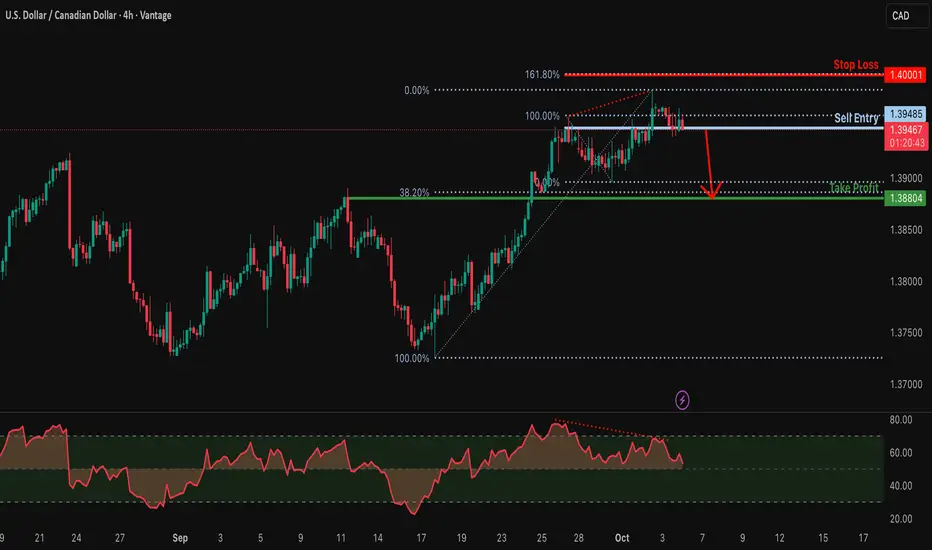
Potential bearish reversal for the Loonie?The price is reacting off the resistance level which is a pullback resistance, and could drop from this level to our take profit.
Entry: 1.3948
Why we like it:
There is a pullback resistance.
Stop loss: 1.4000
Why we like it:
There is a resistance level which aligns with the 161.8% Fibonacci extension.
Take profit: 1.3880
Why we like it:
There is a pullback support level which lines up with the 38.2% Fibonacci retracement.
Enjoying your TradingView experience? Review us!
Please be advised that the information presented on TradingView is provided to Vantage (‘Vantage Global Limited’, ‘we’) by a third-party provider (‘Everest Fortune Group’). Please be reminded that you are solely responsible for the trading decisions on your account. There is a very high degree of risk involved in trading. Any information and/or content is intended entirely for research, educational and informational purposes only and does not constitute investment or consultation advice or investment strategy. The information is not tailored to the investment needs of any specific person and therefore does not involve a consideration of any of the investment objectives, financial situation or needs of any viewer that may receive it. Kindly also note that past performance is not a reliable indicator of future results. Actual results may differ materially from those anticipated in forward-looking or past performance statements. We assume no liability as to the accuracy or completeness of any of the information and/or content provided herein and the Company cannot be held responsible for any omission, mistake nor for any loss or damage including without limitation to any loss of profit which may arise from reliance on any information supplied by Everest Fortune Group.
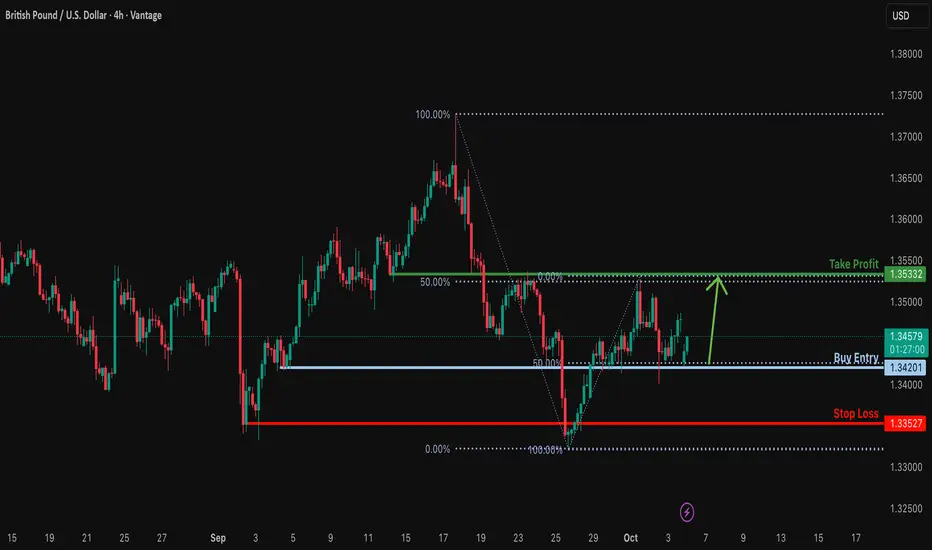
Bullish bounce off 50% Fibonacci support?GBP/USD has bounced off the support level, which is a pullback support that aligns with the 50% Fibonacci retracement and could rise from this level to take profit.
Entry: 1.3420
Why we like it:
There is a pullback support that aligns with the 50% Fibonacci retracement.
Stop loss: 1.3352
Why we like it:
There is a multi-swing low support.
Take profit: 1.3533
Why we like it:
There is an overlap resistance that aligns with the 50% Fibonacci retracement.
Enjoying your TradingView experience? Review us!
Please be advised that the information presented on TradingView is provided to Vantage (‘Vantage Global Limited’, ‘we’) by a third-party provider (‘Everest Fortune Group’). Please be reminded that you are solely responsible for the trading decisions on your account. There is a very high degree of risk involved in trading. Any information and/or content is intended entirely for research, educational and informational purposes only and does not constitute investment or consultation advice or investment strategy. The information is not tailored to the investment needs of any specific person and therefore does not involve a consideration of any of the investment objectives, financial situation or needs of any viewer that may receive it. Kindly also note that past performance is not a reliable indicator of future results. Actual results may differ materially from those anticipated in forward-looking or past performance statements. We assume no liability as to the accuracy or completeness of any of the information and/or content provided herein and the Company cannot be held responsible for any omission, mistake nor for any loss or damage including without limitation to any loss of profit which may arise from reliance on any information supplied by Everest Fortune Group.
Bullish rise?EUR/USD is reacting off the support level which is a pullback support and could bounce from this level to our take profit.
Entry: 1.1709
Why we like it:
There is a pullback support level.
Stop loss: 1.1663
Why we like it:
There is a pullback support level.
Take profit: 1.1816
Why we like it:
There is a swing high resistance.
Enjoying your TradingView experience? Review us!
Please be advised that the information presented on TradingView is provided to Vantage (‘Vantage Global Limited’, ‘we’) by a third-party provider (‘Everest Fortune Group’). Please be reminded that you are solely responsible for the trading decisions on your account. There is a very high degree of risk involved in trading. Any information and/or content is intended entirely for research, educational and informational purposes only and does not constitute investment or consultation advice or investment strategy. The information is not tailored to the investment needs of any specific person and therefore does not involve a consideration of any of the investment objectives, financial situation or needs of any viewer that may receive it. Kindly also note that past performance is not a reliable indicator of future results. Actual results may differ materially from those anticipated in forward-looking or past performance statements. We assume no liability as to the accuracy or completeness of any of the information and/or content provided herein and the Company cannot be held responsible for any omission, mistake nor for any loss or damage including without limitation to any loss of profit which may arise from reliance on any information supplied by Everest Fortune Group.

GBP/USD –> Double Head and Shoulders PatternHello guys.
On the daily chart, we can clearly see two Head and Shoulders (H&S) formations shaping the market structure -> a larger green H&S and a smaller red H&S inside it.
🔹 Green Head and Shoulders
The green H&S pattern was already completed earlier, and its neckline has been broken to the upside, signaling the start of a potential medium-term bullish trend. The pattern’s measured target points toward the 1.3900 zone, which remains the broader bullish objective.
🔹 Red Head and Shoulders
Recently, a smaller red H&S pattern formed inside this structure. The head of the red pattern tested the Supply & Demand (S&D) zone that was created by the previous (green) H&S pattern.
The neckline of the red H&S, around 1.3542, is now a crucial bullish level. A confirmed breakout above this neckline would likely trigger a continuation move toward 1.36685, which is the projected target of the red pattern.
🔹 Key Levels to Watch
1.3542 → Breakout confirmation zone
1.36685 → Target of the red H&S pattern
1.3900 → Final target of the green H&S pattern
If price holds above 1.3542, the bullish structure remains valid, and momentum could strengthen toward 1.36685 and 1.3900 in extension.
Disclaimer: As part of ThinkMarkets’ Influencer Program, I am sponsored to share and publish their charts in my analysis.

#BTCUSDT Let Bitcoin make a new ATH#BTC
The price is moving in a descending channel on the 1-hour frame and is expected to break and continue upward.
We have a trend to stabilize above the 100 moving average once again.
We have a downtrend on the RSI indicator that supports the upward move with a breakout.
We have a major support area in green that pushed the price higher at 121,500.
Entry price: 122,200.
First target: 122,800.
Second target: 123,400.
Third target: 124,200.
To manage risk, don't forget stop loss and capital management.
When you reach the first target, save some profits and then change your stop order to an entry order.
For inquiries, please comment.
Thank you.

EURUSD Short: Continuation Within the Downward WedgeHello, traders! The prior market structure for EURUSD was a bullish ascending channel, which failed and led to a breakdown. This reversal has established the current bearish market phase, which has taken the form of a downward wedge. This pattern has been guiding the price auction lower through a series of lower highs and lower lows, confirming that seller initiative is dominant.
Currently, the price action is consolidating within this wedge. Following a minor bounce, the market is showing signs of weakness and appears ready to continue the established downtrend, respecting the wedge's boundaries.
My scenario for the development of events is a direct continuation of the decline within this wedge. I expect the price to complete another leg down from the current levels. The take-profit is therefore set directly at the 1.1615 level, targeting the demand zone which aligns with the lower support line of the pattern. Manage your risk!
