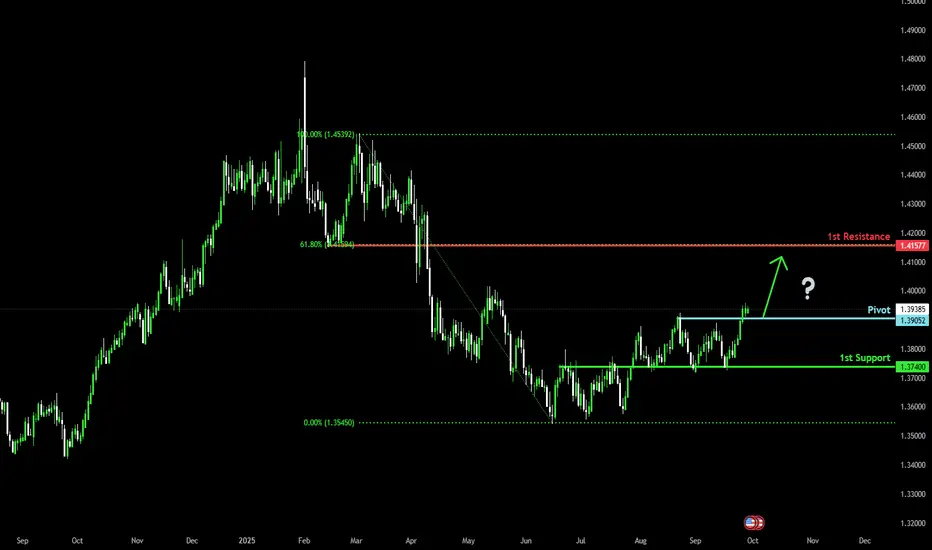
Bullish momentum to extend?The Loonie (USD/CAD) is reacting off the pivot which is a pullback support and could rise to the 1st resistance which aligns with the 61.8% Fibonacci retracement.
Pivot: 1.3905
1st Support: 1.3740
1st Resistance: 1.4157
Disclaimer:
The above opinions given constitute general market commentary, and do not constitute the opinion or advice of IC Markets or any form of personal or investment advice.
Any opinions, news, research, analyses, prices, other information, or links to third-party sites contained on this website are provided on an "as-is" basis, are intended only to be informative, is not an advice nor a recommendation, nor research, or a record of our trading prices, or an offer of, or solicitation for a transaction in any financial instrument and thus should not be treated as such. The information provided does not involve any specific investment objectives, financial situation and needs of any specific person who may receive it. Please be aware, that past performance is not a reliable indicator of future performance and/or results. Past Performance or Forward-looking scenarios based upon the reasonable beliefs of the third-party provider are not a guarantee of future performance. Actual results may differ materially from those anticipated in forward-looking or past performance statements. IC Markets makes no representation or warranty and assumes no liability as to the accuracy or completeness of the information provided, nor any loss arising from any investment based on a recommendation, forecast or any information supplied by any third-party.
J-USD
Bearish continuation?The Swissie (USD/CHF) is rising towards the pivot and could drop to the 1st support.
Pivot: 0.8027
1st Support: 0.7853
1st Resistance: 0.8169
Disclaimer:
The above opinions given constitute general market commentary, and do not constitute the opinion or advice of IC Markets or any form of personal or investment advice.
Any opinions, news, research, analyses, prices, other information, or links to third-party sites contained on this website are provided on an "as-is" basis, are intended only to be informative, is not an advice nor a recommendation, nor research, or a record of our trading prices, or an offer of, or solicitation for a transaction in any financial instrument and thus should not be treated as such. The information provided does not involve any specific investment objectives, financial situation and needs of any specific person who may receive it. Please be aware, that past performance is not a reliable indicator of future performance and/or results. Past Performance or Forward-looking scenarios based upon the reasonable beliefs of the third-party provider are not a guarantee of future performance. Actual results may differ materially from those anticipated in forward-looking or past performance statements. IC Markets makes no representation or warranty and assumes no liability as to the accuracy or completeness of the information provided, nor any loss arising from any investment based on a recommendation, forecast or any information supplied by any third-party.

Falling towards major support?The Cable (GBP/USD) is falling towards the pivot which acts as an overlap support and could bounce to the 1st resistance.
Pivot: 1.3267
1st Support: 1.3015
1st Resistance: 1.3579
Disclaimer:
The above opinions given constitute general market commentary, and do not constitute the opinion or advice of IC Markets or any form of personal or investment advice.
Any opinions, news, research, analyses, prices, other information, or links to third-party sites contained on this website are provided on an "as-is" basis, are intended only to be informative, is not an advice nor a recommendation, nor research, or a record of our trading prices, or an offer of, or solicitation for a transaction in any financial instrument and thus should not be treated as such. The information provided does not involve any specific investment objectives, financial situation and needs of any specific person who may receive it. Please be aware, that past performance is not a reliable indicator of future performance and/or results. Past Performance or Forward-looking scenarios based upon the reasonable beliefs of the third-party provider are not a guarantee of future performance. Actual results may differ materially from those anticipated in forward-looking or past performance statements. IC Markets makes no representation or warranty and assumes no liability as to the accuracy or completeness of the information provided, nor any loss arising from any investment based on a recommendation, forecast or any information supplied by any third-party.

Bullish bounce?The Fiber (EUR/USD) is falling towards the pivot which acts as an overlap support that aligns with the 61.8% Fibonacci retracement and could bounce to the 1st resistance which is a pullback resistance.
Pivot: 1.1584
1st Support: 1.1398
1st Resistance: 1.1736
Disclaimer:
The above opinions given constitute general market commentary, and do not constitute the opinion or advice of IC Markets or any form of personal or investment advice.
Any opinions, news, research, analyses, prices, other information, or links to third-party sites contained on this website are provided on an "as-is" basis, are intended only to be informative, is not an advice nor a recommendation, nor research, or a record of our trading prices, or an offer of, or solicitation for a transaction in any financial instrument and thus should not be treated as such. The information provided does not involve any specific investment objectives, financial situation and needs of any specific person who may receive it. Please be aware, that past performance is not a reliable indicator of future performance and/or results. Past Performance or Forward-looking scenarios based upon the reasonable beliefs of the third-party provider are not a guarantee of future performance. Actual results may differ materially from those anticipated in forward-looking or past performance statements. IC Markets makes no representation or warranty and assumes no liability as to the accuracy or completeness of the information provided, nor any loss arising from any investment based on a recommendation, forecast or any information supplied by any third-party.

Gold Futures Weekly Outlook (MGCZ5)📍 Key Levels on Watch
Friday’s High (D-H): 3814.5
Friday’s Low (D-L): 3764.2 → New support
Weekly High (WFH): 3824.6
Weekly Low (W-L): 3717.7
Daily FVG Below: 3746.3–3735.2
🧭 Technical Outlook
Price is currently sitting right at the 50% midpoint of Friday’s move.
Friday’s Low (3764.2) is the key inflection point:
If defended → bullish continuation toward 3814.5 and possibly 3824.6.
If broken → expect a quick flush into the Daily FVG (3746–3735) before buyers step back in.
Volume profile shows a low-volume pocket below 3770, which could accelerate moves down into that Daily FVG if support fails.
🌍 Macro Context
De-Dollarization trends continue to support Gold in the longer term.
Geopolitical tensions (military leadership meetings this Tuesday + ongoing global conflicts) = potential safe haven demand.
US Political Risk: Government shutdown threats and loss of traction for the Trump administration add uncertainty → historically supportive for Gold.
Safe Haven Flows: When global stability is questioned, Gold is a direct beneficiary.
🎯 Scenarios to Watch
Bullish Case:
Friday’s low holds → retest of 3814.5 and possibly new weekly highs above 3824.6.
Bearish Case:
Break of 3764.2 → fast move into Daily FVG (3746–3735).
Watch for liquidity sweep & reversal setup inside that FVG.
📌 My Plan
Bias leans bullish this week given the macro backdrop.
BUT — I’ll wait for price to show its hand around Friday’s low before committing to either continuation or discount entries.
Staying flexible: both scenarios mapped, execution will be clean.

USDCHF Potential DownsidesHey Traders, in today’s trading session we are monitoring USDCHF for a selling opportunity around 0.80000 zone, USDCHF is trading in a downtrend and currently is in a correction phase on which it is approaching the trend at 0.80000 support and resistance area.
Trade safe, Joe.

GBPUSD: CABLE COILED FOR 1.36 EXPLOSION! Sterling Rally 🚀 GBPUSD: CABLE COILED FOR 1.36 EXPLOSION! Sterling Rally 📊
Current Price: 1.34036 | Date: Sept 27, 2025 ⏰
📈 INTRADAY TRADING SETUPS (Next 5 Days)
🎯 BULLISH SCENARIO
Entry Zone: 1.3380 - 1.3420 📍
Stop Loss: 1.3340 🛑
Target 1: 1.3480 🎯
Target 2: 1.3550 🚀
🎯 BEARISH SCENARIO
Entry Zone: 1.3440 - 1.3480 📍
Stop Loss: 1.3520 🛑
Target 1: 1.3350 🎯
Target 2: 1.3280 📉
🔍 TECHNICAL ANALYSIS BREAKDOWN
📊 KEY INDICATORS STATUS:
RSI (14): 65.3 ⚡ Sterling Strength Zone
Bollinger Bands: Squeezing for Move 🔥
VWAP: 1.3395 - Critical Pivot 💪
EMA 50: 1.3360 ✅ Bullish Crossover
Volume: Accumulation Pattern 📊
🌊 WAVE ANALYSIS:
Elliott Wave: Wave 3 Building Steam 🌊
Fibonacci Extension: 1.3650 Target 🎯
🔄 HARMONIC PATTERNS:
Bullish Butterfly at 1.3350 ✨
ABCD Completion to 1.3520 🔄
⚖️ SWING TRADING OUTLOOK (1-4 Weeks)
🚀 BULLISH TARGETS:
Psychological: 1.3600 🏆
Weekly Target: 1.3650 🌙
Gann Square: 1.3700 ⭐
📉 BEARISH INVALIDATION:
Weekly Support: 1.3250 ⚠️
Critical Level: 1.3150 🚨
🎭 MARKET STRUCTURE:
Trend: Bullish Flag Formation 💪
Momentum: Coiling Energy 🔥
Wyckoff Phase: Spring Complete 📈
Ichimoku: Cloud Breakout Pending 🟢
⚡ CABLE VOLATILITY SETUP:
Compression Zone: 1.3350-1.3450 🎢
Breakout Catalyst: BoE Data 💥
Volatility Spike: Expected Above 1.3480 📈
🏛️ UK FUNDAMENTALS:
BoE Policy Hawkish Stance 🏦
GDP Growth Resilient Data 📊
Inflation Supporting GBP 📈
Political Stability Improving 🇬🇧
⚡ RISK MANAGEMENT:
Max Risk per Trade: 60 pips 🛡️
R:R Ratio: Minimum 1:2.5 ⚖️
London Open: High Impact 📏
🔥 CRITICAL BREAKOUT LEVELS:
Bull Trigger: 1.3480 clean break 💥
Support Zone: 1.3380 | 1.3340 | 1.3300 🛡️
Resistance: 1.3480 | 1.3550 | 1.3600 🚧
📈 STERLING STRENGTH:
vs USD: Momentum Building 💪
vs EUR: Outperforming 🔥
Cross Pairs: Bullish Flow 🌊
🎯 FINAL VERDICT:
CABLE ready for EXPLOSIVE 1.36 MOVE! 🚀
Sterling coiled like a spring! 💎
Perfect storm brewing for breakout! ⛈️
Trade Management: Buy dips to 1.3380 💰
Key Level: 1.3480 breakout crucial! 🔑
---
⚠️ Disclaimer: FX trading carries substantial risk. Manage positions carefully. Educational content only.
For individuals seeking to enhance their trading abilities based on the analyses provided, I recommend exploring the mentoring program offered by Shunya Trade. (Website: shunya dot trade)
I would appreciate your feedback on this analysis, as it will serve as a valuable resource for future endeavors.
Sincerely,
Shunya.Trade
Website: shunya dot trade
🔔 Follow Cable Updates | 💬 Share Your Sterling Strategy Below

EURUSD: 1.18 FORTRESS ATTACK! Dollar Weakness Exposed 🚀 EURUSD: 1.18 FORTRESS ATTACK! Dollar Weakness Exposed 📊
Current Price: 1.17020 | Date: Sept 27, 2025 ⏰
📈 INTRADAY TRADING SETUPS (Next 5 Days)
🎯 BULLISH SCENARIO
Entry Zone: 1.1680 - 1.1710 📍
Stop Loss: 1.1650 🛑
Target 1: 1.1750 🎯
Target 2: 1.1790 🚀
🎯 BEARISH SCENARIO
Entry Zone: 1.1720 - 1.1750 📍
Stop Loss: 1.1780 🛑
Target 1: 1.1650 🎯
Target 2: 1.1600 📉
🔍 TECHNICAL ANALYSIS BREAKDOWN
📊 KEY INDICATORS STATUS:
RSI (14): 62.1 ⚡ Euro Strength Building
Bollinger Bands: Expansion Mode 🔥
VWAP: 1.1695 - Dynamic Support 💪
EMA 20: 1.1675 ✅ Bullish Momentum
Volume: Institutional Flow Rising 📊
🌊 WAVE ANALYSIS:
Elliott Wave: Wave C Impulse Active 🌊
Fibonacci Target: 1.1850 (127.2%) 🎯
🔄 HARMONIC PATTERNS:
Bullish Gartley at 1.1660 Support ✨
Cypher PRZ targeting 1.1780 🔄
⚖️ SWING TRADING OUTLOOK (1-4 Weeks)
🚀 BULLISH TARGETS:
Psychological: 1.1800 🏆
Weekly Resistance: 1.1850 🌙
Gann Level: 1.1875 ⭐
📉 BEARISH INVALIDATION:
Weekly Support: 1.1600 ⚠️
Critical Break: 1.1550 🚨
🎭 MARKET STRUCTURE:
Trend: Ascending Channel 💪
Momentum: Dollar Weakness 🔥
Wyckoff Phase: Markup Phase 📈
Ichimoku: Bullish Cloud Break 🟢
🏰 1.18 FORTRESS BATTLE:
Key Resistance: 1.1780-1.1800 ⚔️
Volume Confirmation: Needed Above 1.1750 💥
Breakout Target: 1.1850 Major Level 🔓
⚡ RISK MANAGEMENT:
Max Risk per Trade: 50 pips 🛡️
R:R Ratio: Minimum 1:2 ⚖️
London/NY Sessions: Prime Time 📏
🌍 CENTRAL BANK DYNAMICS:
ECB Policy Divergence Bullish 🏛️
Fed Dovishness Supporting EUR 📈
Dollar Index Weakness Continues 💵
Rate Differential Narrowing 📊
🔥 CRITICAL LEVELS:
Breakout: 1.1750 decisive close 💥
Support: 1.1680 | 1.1650 | 1.1620 🛡️
Resistance: 1.1750 | 1.1780 | 1.1800 🚧
📈 DXY CORRELATION:
Dollar Index: Bearish Divergence 📉
EUR Strength: Independent Rally 💪
Cross-Currency: Bullish Flow 🔄
🎯 FINAL VERDICT:
EURUSD storming 1.18 RESISTANCE! 🚀
Dollar weakness = Euro rocket fuel! 💎
Multi-timeframe bullish alignment! 📈
Trade Management: Scale in above 1.1680 💰
Breakout Alert: Watch 1.1750 hold! 🔔
---
⚠️ Disclaimer: FX trading involves significant risk. Use proper position sizing. Educational analysis only.
For individuals seeking to enhance their trading abilities based on the analyses provided, I recommend exploring the mentoring program offered by Shunya Trade. (Website: shunya dot trade)
I would appreciate your feedback on this analysis, as it will serve as a valuable resource for future endeavors.
Sincerely,
Shunya.Trade
Website: shunya dot trade
🔔 Follow FX Market Updates | 💬 What's Your 1.18 Target Timeline?

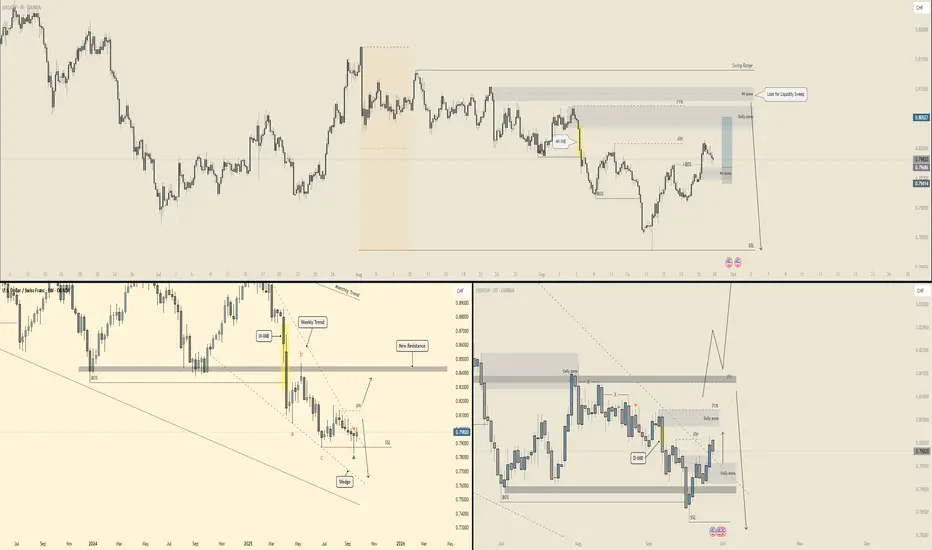
USD/CHF - Multi Timeframe Analysis (Trade setup)📉 USD/CHF – Forecast Breakdown 📉
Time to dissect this one across the charts 👇
🕰 Weekly View
The weekly chart is still in a bearish trend. Price rejected from the monthly/weekly trendline and printed a clean lower-high setup. Structure suggests continuation down unless buyers can flip resistance near 0.83. For now → bias leans bearish, with space to revisit 0.76–0.75 demand.
📅 Daily Structure
Daily shows a swing range with:
BOS south ✅
Liquidity sweep below SSL (sell-side liquidity)
Market retracing toward 0.805–0.81 (daily + 71% zone)
This looks like a setup for a liquidity grab into premium pricing before sellers potentially take control again. The daily zone at 0.805–0.81 is the hot spot to watch for bearish reactions.
⏱ 4H Breakdown
On the 4H:
Price already made a BOS down, confirming short-term bearishness.
Currently pushing back into a 4H + daily supply overlap (0.805–0.81).
Ideal scenario → a sweep of that zone before the next bearish leg, targeting 0.79 → 0.785.
🎯 Summary
Weekly : Bearish, trend pointing lower 📉
Daily : Retrace likely into 0.805–0.81 before rejection ⚔️
4H : Watching for liquidity sweep + reversal confirmation 👀
Bias → Bearish, unless bulls flip above 0.815. Short opportunities favored around the supply zone, targeting 0.79 → 0.785, with deeper extension possible toward 0.76 if momentum holds.
⚠️ Risk note: USD/CHF can grind slowly — patience is key; avoid chasing entries.
USD/JPY - Multi Timeframe analysis🚀 USD/JPY – Forecast Breakdown 🚀
Let’s cook this pair up across the timeframes 👇
🕰 Weekly View
Price has been battling along that weekly liquidity trendline. After months of chop, buyers finally punched through the consolidation zone and are now aiming higher. Big picture → the path of least resistance points north toward the 152–154 zone. But, keep in mind, weekly still has major resistance around 150 lurking.
📅 Daily Structure
Daily chart shows a clean BOS after running stops. Price cleared liquidity above 149, tapped into the daily imbalance, and is reacting nicely. If bulls keep control, momentum could carry us toward 151. But if daily sellers defend that major resistance, we could see a dip back to 148 (daily demand).
⏱ 4H Breakdown
On the 4H:
Fresh BOS + 71% fib reaction 🔥
Price grabbed liquidity below before rocketing higher.
Market is now stalling under 149.5 – 150 major resistance.
Short-term scenario: Possible pullback into 148.3 – 148.5 (4H demand) before another leg up. If that zone holds, bulls likely reload and push us toward 151+.
🎯 Summary
Weekly : Breaking higher, aiming for 152–154 🎯
Daily : Strong BOS, but resistance at 150 needs clearing ⚔️
4H : Demand at 148.3–148.5 is the key re-entry zone 🟩
Bias → Bullish overall, with healthy pullbacks likely. Watch 150: break it clean and we’re on rocket mode 🚀; rejection could mean a retest of 148 support.
⚠️ Risk note: USD/JPY is a stop-hunter — mind your entries and size.

GBPUSD Long-term Top confirmed. Massive selling ahead.At the beginning of the year (January 10, see chart below), we issued a very strong buy signal on the GBPUSD pair, exactly at the bottom of the 3-year Channel Up, catching the most optimal buy entry and methodically hitting our 1.2950 Target:
This time we a confirmed Top for the same very pattern, which even though it may have widened the Higher Highs and Higher Lows (Megaphone), it did form last week Lower Highs, while also coming off a 1W MACD Bearish Cross, which at such high values, has been the sell signal on both previous Channel Tops.
Given that both Bearish Legs (red Channel Down sequences) reached at least their respective 0.786 Fibonacci levels, we are expecting the pair to hit 1.2450 within Q1 2026.
-------------------------------------------------------------------------------
** Please LIKE 👍, FOLLOW ✅, SHARE 🙌 and COMMENT ✍ if you enjoy this idea! Also share your ideas and charts in the comments section below! This is best way to keep it relevant, support us, keep the content here free and allow the idea to reach as many people as possible. **
-------------------------------------------------------------------------------
💸💸💸💸💸💸
👇 👇 👇 👇 👇 👇

Gold Ready To Drop in 15 Minutes TFGold Ready To Drop in 15 Minutes TF after yesteray's positive GDP outcome. US has gone to fetch the dollar mark

GBP/USD - Multi Timeframe Forecast🕰 Weekly View
Weekly is looking toppy near that 1.38–1.39 rejection zone.
Big weekly BOS already in play → momentum pointing down.
Liquidity targets sit way lower at 1.28–1.29 (weekly demand + swing range).
📉 Daily Structure
Daily broke structure → now printing lower highs.
A daily supply zone sits heavy overhead near 1.36–1.37.
If sellers keep pressing, the magnet is clear: 1.30–1.31 daily demand (stacked with fib + HV buy zone).
Any bounces are likely just snack stops for liquidity 🍟 before rolling lower.
⏱ 4H Breakdown
Price is hunting between two short-term options:
1️⃣ Option 1: Tap into the 4H supply around 1.3450–1.3500, reject hard → continuation down.
2️⃣ Option 2: Push a bit higher into the high-volume sell zone at 1.3550–1.3600 → then dump to new lows.
Below, key demand sits at 1.3200 → 1.3000, so that’s the landing pad 🎯.
🎯 Summary
Bias : Bearish until proven otherwise.
Weekly → Failed top, heading toward deeper demand.
Daily → Lower highs into supply, eyes on 1.30.
4H → Watch for rejection at sell zones before shorting.
Big picture → GBP/USD looks like it’s loading up for a multi-week selloff 📉 unless buyers defend hard at 1.32.

EUR/USD - Multi time frame Analysis 🕰 Weekly View
Price recently tapped weekly demand around 1.1600 and reacted strong.
But that wick rejection above 1.1900 screams liquidity sweep 🧹—it failed to hold as a true breakout.
Until we see a clean weekly BOS (Break of Structure) above 1.1900, this is still looking like a range play between 1.16–1.19.
📉 Daily Structure
We’ve got a failed break at the highs, confirming liquidity grab.
Daily is chilling near the 71% fib retracement + demand zone. That’s the hot buy area 🏦.
If price bounces here → eyes on 1.1750–1.1800.
If it fails → expect a sweep into 1.1500 zone before any rocket 🚀.
⏱ 4H Breakdown
Two clear scenarios loading…
1️⃣ Idea 1 (deeper dip): Price breaks below current lows, sweeps liquidity into 1.1550–1.1600 (4H demand). Then we catch buys for a run back to 1.1700+.
2️⃣ Idea 2 (bullish push): Price flips short-term highs at 1.1750 → confirms momentum → next stop 1.1850–1.1900 retest.
Both ideas align with higher-timeframe liquidity games—just depends which way market makers want to hunt first 🎯.
🎯 Summary
Weekly = Range between 1.16–1.19 until proven otherwise.
Daily = Sitting on golden demand/discount.
4H = Watch for liquidity sweep down or break above 1.1750.
Big picture → Still bullish bias if demand holds, but don’t be surprised by one more dip before the climb.

AUDUSD H4 | Potential bearish drop Based on the H4 chart analysis, we can see that the price has reacted off the sell entry and could drop from this level to the downside.
Sell entry is 0.6558, which is a pullback resistance.
Stop loss is at 0.6619, which is a pullback resistance.
Take profit is at 0.6483, which is a pullback support that is slightly above the 78.6% Fibonacci retracement.
High Risk Investment Warning
Trading Forex/CFDs on margin carries a high level of risk and may not be suitable for all investors. Leverage can work against you.
Stratos Markets Limited (tradu.com ):
CFDs are complex instruments and come with a high risk of losing money rapidly due to leverage. 65% of retail investor accounts lose money when trading CFDs with this provider. You should consider whether you understand how CFDs work and whether you can afford to take the high risk of losing your money.
Stratos Europe Ltd (tradu.com ):
CFDs are complex instruments and come with a high risk of losing money rapidly due to leverage. 66% of retail investor accounts lose money when trading CFDs with this provider. You should consider whether you understand how CFDs work and whether you can afford to take the high risk of losing your money.
Stratos Global LLC (tradu.com ):
Losses can exceed deposits.
Please be advised that the information presented on TradingView is provided to Tradu (‘Company’, ‘we’) by a third-party provider (‘TFA Global Pte Ltd’). Please be reminded that you are solely responsible for the trading decisions on your account. There is a very high degree of risk involved in trading. Any information and/or content is intended entirely for research, educational and informational purposes only and does not constitute investment or consultation advice or investment strategy. The information is not tailored to the investment needs of any specific person and therefore does not involve a consideration of any of the investment objectives, financial situation or needs of any viewer that may receive it. Kindly also note that past performance is not a reliable indicator of future results. Actual results may differ materially from those anticipated in forward-looking or past performance statements. We assume no liability as to the accuracy or completeness of any of the information and/or content provided herein and the Company cannot be held responsible for any omission, mistake nor for any loss or damage including without limitation to any loss of profit which may arise from reliance on any information supplied by TFA Global Pte Ltd.
The speaker(s) is neither an employee, agent nor representative of Tradu and is therefore acting independently. The opinions given are their own, constitute general market commentary, and do not constitute the opinion or advice of Tradu or any form of personal or investment advice. Tradu neither endorses nor guarantees offerings of third-party speakers, nor is Tradu responsible for the content, veracity or opinions of third-party speakers, presenters or participants.

DOTUSD H4 | bearish drop offDOT/USD has rejected off the sell entry which and could potentially drop from this levle to the downside.
Sell entry is at 3.843, whichis a pullback resistance.
Stop loss is at 4.119, which is a pullback resistance.
Take profit is at 3.453, which acts as a pullback support.
High Risk Investment Warning
Trading Forex/CFDs on margin carries a high level of risk and may not be suitable for all investors. Leverage can work against you.
Stratos Markets Limited (tradu.com ):
CFDs are complex instruments and come with a high risk of losing money rapidly due to leverage. 65% of retail investor accounts lose money when trading CFDs with this provider. You should consider whether you understand how CFDs work and whether you can afford to take the high risk of losing your money.
Stratos Europe Ltd (tradu.com ):
CFDs are complex instruments and come with a high risk of losing money rapidly due to leverage. 66% of retail investor accounts lose money when trading CFDs with this provider. You should consider whether you understand how CFDs work and whether you can afford to take the high risk of losing your money.
Stratos Global LLC (tradu.com ):
Losses can exceed deposits.
Please be advised that the information presented on TradingView is provided to Tradu (‘Company’, ‘we’) by a third-party provider (‘TFA Global Pte Ltd’). Please be reminded that you are solely responsible for the trading decisions on your account. There is a very high degree of risk involved in trading. Any information and/or content is intended entirely for research, educational and informational purposes only and does not constitute investment or consultation advice or investment strategy. The information is not tailored to the investment needs of any specific person and therefore does not involve a consideration of any of the investment objectives, financial situation or needs of any viewer that may receive it. Kindly also note that past performance is not a reliable indicator of future results. Actual results may differ materially from those anticipated in forward-looking or past performance statements. We assume no liability as to the accuracy or completeness of any of the information and/or content provided herein and the Company cannot be held responsible for any omission, mistake nor for any loss or damage including without limitation to any loss of profit which may arise from reliance on any information supplied by TFA Global Pte Ltd.
The speaker(s) is neither an employee, agent nor representative of Tradu and is therefore acting independently. The opinions given are their own, constitute general market commentary, and do not constitute the opinion or advice of Tradu or any form of personal or investment advice. Tradu neither endorses nor guarantees offerings of third-party speakers, nor is Tradu responsible for the content, veracity or opinions of third-party speakers, presenters or participants.

USDCHF H4 | Bullish bounce off pullback supportUSD/CHF is falling towards the buy entry whichis a pullback support and could bounce from this level to the upside.
Buy entry is at 0.7969, which is a pullback support.
Stop loss is at 0.7908, which is a pullback support.
Take profit is at 0.8067, whichis a multi swing high resistance.
High Risk Investment Warning
Trading Forex/CFDs on margin carries a high level of risk and may not be suitable for all investors. Leverage can work against you.
Stratos Markets Limited (tradu.com ):
CFDs are complex instruments and come with a high risk of losing money rapidly due to leverage. 65% of retail investor accounts lose money when trading CFDs with this provider. You should consider whether you understand how CFDs work and whether you can afford to take the high risk of losing your money.
Stratos Europe Ltd (tradu.com ):
CFDs are complex instruments and come with a high risk of losing money rapidly due to leverage. 66% of retail investor accounts lose money when trading CFDs with this provider. You should consider whether you understand how CFDs work and whether you can afford to take the high risk of losing your money.
Stratos Global LLC (tradu.com ):
Losses can exceed deposits.
Please be advised that the information presented on TradingView is provided to Tradu (‘Company’, ‘we’) by a third-party provider (‘TFA Global Pte Ltd’). Please be reminded that you are solely responsible for the trading decisions on your account. There is a very high degree of risk involved in trading. Any information and/or content is intended entirely for research, educational and informational purposes only and does not constitute investment or consultation advice or investment strategy. The information is not tailored to the investment needs of any specific person and therefore does not involve a consideration of any of the investment objectives, financial situation or needs of any viewer that may receive it. Kindly also note that past performance is not a reliable indicator of future results. Actual results may differ materially from those anticipated in forward-looking or past performance statements. We assume no liability as to the accuracy or completeness of any of the information and/or content provided herein and the Company cannot be held responsible for any omission, mistake nor for any loss or damage including without limitation to any loss of profit which may arise from reliance on any information supplied by TFA Global Pte Ltd.
The speaker(s) is neither an employee, agent nor representative of Tradu and is therefore acting independently. The opinions given are their own, constitute general market commentary, and do not constitute the opinion or advice of Tradu or any form of personal or investment advice. Tradu neither endorses nor guarantees offerings of third-party speakers, nor is Tradu responsible for the content, veracity or opinions of third-party speakers, presenters or participants.

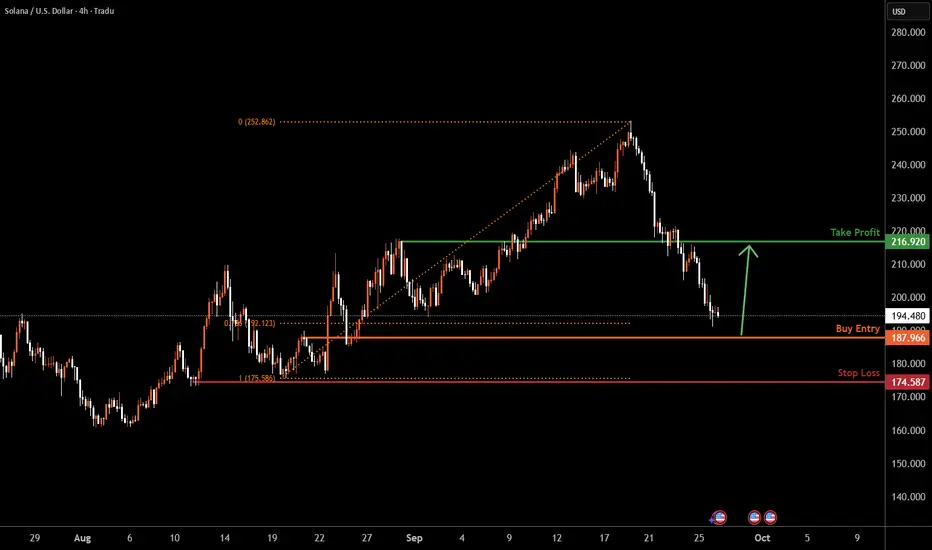
SOLUSD H4 | Could we see a bullish reversal?Based on the H4 chart analysis, we could see the price fall to the buy entry which is an overlap support that is slightly below the 78.6% Fibonacci retracement and could bounce from this levle to the upside.
Buy entry is at 187.96, which is an overlap support that is slightly below the 78.6% Fibonacci retracement.
Stop loss is at 174.58, which is a pullback support.
Take profit is at 216.92, which is a pullback resistance.
High Risk Investment Warning
Trading Forex/CFDs on margin carries a high level of risk and may not be suitable for all investors. Leverage can work against you.
Stratos Markets Limited (tradu.com ):
CFDs are complex instruments and come with a high risk of losing money rapidly due to leverage. 65% of retail investor accounts lose money when trading CFDs with this provider. You should consider whether you understand how CFDs work and whether you can afford to take the high risk of losing your money.
Stratos Europe Ltd (tradu.com ):
CFDs are complex instruments and come with a high risk of losing money rapidly due to leverage. 66% of retail investor accounts lose money when trading CFDs with this provider. You should consider whether you understand how CFDs work and whether you can afford to take the high risk of losing your money.
Stratos Global LLC (tradu.com ):
Losses can exceed deposits.
Please be advised that the information presented on TradingView is provided to Tradu (‘Company’, ‘we’) by a third-party provider (‘TFA Global Pte Ltd’). Please be reminded that you are solely responsible for the trading decisions on your account. There is a very high degree of risk involved in trading. Any information and/or content is intended entirely for research, educational and informational purposes only and does not constitute investment or consultation advice or investment strategy. The information is not tailored to the investment needs of any specific person and therefore does not involve a consideration of any of the investment objectives, financial situation or needs of any viewer that may receive it. Kindly also note that past performance is not a reliable indicator of future results. Actual results may differ materially from those anticipated in forward-looking or past performance statements. We assume no liability as to the accuracy or completeness of any of the information and/or content provided herein and the Company cannot be held responsible for any omission, mistake nor for any loss or damage including without limitation to any loss of profit which may arise from reliance on any information supplied by TFA Global Pte Ltd.
The speaker(s) is neither an employee, agent nor representative of Tradu and is therefore acting independently. The opinions given are their own, constitute general market commentary, and do not constitute the opinion or advice of Tradu or any form of personal or investment advice. Tradu neither endorses nor guarantees offerings of third-party speakers, nor is Tradu responsible for the content, veracity or opinions of third-party speakers, presenters or participants.
GBPUSD H4 | bearish momentum to extendGBP/USD is rising towards the sell entry which is a pullback resistance and could drop from this levle to the take profit.
Sell entry is at 1.3390, which is a pullback resistance.
Stop loss is at 1.3459, which is a pullback resistance.
Take profit is at 1.3269, which is a pullback resistance that is slightly above the 100% Fibonacci projection.
High Risk Investment Warning
Trading Forex/CFDs on margin carries a high level of risk and may not be suitable for all investors. Leverage can work against you.
Stratos Markets Limited (tradu.com ):
CFDs are complex instruments and come with a high risk of losing money rapidly due to leverage. 65% of retail investor accounts lose money when trading CFDs with this provider. You should consider whether you understand how CFDs work and whether you can afford to take the high risk of losing your money.
Stratos Europe Ltd (tradu.com ):
CFDs are complex instruments and come with a high risk of losing money rapidly due to leverage. 66% of retail investor accounts lose money when trading CFDs with this provider. You should consider whether you understand how CFDs work and whether you can afford to take the high risk of losing your money.
Stratos Global LLC (tradu.com ):
Losses can exceed deposits.
Please be advised that the information presented on TradingView is provided to Tradu (‘Company’, ‘we’) by a third-party provider (‘TFA Global Pte Ltd’). Please be reminded that you are solely responsible for the trading decisions on your account. There is a very high degree of risk involved in trading. Any information and/or content is intended entirely for research, educational and informational purposes only and does not constitute investment or consultation advice or investment strategy. The information is not tailored to the investment needs of any specific person and therefore does not involve a consideration of any of the investment objectives, financial situation or needs of any viewer that may receive it. Kindly also note that past performance is not a reliable indicator of future results. Actual results may differ materially from those anticipated in forward-looking or past performance statements. We assume no liability as to the accuracy or completeness of any of the information and/or content provided herein and the Company cannot be held responsible for any omission, mistake nor for any loss or damage including without limitation to any loss of profit which may arise from reliance on any information supplied by TFA Global Pte Ltd.
The speaker(s) is neither an employee, agent nor representative of Tradu and is therefore acting independently. The opinions given are their own, constitute general market commentary, and do not constitute the opinion or advice of Tradu or any form of personal or investment advice. Tradu neither endorses nor guarantees offerings of third-party speakers, nor is Tradu responsible for the content, veracity or opinions of third-party speakers, presenters or participants.

DOGEUSD H4 | bearish drop offfBased on the H4 chart analysis, we could see the price rise to the sell entry which is an overlap resistance and could potentially drop from this level to the downside.
Sell entry is at 0.23848, which is an overlap resistance.
Stop loss is at 0.25869, which is a pullback resistance.
Take profit is at 0.20629, which is a pullback support.
High Risk Investment Warning
Trading Forex/CFDs on margin carries a high level of risk and may not be suitable for all investors. Leverage can work against you.
Stratos Markets Limited (tradu.com ):
CFDs are complex instruments and come with a high risk of losing money rapidly due to leverage. 65% of retail investor accounts lose money when trading CFDs with this provider. You should consider whether you understand how CFDs work and whether you can afford to take the high risk of losing your money.
Stratos Europe Ltd (tradu.com ):
CFDs are complex instruments and come with a high risk of losing money rapidly due to leverage. 66% of retail investor accounts lose money when trading CFDs with this provider. You should consider whether you understand how CFDs work and whether you can afford to take the high risk of losing your money.
Stratos Global LLC (tradu.com ):
Losses can exceed deposits.
Please be advised that the information presented on TradingView is provided to Tradu (‘Company’, ‘we’) by a third-party provider (‘TFA Global Pte Ltd’). Please be reminded that you are solely responsible for the trading decisions on your account. There is a very high degree of risk involved in trading. Any information and/or content is intended entirely for research, educational and informational purposes only and does not constitute investment or consultation advice or investment strategy. The information is not tailored to the investment needs of any specific person and therefore does not involve a consideration of any of the investment objectives, financial situation or needs of any viewer that may receive it. Kindly also note that past performance is not a reliable indicator of future results. Actual results may differ materially from those anticipated in forward-looking or past performance statements. We assume no liability as to the accuracy or completeness of any of the information and/or content provided herein and the Company cannot be held responsible for any omission, mistake nor for any loss or damage including without limitation to any loss of profit which may arise from reliance on any information supplied by TFA Global Pte Ltd.
The speaker(s) is neither an employee, agent nor representative of Tradu and is therefore acting independently. The opinions given are their own, constitute general market commentary, and do not constitute the opinion or advice of Tradu or any form of personal or investment advice. Tradu neither endorses nor guarantees offerings of third-party speakers, nor is Tradu responsible for the content, veracity or opinions of third-party speakers, presenters or participants.

EURUSD H4 | Bullish reversalEUR/USD is falling towards the buy entry which is a pullback support and oculd bounce from this level to the take profit.
Buy entry is at 1.1616, whichis a pullback support.
Stop loss is at 1.1537, which is a pullback support.
Take profit is at 1.1729, which is a pullback resistance that aligns with the 50% Fibonacci retracement.
High Risk Investment Warning
Trading Forex/CFDs on margin carries a high level of risk and may not be suitable for all investors. Leverage can work against you.
Stratos Markets Limited (tradu.com ):
CFDs are complex instruments and come with a high risk of losing money rapidly due to leverage. 65% of retail investor accounts lose money when trading CFDs with this provider. You should consider whether you understand how CFDs work and whether you can afford to take the high risk of losing your money.
Stratos Europe Ltd (tradu.com ):
CFDs are complex instruments and come with a high risk of losing money rapidly due to leverage. 66% of retail investor accounts lose money when trading CFDs with this provider. You should consider whether you understand how CFDs work and whether you can afford to take the high risk of losing your money.
Stratos Global LLC (tradu.com ):
Losses can exceed deposits.
Please be advised that the information presented on TradingView is provided to Tradu (‘Company’, ‘we’) by a third-party provider (‘TFA Global Pte Ltd’). Please be reminded that you are solely responsible for the trading decisions on your account. There is a very high degree of risk involved in trading. Any information and/or content is intended entirely for research, educational and informational purposes only and does not constitute investment or consultation advice or investment strategy. The information is not tailored to the investment needs of any specific person and therefore does not involve a consideration of any of the investment objectives, financial situation or needs of any viewer that may receive it. Kindly also note that past performance is not a reliable indicator of future results. Actual results may differ materially from those anticipated in forward-looking or past performance statements. We assume no liability as to the accuracy or completeness of any of the information and/or content provided herein and the Company cannot be held responsible for any omission, mistake nor for any loss or damage including without limitation to any loss of profit which may arise from reliance on any information supplied by TFA Global Pte Ltd.
The speaker(s) is neither an employee, agent nor representative of Tradu and is therefore acting independently. The opinions given are their own, constitute general market commentary, and do not constitute the opinion or advice of Tradu or any form of personal or investment advice. Tradu neither endorses nor guarantees offerings of third-party speakers, nor is Tradu responsible for the content, veracity or opinions of third-party speakers, presenters or participants.

BNBUSD H1 | Bearish dropBNB/USD is rising towards the sell entry which is a pullback resistance that lines up with the 38.2% Fibonacci retracement and could reverse from this level to the downside.
Sell entry is at 968.90, which is a pullback resistance that lines up with the 38.2% Fibonacci retracement.
Stop loss is at 999.86, which is a pullback resistance that aligns with the 61.8% Fibonacci retracement.
Take profit is at 908.57, which is a pullback support.
High Risk Investment Warning
Trading Forex/CFDs on margin carries a high level of risk and may not be suitable for all investors. Leverage can work against you.
Stratos Markets Limited (tradu.com ):
CFDs are complex instruments and come with a high risk of losing money rapidly due to leverage. 65% of retail investor accounts lose money when trading CFDs with this provider. You should consider whether you understand how CFDs work and whether you can afford to take the high risk of losing your money.
Stratos Europe Ltd (tradu.com ):
CFDs are complex instruments and come with a high risk of losing money rapidly due to leverage. 66% of retail investor accounts lose money when trading CFDs with this provider. You should consider whether you understand how CFDs work and whether you can afford to take the high risk of losing your money.
Stratos Global LLC (tradu.com ):
Losses can exceed deposits.
Please be advised that the information presented on TradingView is provided to Tradu (‘Company’, ‘we’) by a third-party provider (‘TFA Global Pte Ltd’). Please be reminded that you are solely responsible for the trading decisions on your account. There is a very high degree of risk involved in trading. Any information and/or content is intended entirely for research, educational and informational purposes only and does not constitute investment or consultation advice or investment strategy. The information is not tailored to the investment needs of any specific person and therefore does not involve a consideration of any of the investment objectives, financial situation or needs of any viewer that may receive it. Kindly also note that past performance is not a reliable indicator of future results. Actual results may differ materially from those anticipated in forward-looking or past performance statements. We assume no liability as to the accuracy or completeness of any of the information and/or content provided herein and the Company cannot be held responsible for any omission, mistake nor for any loss or damage including without limitation to any loss of profit which may arise from reliance on any information supplied by TFA Global Pte Ltd.
The speaker(s) is neither an employee, agent nor representative of Tradu and is therefore acting independently. The opinions given are their own, constitute general market commentary, and do not constitute the opinion or advice of Tradu or any form of personal or investment advice. Tradu neither endorses nor guarantees offerings of third-party speakers, nor is Tradu responsible for the content, veracity or opinions of third-party speakers, presenters or participants.

Heading into pullback resistance?The Aussie (AUD/USD) is rising towards the pivot and could reverse to the pullback support that lines up with the 78.6% Fibonacci retracement.
Pivot: 0.6577
1st Support: 0.6485
1st Resistance: 0.6637
Disclaimer:
The above opinions given constitute general market commentary, and do not constitute the opinion or advice of IC Markets or any form of personal or investment advice.
Any opinions, news, research, analyses, prices, other information, or links to third-party sites contained on this website are provided on an "as-is" basis, are intended only to be informative, is not an advice nor a recommendation, nor research, or a record of our trading prices, or an offer of, or solicitation for a transaction in any financial instrument and thus should not be treated as such. The information provided does not involve any specific investment objectives, financial situation and needs of any specific person who may receive it. Please be aware, that past performance is not a reliable indicator of future performance and/or results. Past Performance or Forward-looking scenarios based upon the reasonable beliefs of the third-party provider are not a guarantee of future performance. Actual results may differ materially from those anticipated in forward-looking or past performance statements. IC Markets makes no representation or warranty and assumes no liability as to the accuracy or completeness of the information provided, nor any loss arising from any investment based on a recommendation, forecast or any information supplied by any third-party.
