Bullish bounce for the Gold?The price is falling towards the pivot and could bounce to the 1st resistance which acts as a swing high resistance.
Pivot: 3,699.30
1st Support: 3,654.40
1st Resistance: 3,784.06
Disclaimer:
The above opinions given constitute general market commentary, and do not constitute the opinion or advice of IC Markets or any form of personal or investment advice.
Any opinions, news, research, analyses, prices, other information, or links to third-party sites contained on this website are provided on an "as-is" basis, are intended only to be informative, is not an advice nor a recommendation, nor research, or a record of our trading prices, or an offer of, or solicitation for a transaction in any financial instrument and thus should not be treated as such. The information provided does not involve any specific investment objectives, financial situation and needs of any specific person who may receive it. Please be aware, that past performance is not a reliable indicator of future performance and/or results. Past Performance or Forward-looking scenarios based upon the reasonable beliefs of the third-party provider are not a guarantee of future performance. Actual results may differ materially from those anticipated in forward-looking or past performance statements. IC Markets makes no representation or warranty and assumes no liability as to the accuracy or completeness of the information provided, nor any loss arising from any investment based on a recommendation, forecast or any information supplied by any third-party.
J-USD

USD/CAD Head and Shoulders patternA clear Head and Shoulders formation has developed. Left Shoulder (~1.3850), Head (~1.3950), and Right Shoulder (~1.3850). Price is now retesting the neckline zone around 1.3730–1.3750.
Normally this pattern formed when it's end of a trend.
So its safer to wait until the break of the support and establishing below the Resistance to enter.

Gold Futures – Pullback Into H4 Supply Before Drop to Demand?Price sold off strongly from 3812 resistance and is now correcting higher. On the H4, I see a bearish supply zone between 3791.4–3769.9, which aligns with prior POC acceptance around 3790. If price pulls back into this area and fails, I expect continuation lower into the H4 demand zone at 3746.3–3735.2, which also lines up with Daily Low (DL) and Weekly High (WH) liquidity markers.
Levels to Watch:
Bearish H4 Supply: 3791.4–3769.9
Bullish H4 Demand: 3746.3–3735.2
Invalidation: Break & hold above 3795 could target 3812 liquidity.
Targets: First 3746.3, extended 3735.2.
Bias: Bearish pullback scenario into supply → downside continuation.

USD/JPY - Bank of Japan Holds Rates, Inflation RisingFX:USDJPY #USDJPY #Forex #Trading #FXAnalysis #TechnicalAnalysis #PriceAction #BankOfJapan #ForexTrader #DayTrading #SwingTrading
The Bank of Japan kept interest rates unchanged while raising its inflation forecast. This signals caution but also optimism that cooperation with the U.S. could help stabilize Japan’s economy.
On the chart, we see key demand zones (red) holding as potential support, with upside targets toward 148.700 – 149.200 (green key zones). If price sustains above the demand area, bullish momentum could push USD/JPY higher into these resistance levels.
Traders should watch for confirmation signals around support before entering long positions.
👍 Support with a like & drop your thoughts in the comments!
⚠️ Disclaimer: This analysis is for educational purposes only and should not be considered financial advice. Always do your own research before making trading decisions.

USD/JPY - Bullish Channel, Next Targeting 148.95 (23.09.2025)#USDJPY #Forex #Trading #TechnicalAnalysis
USD/JPY is trading within a Bullish Channel Pattern on the 30M chart, holding above the rising trendline support. The pair is bouncing from the support zone (147.50 – 147.70), signaling potential upside continuation.
🔹 Market Structure:
Bullish channel intact with higher highs & higher lows.
Price rejected the support zone and trendline.
Momentum suggests buyers could retest upper channel resistance.
🔹 Key Levels:
Support Zone: 147.50 – 147.70
1st Resistance: 148.58
2nd Resistance: 148.95
📈 Trading Idea:
As long as USD/JPY stays above the support zone, bulls may drive price higher toward 148.58 → 148.95.
⚠️ Invalidation:
A break below 147.50 would weaken the bullish outlook.
“Discipline + Patience = Consistency 🔑”

EURUSD Pullback Toward 1.17400 as DXY Struggles Below 99Hey Traders, in today's trading session we are monitoring EURUSD for a buying opportunity around the 1.17400 zone. The pair is trading in an uptrend, with price currently correcting toward this key support/resistance level.
Structure: The broader bias remains bullish, but price is pulling back after recent highs.
Key level in focus: 1.17400 — a significant zone where buyers may look to rejoin the trend.
Fundamentals: The U.S. Dollar Index (DXY) remains in a downtrend and is correcting toward the 99.000 resistance area. If DXY fails to break higher, it could reinforce USD weakness and support a bullish continuation in EURUSD.
Trade safe,
Joe.

EUR/USD Trend Watch – Critical Supports & ResistanceEUR/USD Update
On the low time frame, EUR/USD is moving sideways around 1.1780, holding just below the 1.1810 zone.
Key levels:
1.1810 – 1.1846 → resistance zone. A breakout and hold above would confirm bullish continuation toward 1.1922.
1.1774 → immediate support on the low time frame. Losing this level increases pressure on the main trend.
Upside scenario: If EUR/USD can reclaim 1.1810+, momentum may shift bullish, with the next target at 1.1922.
Downside risk: Failure to hold above 1.1774 opens the door for a correction toward 1.1660 and possibly 1.1568 – 1.1530 cycle support.
Cycle support: 1.1530 – 1.1568 remains the must-hold long-term zone to keep the bullish cycle alive.
📌 Summary
Above 1.1810 – 1.1846 → bullish continuation toward 1.1922.
Below 1.1774 → risk of deeper correction, watch 1.1660 next.
Cycle zone 1.1530 – 1.1568 → critical long-term support.

Will USD/CAD Finally Respect the PRZ?Price is pressing right into a Potential Reversal Zone (PRZ) that lines up perfectly with an AB=CD completion and a long-standing resistance shelf on the 1-hour chart.
The market has been grinding higher for days, but the structure is hinting that the next decisive move may be down—not up.
Here’s why I’m interested, but still waiting for confirmation before pulling the trigger.
🔍 Technical Setup
Pair / TF: USD/CAD – 1 Hour
Trend: Short-term bullish, but extended and showing fatigue
Pattern: AB=CD harmonic completion (no other harmonic pattern)
Key Zones:
PRZ / Resistance: 1.3865 – 1.3875
Support / Trigger area: 1.3830
Structure Clue: If price breaks the latest Higher Low (HL) and prints a fresh Lower Low (LL), it signals that buyers are losing grip and sellers may step in with force.
Divergence: RSI(14) shows bearish divergence (price making higher highs while RSI makes lower highs) — a classic early-warning sign that upside momentum is fading.
🌐 Sentiment & Fundamentals
Retail Sentiment (myfxbook): 32 % short / 68 % long → majority long means there’s fuel for a quick stop-driven drop if price reverses.
USD Index (DXY): bearish bias after recent Fed remarks about a slower pace of hikes and cooling inflation signals.
CAD Index: bullish tone, supported by firm crude oil demand and a Bank of Canada still talking hawkish.
Macro Backdrop:
US–Canada 2-year yield spread has narrowed slightly, favoring CAD strength.
Crude oil holding above key supports strengthens the Canadian dollar further.
These fundamental drivers add conviction to a bearish bias if technical confirmation appears.
🛠️ Trade Plan (only if conditions trigger)
Entry (Sell Stop): 1.38308 — waiting for HL break and a clean LL close to confirm sellers in control.
Stop Loss: 1.38584 (just above PRZ and recent highs).
Target (TP1): 1.38032
Position Size: 0.5 lot (on ~USD 10 K account).
Risk/Reward: 1 : 1 (~$100 risk for ~$100 reward).
Risk Management: If price never breaks HL and instead keeps climbing, no trade is taken — capital stays safe.
🎯 Bias
Although the short-term trend is still technically up, the confluence of PRZ resistance, AB=CD completion, bearish RSI divergence, bearish USD index, and bullish CAD index keeps my bias cautiously bearish — but only with breakdown confirmation.
💡 Takeaway
This is a wait-for-breakdown idea, not a blind short.
If price slices through 1.3830, the door opens for a quick momentum drop toward 1.3810 (and possibly 1.3785 if oil strength continues).
If it doesn’t, I stay flat and safe.
💬 Share Your View
What’s your take on USD/CAD here? Drop your thoughts in the comments and let’s discuss the levels.
✅ Follow me for more trade ideas and signals — stay ahead of key setups like this one.
⚠️ Disclaimer
This analysis is for educational purposes only and does not constitute financial advice.
Trading involves risk — always do your own research and manage risk carefully. Past performance ≠ future results.
#USDCAD #forex #forextrading #fxtrader #priceaction #technicalanalysis #fundamentalanalysis #ABCDpattern #harmonicpattern #RSIdivergence #bearishdivergence #PRZ #potentialreversalzone #supportandresistance #chartanalysis #tradingsetup #tradeplan #riskmanagement #forexsignals #forexstrategy #currencytrading #majorpairs #dxy #crudeoil #canadiandollar #usdollar #tradingview #marketanalysis #daytrader #swingtrader #priceactiontrader #smartmoneyconcepts #liquiditygrab #lowerlow #higherlow #bearishsetup #shortsetup #fxsignals #forexeducation #tradewithplan #waitforconfirmation

USDCAD H1 | Bullish continuationUSD/CAD has bounced off the buy entry which is a pullback support and could potentially rise from this level to the upside.
Buy entry is at 1.3829, which is a pullback support.
Stop loss is at 1.3808, which is a pullback support.
Take profit is at 1.3867, which is a pullback resistance that lines up with the 161.8% Fibonacci extension.
High Risk Investment Warning
Trading Forex/CFDs on margin carries a high level of risk and may not be suitable for all investors. Leverage can work against you.
Stratos Markets Limited (tradu.com ):
CFDs are complex instruments and come with a high risk of losing money rapidly due to leverage. 65% of retail investor accounts lose money when trading CFDs with this provider. You should consider whether you understand how CFDs work and whether you can afford to take the high risk of losing your money.
Stratos Europe Ltd (tradu.com ):
CFDs are complex instruments and come with a high risk of losing money rapidly due to leverage. 66% of retail investor accounts lose money when trading CFDs with this provider. You should consider whether you understand how CFDs work and whether you can afford to take the high risk of losing your money.
Stratos Global LLC (tradu.com ):
Losses can exceed deposits.
Please be advised that the information presented on TradingView is provided to Tradu (‘Company’, ‘we’) by a third-party provider (‘TFA Global Pte Ltd’). Please be reminded that you are solely responsible for the trading decisions on your account. There is a very high degree of risk involved in trading. Any information and/or content is intended entirely for research, educational and informational purposes only and does not constitute investment or consultation advice or investment strategy. The information is not tailored to the investment needs of any specific person and therefore does not involve a consideration of any of the investment objectives, financial situation or needs of any viewer that may receive it. Kindly also note that past performance is not a reliable indicator of future results. Actual results may differ materially from those anticipated in forward-looking or past performance statements. We assume no liability as to the accuracy or completeness of any of the information and/or content provided herein and the Company cannot be held responsible for any omission, mistake nor for any loss or damage including without limitation to any loss of profit which may arise from reliance on any information supplied by TFA Global Pte Ltd.
The speaker(s) is neither an employee, agent nor representative of Tradu and is therefore acting independently. The opinions given are their own, constitute general market commentary, and do not constitute the opinion or advice of Tradu or any form of personal or investment advice. Tradu neither endorses nor guarantees offerings of third-party speakers, nor is Tradu responsible for the content, veracity or opinions of third-party speakers, presenters or participants.

NZDUSD H1 | Could the kiwi drop from here?Based on the H1 chart analysis, we could see the price rise to the sell entry which acts as an overlap resistance that aligns with the 23.6% Fibonacci retracement and could drop from this level to the downside.
Sell entry is at 0.5883, which is an overlap resistance that aligns with the 23.6% Fibonacci retracement.
Stop loss is at 0.5921, which is a pullback resistance that lines up with the 50% Fibonacci retracement.
Take profit is at 0.5835, which is a swing low support.
High Risk Investment Warning
Trading Forex/CFDs on margin carries a high level of risk and may not be suitable for all investors. Leverage can work against you.
Stratos Markets Limited (tradu.com ):
CFDs are complex instruments and come with a high risk of losing money rapidly due to leverage. 65% of retail investor accounts lose money when trading CFDs with this provider. You should consider whether you understand how CFDs work and whether you can afford to take the high risk of losing your money.
Stratos Europe Ltd (tradu.com ):
CFDs are complex instruments and come with a high risk of losing money rapidly due to leverage. 66% of retail investor accounts lose money when trading CFDs with this provider. You should consider whether you understand how CFDs work and whether you can afford to take the high risk of losing your money.
Stratos Global LLC (tradu.com ):
Losses can exceed deposits.
Please be advised that the information presented on TradingView is provided to Tradu (‘Company’, ‘we’) by a third-party provider (‘TFA Global Pte Ltd’). Please be reminded that you are solely responsible for the trading decisions on your account. There is a very high degree of risk involved in trading. Any information and/or content is intended entirely for research, educational and informational purposes only and does not constitute investment or consultation advice or investment strategy. The information is not tailored to the investment needs of any specific person and therefore does not involve a consideration of any of the investment objectives, financial situation or needs of any viewer that may receive it. Kindly also note that past performance is not a reliable indicator of future results. Actual results may differ materially from those anticipated in forward-looking or past performance statements. We assume no liability as to the accuracy or completeness of any of the information and/or content provided herein and the Company cannot be held responsible for any omission, mistake nor for any loss or damage including without limitation to any loss of profit which may arise from reliance on any information supplied by TFA Global Pte Ltd.
The speaker(s) is neither an employee, agent nor representative of Tradu and is therefore acting independently. The opinions given are their own, constitute general market commentary, and do not constitute the opinion or advice of Tradu or any form of personal or investment advice. Tradu neither endorses nor guarantees offerings of third-party speakers, nor is Tradu responsible for the content, veracity or opinions of third-party speakers, presenters or participants.

AUDUSD H1 | Bullish bounceThe Aussie (AUD/USD) is falling towards the buy entry which is a pullback support and could bounce from this level to the upside.
Buy entry is at 0.6607, which is a pullback support.
Stop loss is at 0.6582, which is a pullback support.
Take profit is at 0.6654, which is an overlap resistance that lines up with the 61.8% Fibonacci retracement.
High Risk Investment Warning
Trading Forex/CFDs on margin carries a high level of risk and may not be suitable for all investors. Leverage can work against you.
Stratos Markets Limited (tradu.com ):
CFDs are complex instruments and come with a high risk of losing money rapidly due to leverage. 65% of retail investor accounts lose money when trading CFDs with this provider. You should consider whether you understand how CFDs work and whether you can afford to take the high risk of losing your money.
Stratos Europe Ltd (tradu.com ):
CFDs are complex instruments and come with a high risk of losing money rapidly due to leverage. 66% of retail investor accounts lose money when trading CFDs with this provider. You should consider whether you understand how CFDs work and whether you can afford to take the high risk of losing your money.
Stratos Global LLC (tradu.com ):
Losses can exceed deposits.
Please be advised that the information presented on TradingView is provided to Tradu (‘Company’, ‘we’) by a third-party provider (‘TFA Global Pte Ltd’). Please be reminded that you are solely responsible for the trading decisions on your account. There is a very high degree of risk involved in trading. Any information and/or content is intended entirely for research, educational and informational purposes only and does not constitute investment or consultation advice or investment strategy. The information is not tailored to the investment needs of any specific person and therefore does not involve a consideration of any of the investment objectives, financial situation or needs of any viewer that may receive it. Kindly also note that past performance is not a reliable indicator of future results. Actual results may differ materially from those anticipated in forward-looking or past performance statements. We assume no liability as to the accuracy or completeness of any of the information and/or content provided herein and the Company cannot be held responsible for any omission, mistake nor for any loss or damage including without limitation to any loss of profit which may arise from reliance on any information supplied by TFA Global Pte Ltd.
The speaker(s) is neither an employee, agent nor representative of Tradu and is therefore acting independently. The opinions given are their own, constitute general market commentary, and do not constitute the opinion or advice of Tradu or any form of personal or investment advice. Tradu neither endorses nor guarantees offerings of third-party speakers, nor is Tradu responsible for the content, veracity or opinions of third-party speakers, presenters or participants.

USDJPY H4 | Bullish bounce offUSD/JPY has bounced off the buy entry which is a pullback support and could potentially rise from this level eot the take profit.
Buy entry is at 147.45, which is a pullback support.
Stop loss is at 146.61, which is a pullback support that lines up with the 61.8% Fibonacci retracement.
Take profit is at 148.75, which his a multi swing high resistance that lines up with the 127.2% Fibonacci extension.
High Risk Investment Warning
Trading Forex/CFDs on margin carries a high level of risk and may not be suitable for all investors. Leverage can work against you.
Stratos Markets Limited (tradu.com ):
CFDs are complex instruments and come with a high risk of losing money rapidly due to leverage. 65% of retail investor accounts lose money when trading CFDs with this provider. You should consider whether you understand how CFDs work and whether you can afford to take the high risk of losing your money.
Stratos Europe Ltd (tradu.com ):
CFDs are complex instruments and come with a high risk of losing money rapidly due to leverage. 66% of retail investor accounts lose money when trading CFDs with this provider. You should consider whether you understand how CFDs work and whether you can afford to take the high risk of losing your money.
Stratos Global LLC (tradu.com ):
Losses can exceed deposits.
Please be advised that the information presented on TradingView is provided to Tradu (‘Company’, ‘we’) by a third-party provider (‘TFA Global Pte Ltd’). Please be reminded that you are solely responsible for the trading decisions on your account. There is a very high degree of risk involved in trading. Any information and/or content is intended entirely for research, educational and informational purposes only and does not constitute investment or consultation advice or investment strategy. The information is not tailored to the investment needs of any specific person and therefore does not involve a consideration of any of the investment objectives, financial situation or needs of any viewer that may receive it. Kindly also note that past performance is not a reliable indicator of future results. Actual results may differ materially from those anticipated in forward-looking or past performance statements. We assume no liability as to the accuracy or completeness of any of the information and/or content provided herein and the Company cannot be held responsible for any omission, mistake nor for any loss or damage including without limitation to any loss of profit which may arise from reliance on any information supplied by TFA Global Pte Ltd.
The speaker(s) is neither an employee, agent nor representative of Tradu and is therefore acting independently. The opinions given are their own, constitute general market commentary, and do not constitute the opinion or advice of Tradu or any form of personal or investment advice. Tradu neither endorses nor guarantees offerings of third-party speakers, nor is Tradu responsible for the content, veracity or opinions of third-party speakers, presenters or participants.

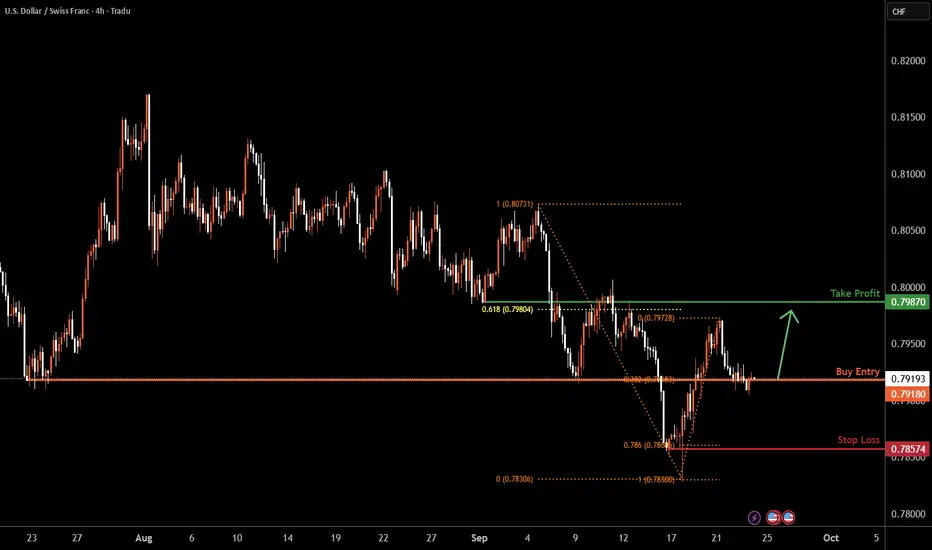
USDCHF H4 | Bullish reversal off 38.2% Fibonacci supportBased on the H4 chart analysis, we can see that the price is reacting off the buy entry which is a pullback support that aligns with the 38.2% Fibonacci retracement and could bounce from this level to the upside.
Buy entry is at 0.7918, which is a pullback support that aligns with the 38.2% Fibonacci retracement.
Stop loss is at 0.7857, which is a pullback support that lines up with the 78.6% Fibonacci retracement.
Take profit is at 0.7987, which is an overlap resistance that is slightly above the 61.8% Fibonacci retracement.
High Risk Investment Warning
Trading Forex/CFDs on margin carries a high level of risk and may not be suitable for all investors. Leverage can work against you.
Stratos Markets Limited (tradu.com ):
CFDs are complex instruments and come with a high risk of losing money rapidly due to leverage. 65% of retail investor accounts lose money when trading CFDs with this provider. You should consider whether you understand how CFDs work and whether you can afford to take the high risk of losing your money.
Stratos Europe Ltd (tradu.com ):
CFDs are complex instruments and come with a high risk of losing money rapidly due to leverage. 66% of retail investor accounts lose money when trading CFDs with this provider. You should consider whether you understand how CFDs work and whether you can afford to take the high risk of losing your money.
Stratos Global LLC (tradu.com ):
Losses can exceed deposits.
Please be advised that the information presented on TradingView is provided to Tradu (‘Company’, ‘we’) by a third-party provider (‘TFA Global Pte Ltd’). Please be reminded that you are solely responsible for the trading decisions on your account. There is a very high degree of risk involved in trading. Any information and/or content is intended entirely for research, educational and informational purposes only and does not constitute investment or consultation advice or investment strategy. The information is not tailored to the investment needs of any specific person and therefore does not involve a consideration of any of the investment objectives, financial situation or needs of any viewer that may receive it. Kindly also note that past performance is not a reliable indicator of future results. Actual results may differ materially from those anticipated in forward-looking or past performance statements. We assume no liability as to the accuracy or completeness of any of the information and/or content provided herein and the Company cannot be held responsible for any omission, mistake nor for any loss or damage including without limitation to any loss of profit which may arise from reliance on any information supplied by TFA Global Pte Ltd.
The speaker(s) is neither an employee, agent nor representative of Tradu and is therefore acting independently. The opinions given are their own, constitute general market commentary, and do not constitute the opinion or advice of Tradu or any form of personal or investment advice. Tradu neither endorses nor guarantees offerings of third-party speakers, nor is Tradu responsible for the content, veracity or opinions of third-party speakers, presenters or participants.
GBPUSD H4 | Bearish reversal for the CableBased on the H4 chart analysis, we can see that the price is reacting off the sell entry which is a pullback resistance and could drop from this level to the downside.
Sell entry is at 1.3531, which is a pullback resistance.
Stop loss is at 1.3581, which is a pullback resistance that aligns with the 50% Fibonacci retracement.
Take profit is at 1.3417, which is a pullback support that aligns with the 78.6% Fibonacci retracement.
High Risk Investment Warning
Trading Forex/CFDs on margin carries a high level of risk and may not be suitable for all investors. Leverage can work against you.
Stratos Markets Limited (tradu.com ):
CFDs are complex instruments and come with a high risk of losing money rapidly due to leverage. 65% of retail investor accounts lose money when trading CFDs with this provider. You should consider whether you understand how CFDs work and whether you can afford to take the high risk of losing your money.
Stratos Europe Ltd (tradu.com ):
CFDs are complex instruments and come with a high risk of losing money rapidly due to leverage. 66% of retail investor accounts lose money when trading CFDs with this provider. You should consider whether you understand how CFDs work and whether you can afford to take the high risk of losing your money.
Stratos Global LLC (tradu.com ):
Losses can exceed deposits.
Please be advised that the information presented on TradingView is provided to Tradu (‘Company’, ‘we’) by a third-party provider (‘TFA Global Pte Ltd’). Please be reminded that you are solely responsible for the trading decisions on your account. There is a very high degree of risk involved in trading. Any information and/or content is intended entirely for research, educational and informational purposes only and does not constitute investment or consultation advice or investment strategy. The information is not tailored to the investment needs of any specific person and therefore does not involve a consideration of any of the investment objectives, financial situation or needs of any viewer that may receive it. Kindly also note that past performance is not a reliable indicator of future results. Actual results may differ materially from those anticipated in forward-looking or past performance statements. We assume no liability as to the accuracy or completeness of any of the information and/or content provided herein and the Company cannot be held responsible for any omission, mistake nor for any loss or damage including without limitation to any loss of profit which may arise from reliance on any information supplied by TFA Global Pte Ltd.
The speaker(s) is neither an employee, agent nor representative of Tradu and is therefore acting independently. The opinions given are their own, constitute general market commentary, and do not constitute the opinion or advice of Tradu or any form of personal or investment advice. Tradu neither endorses nor guarantees offerings of third-party speakers, nor is Tradu responsible for the content, veracity or opinions of third-party speakers, presenters or participants.

EURUSD H4 | Bearish reversalBased on the H4 chart analysis, we can see that the price is reacting off the sell entry which is a pullback resistance that aligns with the 50% Fibonacci retracement and could reverse from this level to the take profit.
Sell entry is at 1.1815, which is a pullback resistance that aligns with the 50% Fibonacci retracement.
Stop loss is at 1.1867, which is a pullback resistance.
Take profit is at 1.1737, which is a pullback support.
High Risk Investment Warning
Trading Forex/CFDs on margin carries a high level of risk and may not be suitable for all investors. Leverage can work against you.
Stratos Markets Limited (tradu.com ):
CFDs are complex instruments and come with a high risk of losing money rapidly due to leverage. 65% of retail investor accounts lose money when trading CFDs with this provider. You should consider whether you understand how CFDs work and whether you can afford to take the high risk of losing your money.
Stratos Europe Ltd (tradu.com ):
CFDs are complex instruments and come with a high risk of losing money rapidly due to leverage. 66% of retail investor accounts lose money when trading CFDs with this provider. You should consider whether you understand how CFDs work and whether you can afford to take the high risk of losing your money.
Stratos Global LLC (tradu.com ):
Losses can exceed deposits.
Please be advised that the information presented on TradingView is provided to Tradu (‘Company’, ‘we’) by a third-party provider (‘TFA Global Pte Ltd’). Please be reminded that you are solely responsible for the trading decisions on your account. There is a very high degree of risk involved in trading. Any information and/or content is intended entirely for research, educational and informational purposes only and does not constitute investment or consultation advice or investment strategy. The information is not tailored to the investment needs of any specific person and therefore does not involve a consideration of any of the investment objectives, financial situation or needs of any viewer that may receive it. Kindly also note that past performance is not a reliable indicator of future results. Actual results may differ materially from those anticipated in forward-looking or past performance statements. We assume no liability as to the accuracy or completeness of any of the information and/or content provided herein and the Company cannot be held responsible for any omission, mistake nor for any loss or damage including without limitation to any loss of profit which may arise from reliance on any information supplied by TFA Global Pte Ltd.
The speaker(s) is neither an employee, agent nor representative of Tradu and is therefore acting independently. The opinions given are their own, constitute general market commentary, and do not constitute the opinion or advice of Tradu or any form of personal or investment advice. Tradu neither endorses nor guarantees offerings of third-party speakers, nor is Tradu responsible for the content, veracity or opinions of third-party speakers, presenters or participants.

Could we see a bullish reversal from here?The Bitcoin (BTC/USD) is reacting off the pivot which is a pullback support that aligns with the 61.8% Fibonacci retracement and could rise to the 1st resistance which acts as a pullback resistance.
Pivot: 111,273.51
1st Support: 109,394.29
1st Resistance: 114,518.42
Disclaimer:
The above opinions given constitute general market commentary, and do not constitute the opinion or advice of IC Markets or any form of personal or investment advice.
Any opinions, news, research, analyses, prices, other information, or links to third-party sites contained on this website are provided on an "as-is" basis, are intended only to be informative, is not an advice nor a recommendation, nor research, or a record of our trading prices, or an offer of, or solicitation for a transaction in any financial instrument and thus should not be treated as such. The information provided does not involve any specific investment objectives, financial situation and needs of any specific person who may receive it. Please be aware, that past performance is not a reliable indicator of future performance and/or results. Past Performance or Forward-looking scenarios based upon the reasonable beliefs of the third-party provider are not a guarantee of future performance. Actual results may differ materially from those anticipated in forward-looking or past performance statements. IC Markets makes no representation or warranty and assumes no liability as to the accuracy or completeness of the information provided, nor any loss arising from any investment based on a recommendation, forecast or any information supplied by any third-party.

USD/JPY(20250924)Today's AnalysisMarket Analysis:
Federal Reserve Chairman Powell stated that the policy rate remains somewhat restrictive, but allows the Fed to better respond to potential economic developments; tariffs are expected to have a one-time pass-through effect; and decisions will "never be based on political considerations." Fed spokespersons noted that Powell's comments indicate that he believes interest rates remain tight, potentially opening the door for further rate cuts.
Technical Analysis:
Today's Buy/Sell Levels:
147.66
Support and Resistance Levels:
148.13
147.95
147.84
147.49
147.37
147.20
Trading Strategy:
If the market breaks above 147.84, consider entering a buy position, with the first target price being 148.13.
If the market breaks below 147.66, consider entering a sell position, with the first target price being 147.49.

Will Solana Break Above 250 After Its Pause?The Solana (SOLUSDT) market is entering an exciting phase, with price repeatedly testing key levels and forming a dramatic sideways range. After a strong rally, SOL is now consolidating within the 230–245 zone , where support and resistance are battling fiercely.
If the 230 level holds , it could serve as a launchpad for a move toward 242 (TP1) and potentially 250 (TP2) . Positive developments, such as major institutions accumulating SOL and the surge of stablecoin inflows on the network, continue to strengthen the long-term bullish outlook .
However, risks remain if SOL loses the 230 mark and breaks the trendline, which could trigger deeper corrections. In the short term, the market remains sideways, but the broader picture still points toward a potential breakout.
The big question: can SOL sustain its momentum and explode beyond 250, opening the door to a new rally?

ETH is Sinking Deep: Strong Downtrend and Big SELL Opportunity!Currently, ETH/USDT is under strong selling pressure due to both fundamental and technical factors . According to the latest news, over 2.6 million ETH (equivalent to about $11.7 billion ) is waiting to be withdrawn from the Ethereum network. When these ETH are released, it will create significant selling pressure, greatly affecting ETH's price in the short term. This could lead to investor anxiety and a potential sell-off, diminishing confidence in the market.
From a technical perspective , the chart shows a descending wedge, with lower highs and the current bottom becoming weak. It is highly likely that ETH will drop to the support level at $4,110 before making any new moves.
Given these factors, the appropriate trading strategy is to open a SELL order if the price cannot break through the resistance at $4,410 and falls below the support at $4,110. The Stop Loss should be placed at $4,450, just above the resistance, and Take Profit at $4,110.
In conclusion, ETH is facing a strong downtrend in the short term. Investors should keep an eye on the market and open a SELL order as the price continues to drop.

Bearish momentum to extend?USD/ZAR has rejected off the pivot and could drop to the 1st support.
Pivot: 17.38851
1st Support: 16.93263
1st Resistance: 17.55477
Disclaimer:
The above opinions given constitute general market commentary, and do not constitute the opinion or advice of IC Markets or any form of personal or investment advice.
Any opinions, news, research, analyses, prices, other information, or links to third-party sites contained on this website are provided on an "as-is" basis, are intended only to be informative, is not an advice nor a recommendation, nor research, or a record of our trading prices, or an offer of, or solicitation for a transaction in any financial instrument and thus should not be treated as such. The information provided does not involve any specific investment objectives, financial situation and needs of any specific person who may receive it. Please be aware, that past performance is not a reliable indicator of future performance and/or results. Past Performance or Forward-looking scenarios based upon the reasonable beliefs of the third-party provider are not a guarantee of future performance. Actual results may differ materially from those anticipated in forward-looking or past performance statements. IC Markets makes no representation or warranty and assumes no liability as to the accuracy or completeness of the information provided, nor any loss arising from any investment based on a recommendation, forecast or any information supplied by any third-party.

Bearish drop off pullback resistance?USD/JPY has rejected off the resistance level which is a pullback resistance and could drop from this level to our take profit.
Entry: 148.36
Why we like it:
There is a pullback resistance level.
Stop loss: 149.49
Why we like it:
There is a pullback resistance that is slightly below the 161.8% Fibonacci extension.
Take profit: 146.61
Why we like it:
There is a pullback support that aligns with the 61.8% Fibonacci retracement.
Enjoying your TradingView experience? Review us!
Please be advised that the information presented on TradingView is provided to Vantage (‘Vantage Global Limited’, ‘we’) by a third-party provider (‘Everest Fortune Group’). Please be reminded that you are solely responsible for the trading decisions on your account. There is a very high degree of risk involved in trading. Any information and/or content is intended entirely for research, educational and informational purposes only and does not constitute investment or consultation advice or investment strategy. The information is not tailored to the investment needs of any specific person and therefore does not involve a consideration of any of the investment objectives, financial situation or needs of any viewer that may receive it. Kindly also note that past performance is not a reliable indicator of future results. Actual results may differ materially from those anticipated in forward-looking or past performance statements. We assume no liability as to the accuracy or completeness of any of the information and/or content provided herein and the Company cannot be held responsible for any omission, mistake nor for any loss or damage including without limitation to any loss of profit which may arise from reliance on any information supplied by Everest Fortune Group.

Bearish drop off?USD/CHF has rejected off the resistance level which his an overlap resistance that aligns with the 61.8% Fibonacci retracement and could potentially drop from this level to our take profit.
Entry: 0.7978
Why we like it:
There is an overlap resistance that aligns with the 61.8% Fibonacci retracement.
Stop loss: 0.8031
Why we like it:
There is a pullback resistance level.
Take profit: 0.7851
Why we like it:
There is a swing low support level.
Enjoying your TradingView experience? Review us!
Please be advised that the information presented on TradingView is provided to Vantage (‘Vantage Global Limited’, ‘we’) by a third-party provider (‘Everest Fortune Group’). Please be reminded that you are solely responsible for the trading decisions on your account. There is a very high degree of risk involved in trading. Any information and/or content is intended entirely for research, educational and informational purposes only and does not constitute investment or consultation advice or investment strategy. The information is not tailored to the investment needs of any specific person and therefore does not involve a consideration of any of the investment objectives, financial situation or needs of any viewer that may receive it. Kindly also note that past performance is not a reliable indicator of future results. Actual results may differ materially from those anticipated in forward-looking or past performance statements. We assume no liability as to the accuracy or completeness of any of the information and/or content provided herein and the Company cannot be held responsible for any omission, mistake nor for any loss or damage including without limitation to any loss of profit which may arise from reliance on any information supplied by Everest Fortune Group.

Bearish reversal setup?GBPUSD is rising towards the resistance level which his a pullback resistance that aligns with the 50% Fibonacci retracement and could reverse from this level to our take profit.
Entry: 1.3584
Why we like it:
There is a pullback resistance that aligns with the 50% Fibonacci retracement.
Stop loss: 1.3666
Why we like it:
There is a pullback resistance level that lines up with the 78.6% Fibonacci retracement.
Take profit: 1.3394
Why we like it:
There is a pullback support level.
Enjoying your TradingView experience? Review us!
Please be advised that the information presented on TradingView is provided to Vantage (‘Vantage Global Limited’, ‘we’) by a third-party provider (‘Everest Fortune Group’). Please be reminded that you are solely responsible for the trading decisions on your account. There is a very high degree of risk involved in trading. Any information and/or content is intended entirely for research, educational and informational purposes only and does not constitute investment or consultation advice or investment strategy. The information is not tailored to the investment needs of any specific person and therefore does not involve a consideration of any of the investment objectives, financial situation or needs of any viewer that may receive it. Kindly also note that past performance is not a reliable indicator of future results. Actual results may differ materially from those anticipated in forward-looking or past performance statements. We assume no liability as to the accuracy or completeness of any of the information and/or content provided herein and the Company cannot be held responsible for any omission, mistake nor for any loss or damage including without limitation to any loss of profit which may arise from reliance on any information supplied by Everest Fortune Group.
