GOLD => $4000 The MagnetGold has been pushing higher within its bullish log-chart structure, moving inside two rising channels (red short-term and blue long-term).
The interesting part? The $4000 level is acting like a magnet, and it happens to intersect with the upper bound of both channels. This rare confluence makes $4000 a key level to watch.
As long as the bullish momentum holds, Gold remains on track toward this magnet level. But once there, the reaction will be critical, a clean breakout could open the door for fresh highs, while a rejection may trigger a correction before continuation.
⚠️ Disclaimer: This is not financial advice. Always do your own research and manage risk properly.
📚 Stick to your trading plan regarding entries, risk, and management.
Good luck! 🍀
All Strategies Are Good; If Managed Properly!
~Richard Nasr
J-XAU

XAUUSD H1 Bullish Momentum Likely to ExtendGold (XAU/USD) has bounced off the buy entry at 3,854.03, which is a pullback support that lines up with the 38.2% Fibonacci retracement and could bounce from this level to the take profit.
Stop loss is at 3,831.23, which is a pullback support that aligns with the 61.8% Fibonacci retracement.
Take profit is at 3,893.04, which is a swing high resistance.
High Risk Investment Warning
Trading Forex/CFDs on margin carries a high level of risk and may not be suitable for all investors. Leverage can work against you.
Stratos Markets Limited (tradu.com ):
CFDs are complex instruments and come with a high risk of losing money rapidly due to leverage. 65% of retail investor accounts lose money when trading CFDs with this provider. You should consider whether you understand how CFDs work and whether you can afford to take the high risk of losing your money.
Stratos Europe Ltd (tradu.com ):
CFDs are complex instruments and come with a high risk of losing money rapidly due to leverage. 66% of retail investor accounts lose money when trading CFDs with this provider. You should consider whether you understand how CFDs work and whether you can afford to take the high risk of losing your money.
Stratos Global LLC (tradu.com ):
Losses can exceed deposits.
Please be advised that the information presented on TradingView is provided to Tradu (‘Company’, ‘we’) by a third-party provider (‘TFA Global Pte Ltd’). Please be reminded that you are solely responsible for the trading decisions on your account. There is a very high degree of risk involved in trading. Any information and/or content is intended entirely for research, educational and informational purposes only and does not constitute investment or consultation advice or investment strategy. The information is not tailored to the investment needs of any specific person and therefore does not involve a consideration of any of the investment objectives, financial situation or needs of any viewer that may receive it. Kindly also note that past performance is not a reliable indicator of future results. Actual results may differ materially from those anticipated in forward-looking or past performance statements. We assume no liability as to the accuracy or completeness of any of the information and/or content provided herein and the Company cannot be held responsible for any omission, mistake nor for any loss or damage including without limitation to any loss of profit which may arise from reliance on any information supplied by TFA Global Pte Ltd.
The speaker(s) is neither an employee, agent nor representative of Tradu and is therefore acting independently. The opinions given are their own, constitute general market commentary, and do not constitute the opinion or advice of Tradu or any form of personal or investment advice. Tradu neither endorses nor guarantees offerings of third-party speakers, nor is Tradu responsible for the content, veracity or opinions of third-party speakers, presenters or participants.

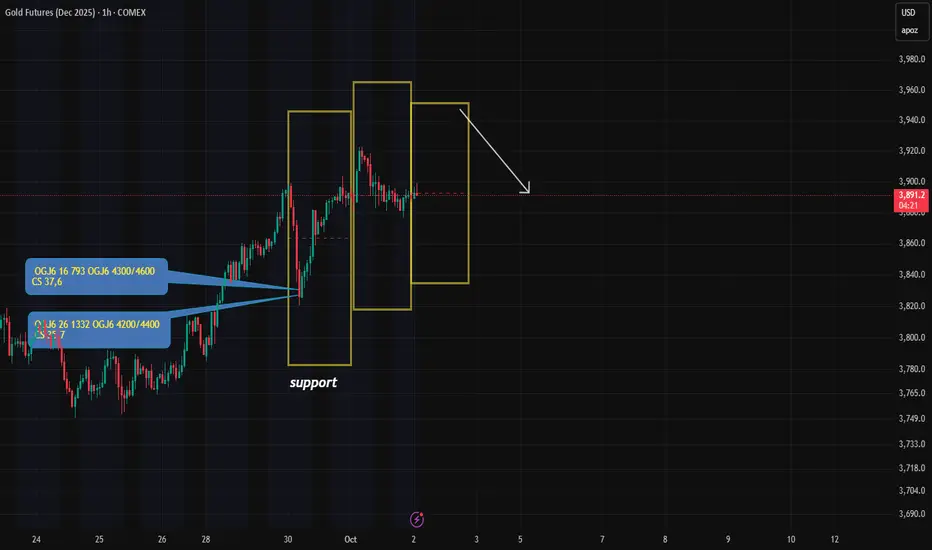
Gold Options Check-In: Are the Big Players Cashing Out?A quick look at the latest CME options data for Gold shows some interesting signals. It looks like the bulls might be getting tired.
The Big Signal: We're seeing big trading volume, but the number of actual open positions (Open Interest) has barely changed.
Calls: 27,274 contracts traded, but only +2,933 new positions were opened.
What this means: This isn't new money flooding in. It's big players shuffling their decks and taking chips off the table.
What's happening with Calls? 🔼
Traders are closing out their winning bets on strikes like $3850, $3800, and
4000
The Takeaway 🎯
The market sentiment is shifting from bullish to neutral & defensive. Big players are:
Cashing out their profits on call options.
This kind of activity is a sign that an uptrend could be running out of steam.
However, another leg up for gold is still possible. The argument for this scenario is the presence of a futures hedge within many of PUT spread portfolios. The logic works like this: if the asset's price continues to rise, profits are taken on the futures leg, and the position is closed. This profit can then make the put spread a breakeven trade, essentially providing downside protection for free, even if the price keeps rallying.
As for me, main bias: short at upper ER (if you're unfamiliar with the ER concept, check out my profile for a detailed post on Expected Range).)
Entry on touch. Risk kept small.
XAUUSD’s next target = $4059Because of the bullflag with the long pole it is currently breaking up from *not financial advice*

usdt.d 30minHello friends
I am Mehdi, according to the Tether Dominance chart and the full targeting of the previous analysis in the 4-hour timeframe
According to the new analysis, I think the price is expected to reach the range of 4.49
1 Because the 4.57 level was broken with a strong candle in the 4-hour timeframe and now the price is rejecting this level
2 We are at the 382 fibo level
3 RSI divergence
Thank you for supporting me by liking and commenting and sharing this analysis

Gold Futures (MGCZ5) – H4 Gap in PlayPrice pushed aggressively bullish all day yesterday with little to no pullbacks. That momentum left behind a fresh H4 Fair Value Gap (FVG) sitting just above the Weekly High (WH) level.
If we see a pullback into this area, it could offer a solid setup for continuation higher.
⚠️ Key considerations:
If buyers stay strong, price may run liquidity above 3863.7 (D-H) before any meaningful retracement.
If sentiment shifts, a deeper draw into the Daily FVG below 3764 remains on the table.
With global uncertainty (military meetings, de-dollarization, possible U.S. shutdown), volatility risk is elevated.
🎯 Game Plan:
Watch the H4 FVG near WH for rejection / entry signals.
Bias remains bullish while above 3785 (D-L).
Break below D-L opens the door toward the Daily FVG.

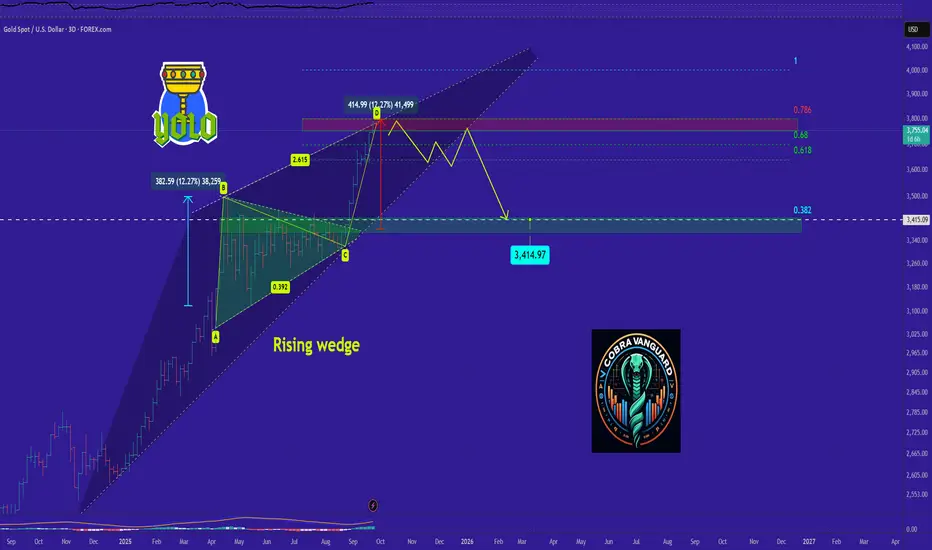
GOLD's Situation, A Comprehensive Analysis ! (XAUUSD)In my opinion, the price will rise to around $4000 and then enter a corrective wave. Currently, the price is forming the third upward wave, which I have estimated using technical analysis. These upward waves will continue up to around $4000, and after this rise, the price could decline toward the PRZ (Potential Reversal Zone). However, this price correction depends on the breakout of the wedge pattern.

xauusdWell, we will have to wait and see what it does at the last traded high.
In any case, if the rate of 3600 holds, it will most likely reach the specified targets.

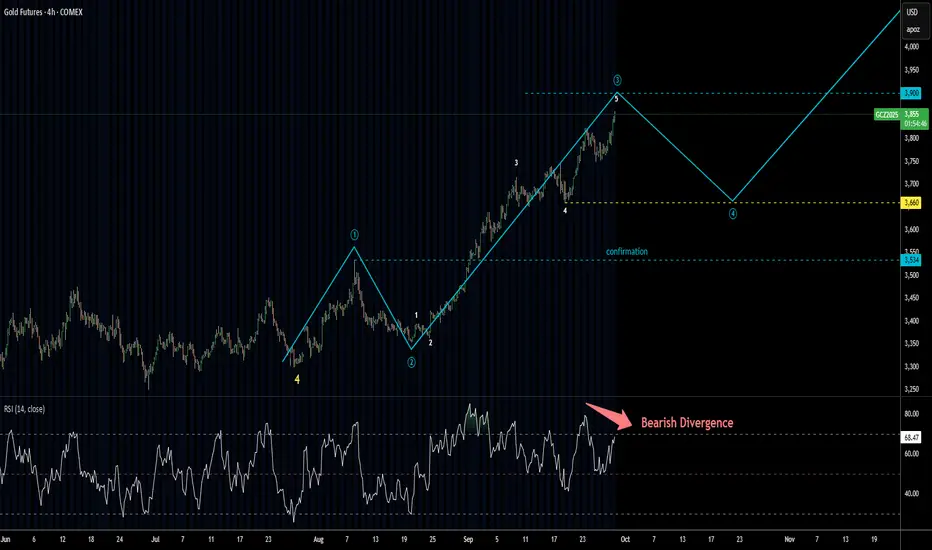
Gold Update 29SEP2025: Top Is Soon, Then PullbackGold Futures are following the projected path closely
The first target at $3,900 is now just "miles" away
This level could mark the top of wave (3) of ((5))
After that, we might see a pullback to around $3,660 in wave (4) of ((5)),
which typically revisits the low of the smaller wave 4
On the 4-hour chart, RSI shows bearish divergence,
as it fails to confirm the new high at $3,859 with a lower peak
Despite this signal, the market could still reach the $3,900 level
Once wave (4) of ((5)) completes,
we can reassess and project wave (5) of ((5)) —
which might form as a triangle or another complex correction.
𝐌𝐓𝐗 | Pitstop Zone to Continue the 1,300 Pip Potential Rally1️⃣ Key Levels
• 729 – 737 → Major golden support zone.
• 759 – 760 → Key resistance / breakout trigger.
• 691 – 683 → Strongest potential buy zone of the week.
⸻
2️⃣ Expected Scenarios
• Bearish:
• 4H close below 759 → retest of the 729–737 support zone.
• 4H close below 729 → extension toward 709 → 700 → 691.
• Zone 691–683 is the most important potential reversal area this week, with multiple confluences, possibly triggering a strong rally toward the 3800 high again.
• Bullish:
• 4H close above 760 → continuation toward 780 → 791.
• 4H close above 792 → further bullish momentum targeting 808 → 817 → 830.
⸻
⚖️ Summary
The market is positioned between critical zones:
• Holding above 759–760 confirms strength toward 830.
• Breaking below 729 increases the probability of testing the 691–683 demand zone, which could be the week’s strongest reversal setup.

usdt.d 4hHello friends
I am Mehdi and I wanted to say that if you are currently in profit compared to the position we announced
It is better to have a save profit and move the stop loss to the entry point
I would appreciate it if you support me with likes and comments

GOLD Local Rebound Ahead! Buy!
Hello, Traders!
GOLD closed above the horizontal demand area, confirming bullish participation. Price will surge from the zone in alliance with Smart Money principles, seeking to mitigate inefficiency while clearing sell-side liquidity. Target sits higher. Time Frame 1H.
Buy!
Comment and subscribe to help us grow!
Check out other forecasts below too!
Disclosure: I am part of Trade Nation's Influencer program and receive a monthly fee for using their TradingView charts in my analysis.

Gold Futures Weekly Outlook (MGCZ5)📍 Key Levels on Watch
Friday’s High (D-H): 3814.5
Friday’s Low (D-L): 3764.2 → New support
Weekly High (WFH): 3824.6
Weekly Low (W-L): 3717.7
Daily FVG Below: 3746.3–3735.2
🧭 Technical Outlook
Price is currently sitting right at the 50% midpoint of Friday’s move.
Friday’s Low (3764.2) is the key inflection point:
If defended → bullish continuation toward 3814.5 and possibly 3824.6.
If broken → expect a quick flush into the Daily FVG (3746–3735) before buyers step back in.
Volume profile shows a low-volume pocket below 3770, which could accelerate moves down into that Daily FVG if support fails.
🌍 Macro Context
De-Dollarization trends continue to support Gold in the longer term.
Geopolitical tensions (military leadership meetings this Tuesday + ongoing global conflicts) = potential safe haven demand.
US Political Risk: Government shutdown threats and loss of traction for the Trump administration add uncertainty → historically supportive for Gold.
Safe Haven Flows: When global stability is questioned, Gold is a direct beneficiary.
🎯 Scenarios to Watch
Bullish Case:
Friday’s low holds → retest of 3814.5 and possibly new weekly highs above 3824.6.
Bearish Case:
Break of 3764.2 → fast move into Daily FVG (3746–3735).
Watch for liquidity sweep & reversal setup inside that FVG.
📌 My Plan
Bias leans bullish this week given the macro backdrop.
BUT — I’ll wait for price to show its hand around Friday’s low before committing to either continuation or discount entries.
Staying flexible: both scenarios mapped, execution will be clean.

Gold Trade Idea for the Week [Sept 29-Oct3]Expecting a bounce from $3740-$3750.
If not, short when it breaks the trend line.
Peace & Happy Trading!
GOLD LOCAL LONG|
✅XAUUSD price is about to tap the demand level, showing ICT bullish order block reaction. Smart Money seeks short-term liquidity grab toward 3,764$ target zone. Time Frame 30M.
LONG🚀
✅Like and subscribe to never miss a new idea!✅

GOLD Free Signal! Sell!
Hello,Traders!
GOLD rejects a horizontal supply area with clear SMC reaction. Liquidity engineered above 3,790$ suggests downside continuation toward 3,770$ imbalance. Time Frame 30M.
-------------------
Stop Loss: 3,791$
Take Profit: 3,769$
Entry: 3,782$
Time Frame: 30M
-------------------
Sell!
Comment and subscribe to help us grow!
Check out other forecasts below too!
Disclosure: I am part of Trade Nation's Influencer program and receive a monthly fee for using their TradingView charts in my analysis.

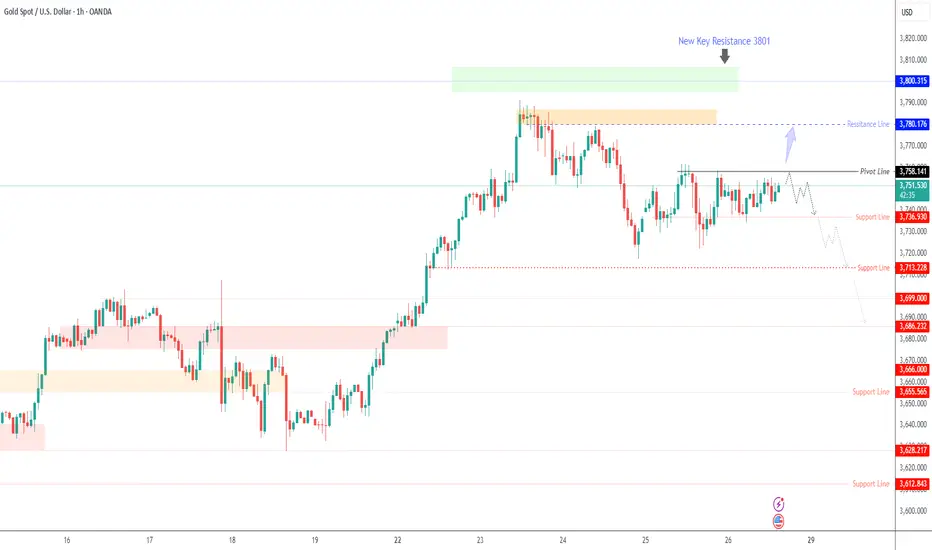
GOLD – Tariffs and PCE Data Keep Bears in Focus Below 3,758GOLD – Overview
Gold prices edged higher in early trade as President Trump’s new tariffs and rising geopolitical tensions over Russian incursions into NATO airspace boosted safe-haven demand.
ETF holdings remain at their highest levels since 2022, while investors await today’s key U.S. PCE inflation data for fresh signals on the Federal Reserve’s rate path.
Stronger U.S. GDP growth and lower jobless claims have slightly eased labor market concerns, adding to market uncertainty ahead of the release.
Technical View
Gold is attempting to stabilize below the 3,758 pivot line, keeping short-term pressure on the downside while awaiting PCE results.
Bearish Scenario:
As long as price trades below 3,758, bearish momentum targets 3,736 → 3,714 → 3,700.
Bullish Scenario:
A confirmed 15-min close above 3,758 would invalidate the bearish setup and support a push toward 3,780 → 3,801.
Key Levels
Pivot: 3,758
Resistance: 3,780 – 3,801
Support: 3,736 – 3,714 – 3,700
Trading Plan:
Gold remains bearish below 3,758, with 3,736 and 3,714 as immediate downside targets.
Today’s PCE data will decide whether price extends toward 3,700 or breaks higher toward 3,780 – 3,801.
Global news might have us Stalling on Gold! Chart Context (MGC Futures, H1/H4)
Price stalled out after rejecting the H4 bearish zone (3791.4–3769.9).
Yesterday’s downside move lost steam before fully reaching the deeper H4 bullish demand (3746.3–3735.2).
We’re now compressing between Daily High (3792.1) and Daily Low (3752.0).
Fundamentals:
U.S. geopolitical/military headlines (Defense Secretary Pete Hegseth ordering hundreds of generals/admirals to an urgent meeting at Quantico, Sep 30) are creating uncertainty, which could trigger safe-haven flows in gold.
Bias Going Into Friday:
Watching for liquidity sweep of yesterday’s lows (~3752/DL). If swept and reclaimed, could trigger bullish continuation.
Alternatively, a clean break & hold above yesterday’s high (~3792/DH) sets up momentum longs targeting 3812+ (previous imbalance).
No trade in the middle of the chop — patience until liquidity is taken on one side.

GOLD BULLISH BIAS|LONG|
✅XAUUSD Price forms a bullish flag above the wide demand area, showing ICT displacement. Smart Money likely drives momentum toward liquidity resting at 3,780$. Time Frame 3H.
LONG🚀
✅Like and subscribe to never miss a new idea!✅

GOLD – Dollar Strength Weighs as Market Awaits PCE DataGOLD – Overview
Gold eased in early trading as a stronger U.S. dollar weighed on prices after Fed Chair Jerome Powell struck a cautious tone on further rate cuts in his Tuesday speech.
Looking ahead, Friday’s U.S. PCE inflation data will be key—softer numbers could revive expectations for additional monetary easing and help gold reclaim recent highs.
Technical View
Gold is stabilizing below the pivot line at 3,770, keeping short-term pressure on the downside.
Bearish Scenario:
As long as price trades below 3,770, the metal is likely to continue its bearish correction toward 3,754 → 3,739.
A confirmed 15-min close below 3,739 would open the way to deeper support at 3,714.
Bullish Scenario:
A confirmed 1H close above 3,787 would invalidate the correction and signal a push toward 3,801 → 3,807.
Key Levels
Pivot: 3,770
Resistance: 3,780 – 3,800 – 3,806
Support: 3,754 – 3,739 – 3,714

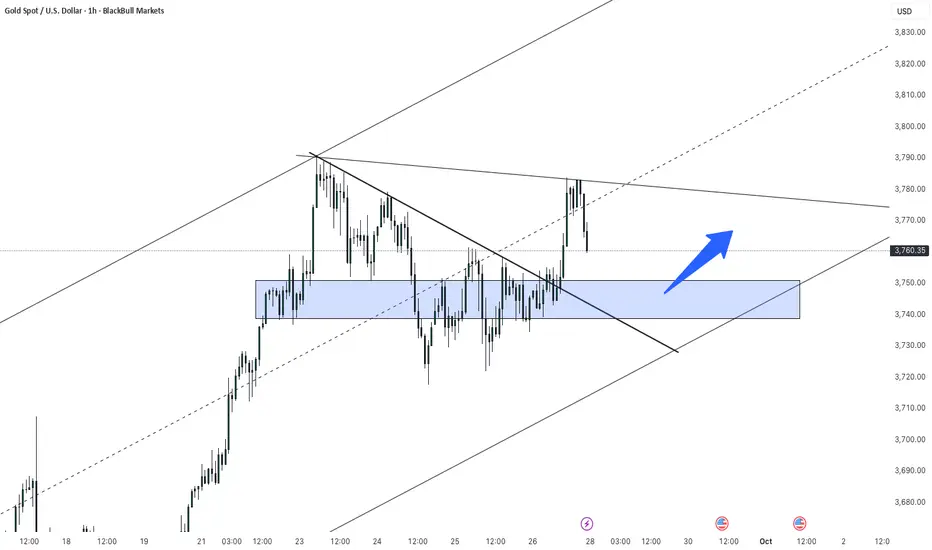
Bullish bounce for the Gold?The price is falling towards the pivot and could bounce to the 1st resistance which acts as a swing high resistance.
Pivot: 3,699.30
1st Support: 3,654.40
1st Resistance: 3,784.06
Disclaimer:
The above opinions given constitute general market commentary, and do not constitute the opinion or advice of IC Markets or any form of personal or investment advice.
Any opinions, news, research, analyses, prices, other information, or links to third-party sites contained on this website are provided on an "as-is" basis, are intended only to be informative, is not an advice nor a recommendation, nor research, or a record of our trading prices, or an offer of, or solicitation for a transaction in any financial instrument and thus should not be treated as such. The information provided does not involve any specific investment objectives, financial situation and needs of any specific person who may receive it. Please be aware, that past performance is not a reliable indicator of future performance and/or results. Past Performance or Forward-looking scenarios based upon the reasonable beliefs of the third-party provider are not a guarantee of future performance. Actual results may differ materially from those anticipated in forward-looking or past performance statements. IC Markets makes no representation or warranty and assumes no liability as to the accuracy or completeness of the information provided, nor any loss arising from any investment based on a recommendation, forecast or any information supplied by any third-party.

Gold Futures – Pullback Into H4 Supply Before Drop to Demand?Price sold off strongly from 3812 resistance and is now correcting higher. On the H4, I see a bearish supply zone between 3791.4–3769.9, which aligns with prior POC acceptance around 3790. If price pulls back into this area and fails, I expect continuation lower into the H4 demand zone at 3746.3–3735.2, which also lines up with Daily Low (DL) and Weekly High (WH) liquidity markers.
Levels to Watch:
Bearish H4 Supply: 3791.4–3769.9
Bullish H4 Demand: 3746.3–3735.2
Invalidation: Break & hold above 3795 could target 3812 liquidity.
Targets: First 3746.3, extended 3735.2.
Bias: Bearish pullback scenario into supply → downside continuation.

GOLD is bearish now and many Traders don't see it !!As you can see, the price is within a descending wedge, and it has reached the upper boundary of this wedge. According to technical analysis patterns, the price has closely followed the AB=CD pattern, indicating a need for a slight correction. In the coming days, the price may range within this wedge, and if the pattern breaks, the price could drop to the Fibonacci levels shown.