Gold | Bearish Below 3343 – Key Break Levels AheadGold Futures Set to End Week Lower on Dented Haven Demand
Gold prices appear to be stabilizing below 3343, indicating that as long as the price trades under this level, it may drop to 3332 and 3320. A break below 3320 could extend losses toward 3285.
However, a 1H close above 3344 would be a key signal for a potential bullish move toward 3365.
Pivot: 3343
Support: 3332, 3320, 3285
Resistance: 3355, 3365, 3382
J-XAU

XAUUSD H4 | Bullish bounce offXAU/USD is reacting off the buy entry of 3,332.63, which is an overlap support that is slightly above the 61.8% Fibonacci projection and could bounce from this level to the take profit.
Stop loss is at 3,306.53, which is a pullback support that lines up with the 161.8% Fibonacci extension.
Take profit is at 3,368.69, which is a pullback resistance.
High Risk Investment Warning
Trading Forex/CFDs on margin carries a high level of risk and may not be suitable for all investors. Leverage can work against you.
Stratos Markets Limited (tradu.com ):
CFDs are complex instruments and come with a high risk of losing money rapidly due to leverage. 65% of retail investor accounts lose money when trading CFDs with this provider. You should consider whether you understand how CFDs work and whether you can afford to take the high risk of losing your money.
Stratos Europe Ltd (tradu.com ):
CFDs are complex instruments and come with a high risk of losing money rapidly due to leverage. 66% of retail investor accounts lose money when trading CFDs with this provider. You should consider whether you understand how CFDs work and whether you can afford to take the high risk of losing your money.
Stratos Global LLC (tradu.com ):
Losses can exceed deposits.
Please be advised that the information presented on TradingView is provided to Tradu (‘Company’, ‘we’) by a third-party provider (‘TFA Global Pte Ltd’). Please be reminded that you are solely responsible for the trading decisions on your account. There is a very high degree of risk involved in trading. Any information and/or content is intended entirely for research, educational and informational purposes only and does not constitute investment or consultation advice or investment strategy. The information is not tailored to the investment needs of any specific person and therefore does not involve a consideration of any of the investment objectives, financial situation or needs of any viewer that may receive it. Kindly also note that past performance is not a reliable indicator of future results. Actual results may differ materially from those anticipated in forward-looking or past performance statements. We assume no liability as to the accuracy or completeness of any of the information and/or content provided herein and the Company cannot be held responsible for any omission, mistake nor for any loss or damage including without limitation to any loss of profit which may arise from reliance on any information supplied by TFA Global Pte Ltd.
The speaker(s) is neither an employee, agent nor representative of Tradu and is therefore acting independently. The opinions given are their own, constitute general market commentary, and do not constitute the opinion or advice of Tradu or any form of personal or investment advice. Tradu neither endorses nor guarantees offerings of third-party speakers, nor is Tradu responsible for the content, veracity or opinions of third-party speakers, presenters or participants.

GOLD WILL GO UP|LONG|
✅GOLD made a retest
Of the horizontal support
Of 3,330$ and we are already
Seeing a bullish rebound
So we will be expecting
A further bullish move up
LONG🚀
✅Like and subscribe to never miss a new idea!✅

Bearish drop off pullback resistance?XAU/USD has rejected off the resistance level, which is a pullback resistance, and could drop from this level to our take profit.
Entry: 3,359.66
Why we like it:
There is a pullback resistance level.
Stop loss: 3,402.54
Why we like it:
There is a swing high resistance.
Take profit: 3,301.85
Why we like it:
There is a pullback support that lines up with the 100% Fibonacci extension.
Enjoying your TradingView experience? Review us!
Please be advised that the information presented on TradingView is provided to Vantage (‘Vantage Global Limited’, ‘we’) by a third-party provider (‘Everest Fortune Group’). Please be reminded that you are solely responsible for the trading decisions on your account. There is a very high degree of risk involved in trading. Any information and/or content is intended entirely for research, educational and informational purposes only and does not constitute investment or consultation advice or investment strategy. The information is not tailored to the investment needs of any specific person and therefore does not involve a consideration of any of the investment objectives, financial situation or needs of any viewer that may receive it. Kindly also note that past performance is not a reliable indicator of future results. Actual results may differ materially from those anticipated in forward-looking or past performance statements. We assume no liability as to the accuracy or completeness of any of the information and/or content provided herein and the Company cannot be held responsible for any omission, mistake nor for any loss or damage including without limitation to any loss of profit which may arise from reliance on any information supplied by Everest Fortune Group.

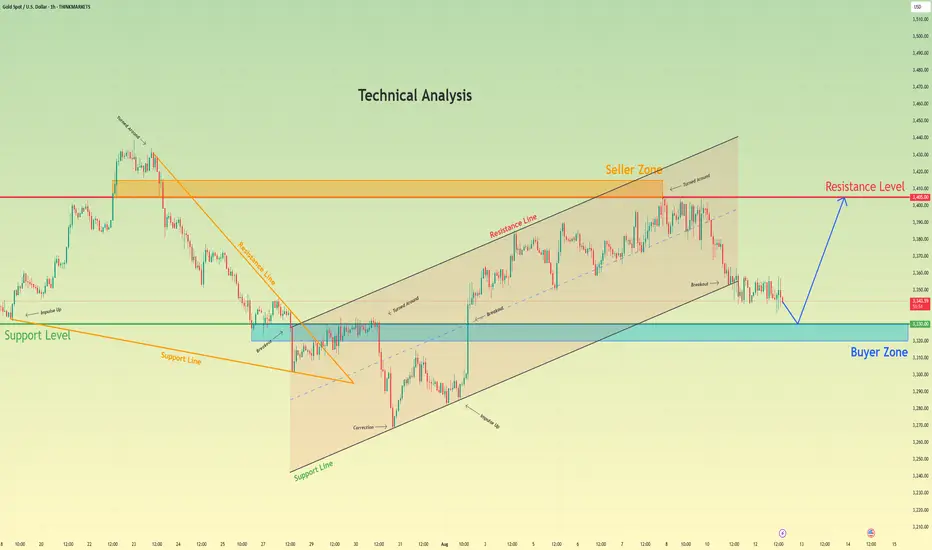
Gold may bounce from support level and rise to resistance levelHello traders, I want share with you my opinion about Gold. The technical narrative for gold has fundamentally shifted from bearish to bullish following a significant breakout from a prior downward wedge. This powerful upward rebound signaled a clear change in market control, invalidating the previous downtrend and establishing a new, constructive market structure. This new structure has taken the form of a well-defined upward channel, which has been guiding the price action higher through a series of impulsive and corrective waves. Currently, the asset is undergoing a natural corrective phase after recently testing the upper resistance line of the channel. This downward correction is guiding the price towards a critical confluence of support located around the 3330 level. This area is significant as it represents the intersection of the channel's ascending support line and a strong horizontal buyer zone. The primary working hypothesis is a long scenario, based on the expectation that buyers will step in to defend this key support confluence and maintain the integrity of the upward channel. A confirmed bounce from this area would likely initiate the next impulsive leg higher within the trend. Therefore, the tp is logically set at the 3405 resistance level, as this represents a full rotation back to the top of the channel and aligns with the major seller zone. Please share this idea with your friends and click Boost 🚀
Disclaimer: As part of ThinkMarkets’ Influencer Program, I am sponsored to share and publish their charts in my analysis.
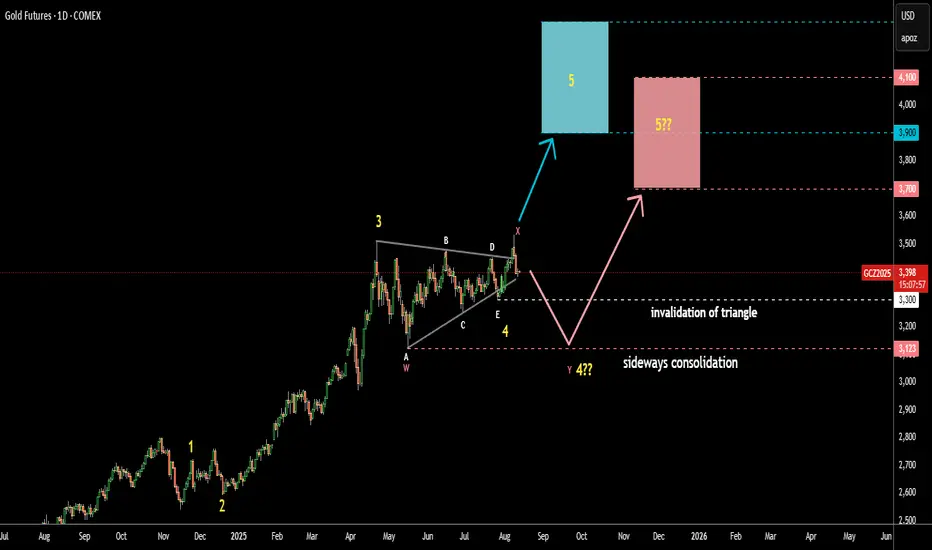
Gold Update 13AUG2025: Risk of Sideways Consolidation Last Friday, August 8, the price failed to progress above the April top as it closed underneath. Hence, there are two possible scenarios from here:
The price could have just completed the first wave up in a larger wave 5, and we may see a retracement. This setup remains valid as long as the price stays above the last wave E of the Triangle at $3,300.
The large sideways consolidation (WXY) might take shape, potentially retesting the bottom of wave A at $3,123. In this case, the target could drop lower, with potential support in the pink box area between $3,700 and $4,100.
Which one do you think plays out?
XAUUSD - Daily | UpdateGold is still in the upper range of this consolidation zone. You can see the high of the range is 3430, and the low is 3240 roughly.
Bulls:
Gold has cleared the Bearish FVG, only to pull back into a bullish FVG. If the price is bullish, then we should reject the gap with ease. Gold has just confirmed bullish price action. Look for gold to remain above 3330 and create a higher high.
Bears:
So with that said... If Gold fails to remain bullish above 3330, the price may move to a lower liquidity zone, such as 3300. Watch for gold to give a clear sign of rejection before entering a sell
**New Bearish FVG has form. Possible retest area 3370

XAUUSD H4 | Bullish bounce off 50% Fib supportThe Gold (XAU/USD) has bounced off the buy entry at 3,332.63, which is an overlap support that aligns with the 61.8% Fibonacci retracement and could potentially bounce from this level to the take profit.
Stop loss is at 3,306.53, which is a pullback support that lines up with the 78.6% Fibonacci retracement.
Take profit is at 3,400.62, whihc is a swing high resistance.
High Risk Investment Warning
Trading Forex/CFDs on margin carries a high level of risk and may not be suitable for all investors. Leverage can work against you.
Stratos Markets Limited (tradu.com ):
CFDs are complex instruments and come with a high risk of losing money rapidly due to leverage. 65% of retail investor accounts lose money when trading CFDs with this provider. You should consider whether you understand how CFDs work and whether you can afford to take the high risk of losing your money.
Stratos Europe Ltd (tradu.com ):
CFDs are complex instruments and come with a high risk of losing money rapidly due to leverage. 66% of retail investor accounts lose money when trading CFDs with this provider. You should consider whether you understand how CFDs work and whether you can afford to take the high risk of losing your money.
Stratos Global LLC (tradu.com ):
Losses can exceed deposits.
Please be advised that the information presented on TradingView is provided to Tradu (‘Company’, ‘we’) by a third-party provider (‘TFA Global Pte Ltd’). Please be reminded that you are solely responsible for the trading decisions on your account. There is a very high degree of risk involved in trading. Any information and/or content is intended entirely for research, educational and informational purposes only and does not constitute investment or consultation advice or investment strategy. The information is not tailored to the investment needs of any specific person and therefore does not involve a consideration of any of the investment objectives, financial situation or needs of any viewer that may receive it. Kindly also note that past performance is not a reliable indicator of future results. Actual results may differ materially from those anticipated in forward-looking or past performance statements. We assume no liability as to the accuracy or completeness of any of the information and/or content provided herein and the Company cannot be held responsible for any omission, mistake nor for any loss or damage including without limitation to any loss of profit which may arise from reliance on any information supplied by TFA Global Pte Ltd.
The speaker(s) is neither an employee, agent nor representative of Tradu and is therefore acting independently. The opinions given are their own, constitute general market commentary, and do not constitute the opinion or advice of Tradu or any form of personal or investment advice. Tradu neither endorses nor guarantees offerings of third-party speakers, nor is Tradu responsible for the content, veracity or opinions of third-party speakers, presenters or participants.

GOLD (XAU/USD) – 2H Price Action & SMC Outlook# 🟡 GOLD (XAU/USD) – 2H Price Action & SMC Outlook
**Date:** 2025/08/12
**Timeframe:** 2H (Heikin Ashi)
**Style:** Smart Money Concept (SMC) + Fair Value Gap (FVG)
---
## 📊 Market Context
Gold is currently testing the **FVG support area** around **3,349 – 3,350**, with a visible **CHOCH** structure forming on the chart. The reaction from this level will be critical in determining the next directional move.
---
## 📈 Bullish Scenario (Primary)
1. **Condition:**
- Price respects the FVG zone (**3,349.9**)
- CHOCH breaks to the upside
- Clean break and close above **3,401.2**
2. **Expected Move:**
- Retest of the breakout zone for liquidity grab
- Extension towards **3,440** as the main target
3. **Targets:**
- 🎯 TP1: **3,401.2** (break confirmation)
- 🎯 TP2: **3,440** (major resistance & supply)
4. **Invalidation:**
- A close below **3,345** would weaken the bullish case and expose lower demand.
---
## 📉 Bearish Scenario (Alternative)
1. **Condition:**
- Price fails to break **3,401.2**
- Strong rejection from the descending trendline
2. **Expected Move:**
- Return to the FVG zone at **3,349.9**
- If broken, possible continuation towards **3,320 – 3,325**
---
## ⚠️ Analysis Validity
This analysis remains valid while **FVG support holds** and a **bullish CHOCH breakout** occurs.
Failure to hold the FVG could trigger deeper retracements.
---
#XAUUSD #GoldAnalysis #SMC #FVG #CHOCH #TradingView

XAU USDxau usd we are expecting kind a move according to our analysis.... right now price is ranging on sideways so we will plan accordingly as per direction which we havr marked

XAUUSD H4 | Bullish bounce offXAU/USD is falling towards the buy entry which is a pullback support that lines up with the 50% Fibonacci retracement and could bounce to the take profit.
Buy entry is at 3,332.63, which is a pullback support that lines up with the 50% Fibonacci retracement.
Stop loss is at 3,306.53, which is a pullback support that is slightly above the 78.6% Fibonacci retracement.
Take profit is at 3,400.72, which is a swing high resistance.
High Risk Investment Warning
Trading Forex/CFDs on margin carries a high level of risk and may not be suitable for all investors. Leverage can work against you.
Stratos Markets Limited (tradu.com ):
CFDs are complex instruments and come with a high risk of losing money rapidly due to leverage. 65% of retail investor accounts lose money when trading CFDs with this provider. You should consider whether you understand how CFDs work and whether you can afford to take the high risk of losing your money.
Stratos Europe Ltd (tradu.com ):
CFDs are complex instruments and come with a high risk of losing money rapidly due to leverage. 66% of retail investor accounts lose money when trading CFDs with this provider. You should consider whether you understand how CFDs work and whether you can afford to take the high risk of losing your money.
Stratos Global LLC (tradu.com ):
Losses can exceed deposits.
Please be advised that the information presented on TradingView is provided to Tradu (‘Company’, ‘we’) by a third-party provider (‘TFA Global Pte Ltd’). Please be reminded that you are solely responsible for the trading decisions on your account. There is a very high degree of risk involved in trading. Any information and/or content is intended entirely for research, educational and informational purposes only and does not constitute investment or consultation advice or investment strategy. The information is not tailored to the investment needs of any specific person and therefore does not involve a consideration of any of the investment objectives, financial situation or needs of any viewer that may receive it. Kindly also note that past performance is not a reliable indicator of future results. Actual results may differ materially from those anticipated in forward-looking or past performance statements. We assume no liability as to the accuracy or completeness of any of the information and/or content provided herein and the Company cannot be held responsible for any omission, mistake nor for any loss or damage including without limitation to any loss of profit which may arise from reliance on any information supplied by TFA Global Pte Ltd.
The speaker(s) is neither an employee, agent nor representative of Tradu and is therefore acting independently. The opinions given are their own, constitute general market commentary, and do not constitute the opinion or advice of Tradu or any form of personal or investment advice. Tradu neither endorses nor guarantees offerings of third-party speakers, nor is Tradu responsible for the content, veracity or opinions of third-party speakers, presenters or participants.

Gold | Tight Range as Tariff Uncertainty Caps MomentumGold Pares Gains on U.S. Tariff Uncertainty
Gold slipped, reversing the prior session’s gains as persistent tariff uncertainty weighed on sentiment.
Technical Outlook:
The price is consolidating between 3348 and 3365.
A 1H close below 3348 could trigger a decline toward 3332 and 3320.
A break above 3365 would open the way for gains toward 3383 and 3401.
Pivot: 3365
Support: 3348, 3332, 3320
Resistance: 3373, 3385, 3401

Could gold stay resilient despite lingering risk-off sentiment?
While risk-off sentiment persists, renewed US tariff threats have continued to draw demand for gold. Prices spiked on concerns over global supply chain disruptions after reports that the US could impose country-specific import tariffs on the most widely traded gold bar standard, but later pared gains after news that President Trump may issue an emergency order exempting gold bars from such measures.
XAUUSD remains range-bound between 3300 and 3500, holding above both EMAs while awaiting a breakout trigger. If XAUUSD stays above both EMAs, the price may gain upside traction toward the 3500 high. Conversely, a break below the 3300 support, where EMA78 intersects, could push the price down toward 3160.

XAUUSD 4Hour TF - August 10th,2025🟦 XAUUSD 4H Analysis
📅 August 10, 2025
Top-Down Trend Bias:
• Monthly – Bullish
• Weekly – Bullish
• Daily – Bullish
• 4H – Bullish
Gold continues to trade in line with the higher timeframe bullish structure, currently testing resistance at the 3,395 zone after a strong upward channel move.
🔍 Key Zone: 3,395
This level aligns with the 78.6% fib retracement and prior structure. The reaction here will determine whether we see a breakout continuation or a corrective pullback.
✅ Scenario A: Bullish Breakout (Blue Path)
1.If price breaks and holds above 3,395
2.Expect continuation toward 3,450
This aligns with the higher timeframe bullish bias and offers solid upside potential
⚠️ Scenario B: Bearish Pullback (Orange Path)
1. If price rejects from 3,395
2.Look for bearish confirmation (engulfing candle, LTF BOS, rejection wicks)
Target 1: 3,320 support
This would be a corrective move within the broader uptrend, offering counter trend opportunities for short-term traders.
🧠 Final Notes
• Higher timeframe bias strongly favors upside continuation
• 3,395 is the immediate decision level, confirmation is key
• Short term pullbacks may offer re-entry opportunities into the larger trend

GOLD STRONG BULLISH BIAS|LONG|
✅GOLD is consolidating above
The horizonal support level
Of 3390$ while trading in a
Strong uptrend so we are
Bullish biased and we will be
Expecting growth on Monday!
LONG🚀
✅Like and subscribe to never miss a new idea!✅
GOLD Will Keep Growing! Buy!
Hello,Traders!
GOLD is trading in an
Uptrend and the price
Made a retest and rebound
So we are bullish biased
And we will be expecting
A further bullish move up
Buy!
Comment and subscribe to help us grow!
Check out other forecasts below too!
Disclosure: I am part of Trade Nation's Influencer program and receive a monthly fee for using their TradingView charts in my analysis.

GOLD | XAU/GC - Weekly Recap & Gameplan - 03/08/25📈 Market Context:
Gold is currently trading within an accumulation zone as the market begins to price in a potential 0.25% rate cut by the Fed.
This macro expectation is supporting the broader bullish bias in the commodities market.
🧾 Weekly Recap:
• Price broke below the HTF bullish trendline — a key sign of weakness and potential structural shift.
• However, a sharp drop in the DXY (US Dollar Index) provided a bullish tailwind for gold, resulting in a mid-week bounce.
• This mixed action sets the stage for two potential outcomes next week.
📌 Technical Outlook & Game Plan:
I’m preparing for two possible scenarios:
1️⃣ Bearish Scenario (Red Path):
→ Price retests the broken trendline and rejects it
→ Continuation to the downside
→ Play: Short setup
2️⃣ Bullish Scenario (Green Path):
→ Price reclaims the broken trendline and closes above it
→ Continuation higher toward next resistance
→ Play: Long setup
🎯 Setup Trigger:
I will wait for a clear break of structure (BOS) on the 1H–4H timeframe to confirm directional bias.
📋 Trade Management:
• Stoploss: Below the demand zone (for longs) or above supply (for shorts) on the 1H–4H chart
• Target:
→ Bullish: $3,536
→ Bearish: $3,305
💬 Like, follow, and comment if this breakdown supports your trading! More updates, setups, and educational posts coming soon — stay tuned!
XAU/USD (Gold) Triangle Breakout (07.08.2025)The XAU/USD pair on the M30 timeframe presents a Potential Buying Opportunity due to a recent Formation of a Triangle Breakout Pattern. This suggests a shift in momentum towards the upside and a higher likelihood of further advances in the coming hours.
Possible Long Trade:
Entry: Consider Entering A Long Position around Trendline Of The Pattern.
Target Levels:
1st Resistance – 3407
2nd Resistance – 3420
🎁 Please hit the like button and
🎁 Leave a comment to support for My Post !
Your likes and comments are incredibly motivating and will encourage me to share more analysis with you.
Best Regards, KABHI_TA_TRADING
Thank you.
Disclosure: I am part of Trade Nation's Influencer program and receive a monthly fee for using their TradingView charts in my analysis.

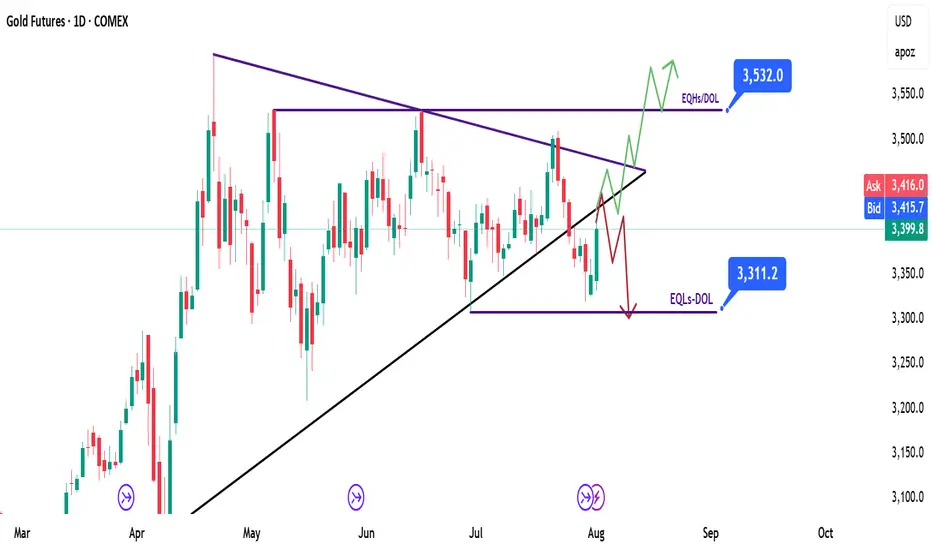
Gold Update 06AUG2025: Price Tests ResistanceThe Triangle pattern in gold futures remains highly reliable.
Wave E held above the low of Wave C, maintaining the structure.
Price is now testing the Triangle’s upper resistance.
A breakout above this level would confirm the bullish setup.
The target zone remains unchanged: $3,900–$4,300.

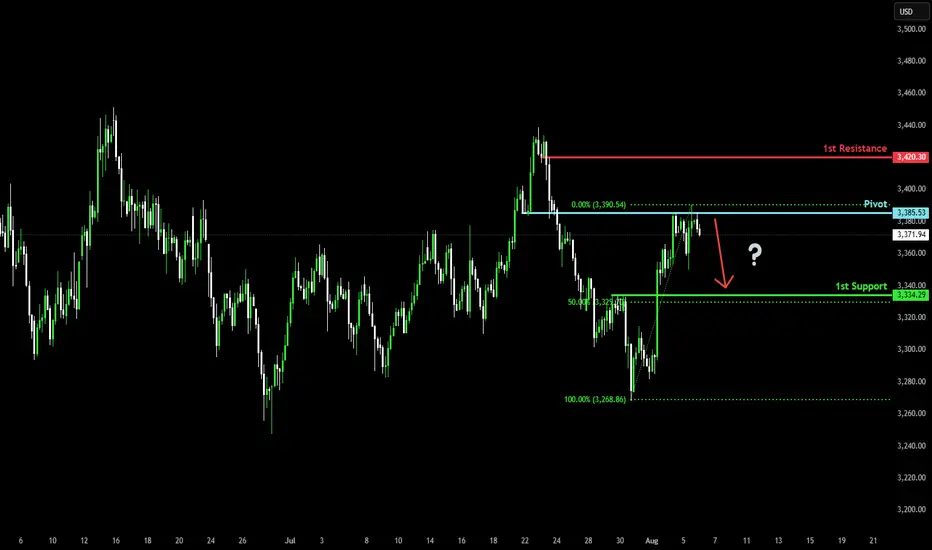
Bearish drop for the Gold?The price has rejected off the pivot which has been identified as a pullback resistance and could drop to the 50% Fibonacci support.
Pivot: 3,385.53
1st Support: 3,334.29
1st Resistance: 3,420.30
Risk Warning:
Trading Forex and CFDs carries a high level of risk to your capital and you should only trade with money you can afford to lose. Trading Forex and CFDs may not be suitable for all investors, so please ensure that you fully understand the risks involved and seek independent advice if necessary.
Disclaimer:
The above opinions given constitute general market commentary, and do not constitute the opinion or advice of IC Markets or any form of personal or investment advice.
Any opinions, news, research, analyses, prices, other information, or links to third-party sites contained on this website are provided on an "as-is" basis, are intended only to be informative, is not an advice nor a recommendation, nor research, or a record of our trading prices, or an offer of, or solicitation for a transaction in any financial instrument and thus should not be treated as such. The information provided does not involve any specific investment objectives, financial situation and needs of any specific person who may receive it. Please be aware, that past performance is not a reliable indicator of future performance and/or results. Past Performance or Forward-looking scenarios based upon the reasonable beliefs of the third-party provider are not a guarantee of future performance. Actual results may differ materially from those anticipated in forward-looking or past performance statements. IC Markets makes no representation or warranty and assumes no liability as to the accuracy or completeness of the information provided, nor any loss arising from any investment based on a recommendation, forecast or any information supplied by any third-party.
Citi’s bold gold forecast for next 3 months Citi has raised its 3-month gold price target to $3,500-$3,600/oz, up from it previous guidance of $3,300.
The upgrade follows a deteriorating US economic outlook, weakening labor market trends, and growing concerns over Fed and data independence.
Gold is currently testing a critical resistance zone near $3,380, a level that has previously shown signs of price rejection. Although $3,365 arguably might have been the tougher resistance... which is now broken.
The presence of higher lows from previous months could suggest continued strength, potentially supporting the expectation of Citi for gold to trade in the $3,500–$3,600 range.

GOLD H4 | Could the price reverse from here?XAU/USD is reacting off the sell entry at 3,382.85, which is a pullback resistance and could reverse from this level to the take profit.
Stop loss is at 3,432.37, which is a swing high resistance.
Take profit is at 3,333.65, which is a pullback support that is slightly above the 50% Fibonacci retracement.
High Risk Investment Warning
Trading Forex/CFDs on margin carries a high level of risk and may not be suitable for all investors. Leverage can work against you.
Stratos Markets Limited (tradu.com ):
CFDs are complex instruments and come with a high risk of losing money rapidly due to leverage. 65% of retail investor accounts lose money when trading CFDs with this provider. You should consider whether you understand how CFDs work and whether you can afford to take the high risk of losing your money.
Stratos Europe Ltd (tradu.com ):
CFDs are complex instruments and come with a high risk of losing money rapidly due to leverage. 66% of retail investor accounts lose money when trading CFDs with this provider. You should consider whether you understand how CFDs work and whether you can afford to take the high risk of losing your money.
Stratos Global LLC (tradu.com ):
Losses can exceed deposits.
Please be advised that the information presented on TradingView is provided to Tradu (‘Company’, ‘we’) by a third-party provider (‘TFA Global Pte Ltd’). Please be reminded that you are solely responsible for the trading decisions on your account. There is a very high degree of risk involved in trading. Any information and/or content is intended entirely for research, educational and informational purposes only and does not constitute investment or consultation advice or investment strategy. The information is not tailored to the investment needs of any specific person and therefore does not involve a consideration of any of the investment objectives, financial situation or needs of any viewer that may receive it. Kindly also note that past performance is not a reliable indicator of future results. Actual results may differ materially from those anticipated in forward-looking or past performance statements. We assume no liability as to the accuracy or completeness of any of the information and/or content provided herein and the Company cannot be held responsible for any omission, mistake nor for any loss or damage including without limitation to any loss of profit which may arise from reliance on any information supplied by TFA Global Pte Ltd.
The speaker(s) is neither an employee, agent nor representative of Tradu and is therefore acting independently. The opinions given are their own, constitute general market commentary, and do not constitute the opinion or advice of Tradu or any form of personal or investment advice. Tradu neither endorses nor guarantees offerings of third-party speakers, nor is Tradu responsible for the content, veracity or opinions of third-party speakers, presenters or participants.

XAU/USD Approaches Resistance – Watch 3374 CloselyGOLD Overview
Gold is currently approaching the 3374 resistance level. A 1H candle close above 3374 could trigger further upside toward the next resistance zones at 3401 and 3402.
However, if the price fails to hold above 3365 and starts to decline, this would indicate a potential bearish reversal toward the support levels at 3350 and 3333.
The next short-term move will depend on how price reacts around the 3374 zone — watch for either a confirmed breakout or rejection.
🔹 Key Technical Levels:
Pivot Line: 3365
Resistance: 3374 • 3388 • 3402
Support: 3350 • 3333
Scenarios:
🔺 Bullish: 1H close above 3374 → Targets: 3388 / 3402
🔻 Bearish: Failure to hold above 3365 → Downside toward 3350 / 3333
