XRP/USDT 1D Chart Review🔹 1. General Trend
A long-term downtrend is visible, confirmed by the descending trendline connecting the peaks (black diagonal line).
The price continues to respect this trend, and the current rebound looks like a test of this line from below.
🔹 2. Key Levels
✅ Resistance:
2.77–2.80 USDT – current strong resistance (being tested now, with the price trying to break through it).
→ This is the confluence zone: downtrendline + horizontal level.
2.85–2.86 USDT – next resistance (previous local high).
3.12 USDT – main weekly resistance, where the last major downward wave began.
✅ Support:
2.48 USDT – key daily support from which the market rebounded.
2.13 USDT – lower support that halted the earlier crash (large wick).
🔹 3. Stochastic RSI
Currently in the overbought zone (80–100), and the %K and %D lines are close to crossing.
→ This signals that upward momentum may be weakening – a local correction or consolidation is possible.
🔹 4. Scenarios
🟢 Bullish (breakout of resistance 2.77–2.80)
A confirmed breakout and close of the candle above 2.80 USDT will signal a continuation of the move to:
🎯 2.85–2.86 (first target)
🎯 3.12 (second target)
🔴 Bearish (rejection of resistance)
If the daily candle closes below 2.65 USDT, a possible pullback to:
🎯 2.48 (key support)
🎯 2.13 (deeper retest)
J-xrp

Examples of Chart Interpretation Methods
Hello, fellow traders!
Follow us to get the latest information quickly.
Have a great day!
-------------------------------------
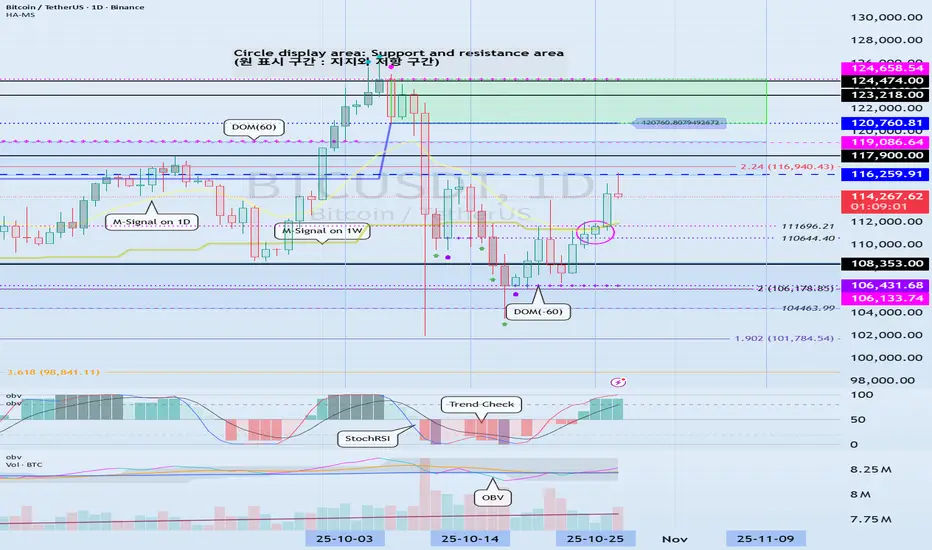
#BTCUSDT
To break above a key point or range and continue the uptrend,
1. The StochRSI indicator must be trending upward. Ideally, it should not enter the overbought zone. 2. The On-By-Signal (OBV) indicator must show an upward trend. If possible, it should remain above the High Line.
3. The TC (Trend Check) indicator must show an upward trend. If possible, it should remain above the 0 level.
Currently, only the TC indicator satisfies the above conditions.
Therefore, if the price remains above the 110644.40-111696.21 range and the above conditions are met, we should see if the price rises above 116259.91 and remains there.
If the On-By-Signal (OBV) indicator remains above EMA 1 and EMA 2 and rises above the High Line, further upside is likely.
However, if the K indicator of the StochRSI indicator enters the overbought zone and the slope changes, the upside may be limited.
When the TC (Trend Check) indicator touches its highest point, there's a high probability of forming a new high, so you should consider a response plan.
Summary of the above:
Support Zone: 110644.40-111696.21
Resistance Zone: 116259.91-119086.64 (up to 124658.54)
------------------------------------
#ETHUSDT
As mentioned in the BTC chart description, ETH is also showing similar movements.
However, the OBV indicator is just about to break above EMA 1 and EMA 2, so if it finds support near 4109.80, there's a possibility of further upside.
-------------------------------------
#ZECUSDT
Based on the BTC chart description, ZEC is likely to continue its upward trend.
The chart is broken due to the sudden surge, making it difficult to determine the duration of volatility.
--------------------------------------------
#XRPUSDT
The key is whether the price can find support at key support and resistance levels and rise above 2.9092.
------------------------------------------
Ultimately, trading will be based on the support and resistance levels drawn on the 1M, 1W, and 1D charts.
However, it is recommended to use auxiliary indicators to confirm whether to initiate a trade.
The basic trading strategy is to buy in the DOM(-60) ~ HA-Low range and sell in the HA-High ~ DOM(60) range.
However, if the price rises in the HA-High ~ DOM(60) range, a step-up trend is likely, while if the price falls in the DOM(-60) ~ HA-Low range, a step-down trend is likely.
Therefore, a fractional trading strategy is recommended.
In this context, the coin (token) currently closest to buying is XRP.
-
Thank you for reading to the end.
I wish you successful trading.
--------------------------------------------------
XRP: Holds Firm Ripple (XRP) managed a modest rebound following last week’s moderate sell-off. However, under our primary scenario, blue wave (iii) is expected to push prices lower once again, targeting a bottom above the turquoise long Target Zone between $1.03 and $0.38. After that, wave (iv) should prompt a corrective move to the upside before wave (v) completes the entire blue five-wave sequence within the turquoise zone, thereby concluding the larger turquoise wave B correction. Prices in this zone could present attractive long entry opportunities, as the ensuing wave C is likely to propel the altcoin above resistance at $4.09. At that level, the higher-degree magenta wave (Y) should also reach completion. If XRP breaks out directly above the $3.19 resistance, it will suggest that wave alt.B has already finished (with a 30% probability).

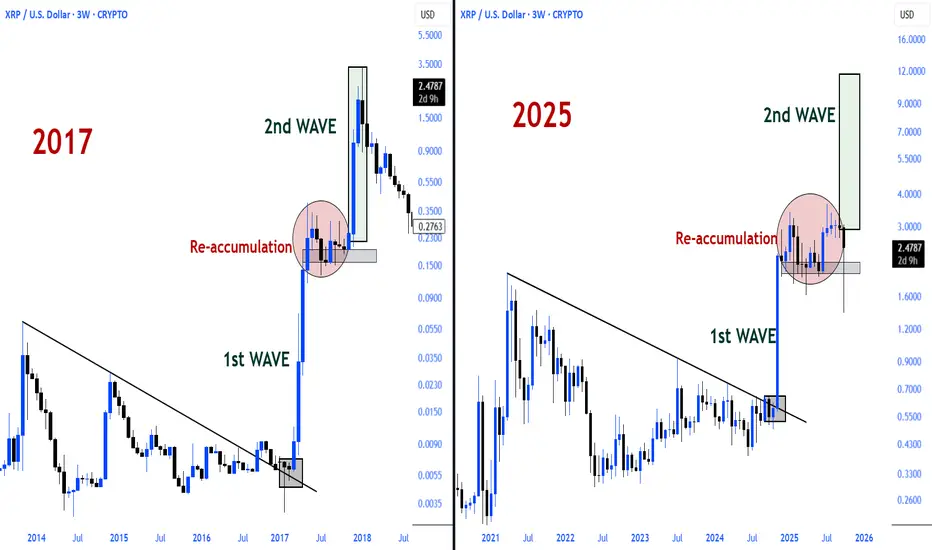
$XRP 2017 waves are reshaping.Ripple actually exhibits a rather simple yet impressive technical structure.
Price is stuck in the reaccumulation phase between the 2017 peak at $3.3, the major resistance level, and the 2021 peak at $1.96, the major support level.
This region represents a significant reversal area for long-term investors.
The maturation of the structure within this narrow range will determine the direction of the next breakout.
A potential upward breakout would signal the start of a parabolic wave.
Silence is a precursor to a major move.

XRP at major resistanceCRYPTOCAP:XRP is tapping major resistance and the previous channel lower boundary just above the daily 200EMA
If we break through the daily pivot offers resistance followed by the channel upper boundary trend-line. There is work to be done.
RSI hit oversold but no divergence.
Safe trading

XRPUSDT → Pre-breakout base. Are the bulls back?BINANCE:XRPUSDT is attempting to break through the resistance of the trading range as part of a bullish run across the entire market. There is a chance that a breakthrough could form after a pullback...
The market is gradually buying back the liquidation that occurred on October 10. Bitcoin is breaking the structure, which indicates a possible return of the bulls. This sets a positive tone for the cryptocurrency market.
XRP is testing resistance and entering a consolidation phase. The trigger that could provoke growth is 2.661. However, as part of the consolidation, the market may test support before growth in order to hunt for liquidity.
Resistance levels: 2.661, 2.739
Support levels: 2.587, 2.547, 2.500
Since the opening of the session, the market has formed a fairly strong momentum, and at the beginning of the European trading session, a correction may form before the growth continues. As part of the correction, XRP may form a pullback to 2.587 - 2.500.
Best regards, R. Linda!

XRP Technical Outlook: Channel Break Could Signal New Highs !!The price is currently moving within a bullish channel and may reach the upper boundary of this channel. If the channel is broken to the upside, we can expect a new all-time high (ATH) for Ripple.
Previous Analysis

Ethereum's decision timeMy stance of course is I am embarrassed, but we have two scenarios here to play out in my opinion and it's quite clear what I have drawn here. I believe lower this week but only time will tell

XRP's situation+next targets and expected movementsAs you can see, the price is forming two bullish patterns on the 4h timeframe, If my view is correct, XRP will rise to $2.8
And if this pattern is correct and breaks, higher targets are possible.

Say it back $XRP Say it back CRYPTOCAP:XRP
The downtrend structure that has persisted since 2021 has been broken, and a parabolic rise has been initiated following a retest.
Currently, the price is continuing its re-accumulation process between the supply and demand zones.
An upward breakout of the supply zone will trigger the next parabolic run.

$XRP history doesn’t repeat, but it rhymes.After its major trend breakout in 2017, XRP initiated a two stage parabolic run, Wave 1st, followed by Re-accumulation, and then Wave 2nd.
Today, the picture looks surprisingly similar.
Some cycles don't just repeat…they are reborn.
$XRP / $BTC bullish enough Ripple broke above the falling channel structure, which has existed since 2017, and also broke above the 50 EMA in November 2024. Following this breakout, the price entered a prolonged period of re-accumulation.
The recent market crash served as a technical retest of this structure.
While short-term volatility may appear misleading, over the long term, CRYPTOCAP:XRP still maintains a clearly bullish structure.

My only remaining hope for XRP !!!The price has been stuck within this channel for quite some time. If we remain optimistic and it breaks out from the top, we could potentially set a $5 target for Ripple.

XRPUSD - Big Bullish Retest Price is retesting a recently found support line
in the past this has been seen as strong resistance since 2017 but now it is a support line
I expect another move upward after the retest is done.
Bullish on this Daily timeframe

XRP Wave (2) CompleteCRYPTOCAP:XRP wave (2) appears complete after last Fridays flash crash at the 0.382 Fibonacci retracement and weekly pivot point.
RSI is crossed bearish and has room to fall into oversold with no bullish divergence. Bearish divergence marked the short-term top.
Price is expected to dip into the wick before moving up in wave 3 into price discovery with an initial target of $5.7
It should still be noted that XRPs move up was from a multiyear triangle which is a terminal pattern. Prices are expected to hit the bottom of the triangle at $0.3 but take this with a pinch of salt.
Safe trading

$XRP is cooking something up. CRYPTOCAP:XRP is cooking something up.
Chart has been inverted, but the story remains the same.
XRP is still gathering strength within the demand zone emerging from the 2018 major resistance.
While the direction may seem confusing, the structure is clear.
The next major move is being prepared to the upside.

$XRP Same scenario, new cycle. XRP cyclical structure is showing a striking similarity once again.
After the major rally in 2017, the price was rejected from the 2013 ATH level and then retested the 2014 ATH level, which had previously acted as resistance. After accumulating strength in this area, it began its parabolic run.
Today, the picture is almost identical..
After the strong surge in 2024, the price was rejected at the 2017 ATH level and retested the 2021 ATH level, which had previously acted as resistance. Now, the power accumulation phase is ongoing in this region.
Following this consolidation, the next parabolic run will be inevitable.
Patience is the most valuable strategy in this cycle.

XRP – Going Long Against the CrowdJust discovered that 96% of traders are short on XRP, which instantly caught my attention. When sentiment is this lopsided, I start thinking like a contrarian. Price is sitting in a key zone, and I’m using my Fibonacci Extension Tool to project upside targets.

My only remaining hope for XRP !!!I might be wrong and this might never happen, but it might come true From a technical perspective!!!

XRPUSD Bearish Cross pushing it down to $1.9350 t least.XRP (XRPUSD) has been trading within a Channel Up for almost 1 year (since November 26 2024) and just before last Friday's flash crash, it formed a 1D MA50/100 Bearish Cross. This came after the pattern has already started its 2nd Bearish Leg (red Channel).
The last 1D MA50/100 Bearish Cross was formed post half-way through the previous Bearish Leg and resulted into a bottom just below the 0.786 Fibonacci retracement level. Since there are no news in the market that can drastically alter the bearish sentiment following the renewed U.S. - China trade tensions, we have no reason to expect that the current Bearish Leg won't reach again the bottom of the Channel Up at least.
Our Target is therefore 1.9350 (marginally below the 0.786 Fib). If the Bearish Leg repeats the % drop of the previous one (-52.42%), it can even break to 1.7500 (still within the Channel Up on a logarithmic scale). A break above the 1D MA100 (green trend-line) would invalidate this bearish structure.
-------------------------------------------------------------------------------
** Please LIKE 👍, FOLLOW ✅, SHARE 🙌 and COMMENT ✍ if you enjoy this idea! Also share your ideas and charts in the comments section below! This is best way to keep it relevant, support us, keep the content here free and allow the idea to reach as many people as possible. **
-------------------------------------------------------------------------------
💸💸💸💸💸💸
👇 👇 👇 👇 👇 👇

You will ask yourself, "how did he know Xrp would do that"?On Sept 5th I wrote, "Based on my statistical analysis of the "3 week down rule", I anticipate Xrp retracing from one of these 3 targets to form a lower low". Congrats to all who rode the gains up to the 3rd target and shorted the top. Also, as expected, Xrp got the lower low for all the doubters of the "3 Red Week Down Rule".

More down before 150k. Buy zone targeted! COINBASE:BTCUSD If Bitcoin continues previous trends. The last 2 large rallies were preceded by 11-13% drops. We are only at 4% now. If this holds true, 100-98k is where we reverse to 150k.

XRPUSD Bullish/Bearish ScenarioMY XRP brain storm for this crucial point in the market. It really is sitting at a critical point and the next move decides direction. He are the possibilities.
