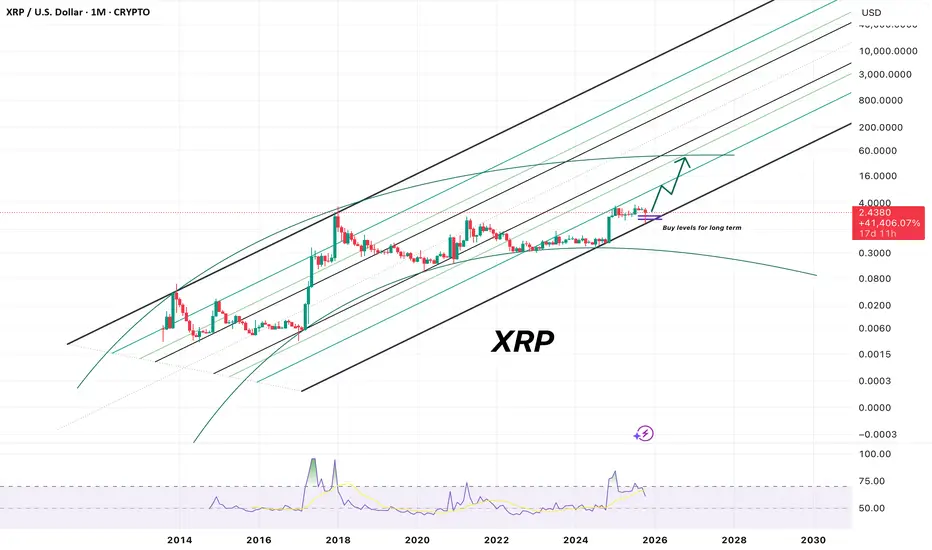
Xrp - This chart is only bullish!💰Xrp ( CRYPTO:XRPUSD ) is pointing higher:
🔎Analysis summary:
Yes, Xrp has been consolidating for the entire year of 2025. But looking at obvious market structure, Xrp is preparing for another move higher. And even if we see a -50% correction, the path of least resistance remains towards the upside. This bullrun is clearly not over.
📝Levels to watch:
$2,0, $3,0
SwingTraderPhil
SwingTrading.Simplified. | Investing.Simplified. | #LONGTERMVISION
J-xrp

Xrp super cycleBeen a while , things didn’t go as expected for many of the coins and some of mine as well which I will update today , the amount of frustration and hopelessness I see is crazy , people getting off the market with loss specially after recent event of liquidation, waiting took so long and promised Altseason didn’t came as many of us anticipated it for October and late 2024 , this all gives me clue to expect something more , different and exciting.
Looking at dino coins they seems like getting ready to do something extraordinary, something they couldn’t manage to do last cycle and that is going beyond expectations, I see many of them including XRP getting ready for that , I believe we haven’t finished any altseason and in fact we didn’t even start it yet , giving it the momentum it shall start from next month and extend through the next year till late September and October , what I have in mind is that all markets in order to trap your money and keep you inside have to have a cycle including Alts .
So what we witnessed in the last few years should eventually gives us something we can use and be happy for .
I’m gonna add XRP to my bag but please be aware that this is my own personal decision and I won’t be responsible for your losses.
Wish you all the best .
The Year of the ETF $XRPSpot CRYPTOCAP:XRP ETFs with SEC review dates in October 2025
Grayscale: October 18
21Shares: October 19
Bitwise: October 22
Canary Capital: October 23
CoinShares: October 23
WisdomTree: October 24
GOV Shutdown may have caused delays.
By middle of November we should start seeing massive gains in $XRP.
Wont even mention my target as you can see it on the chart.
I've personally waited a long time for this, I wont sell until we reach where I think we are headed.
I expect cycle to top out by the end of November, beginning of December max.

Next volatility period: Around October 23rd (October 22nd-24th)
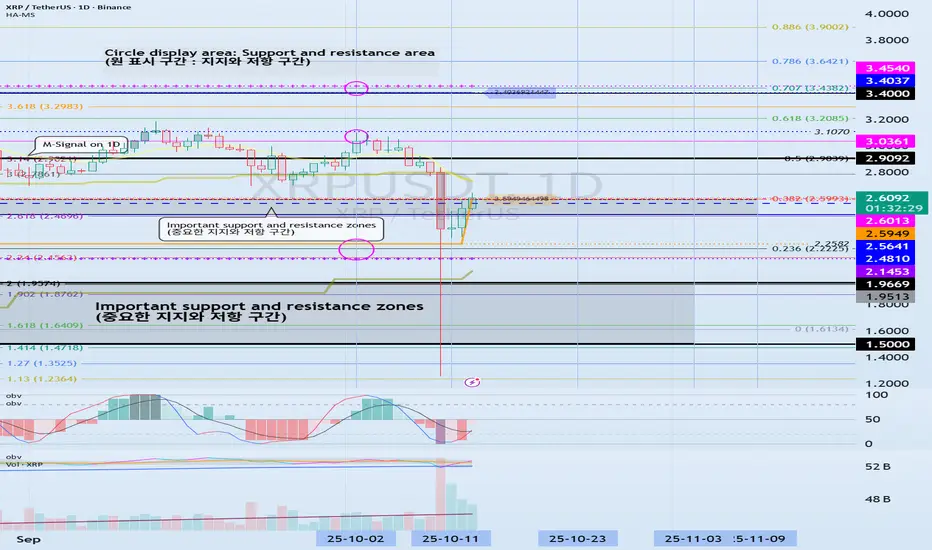
Hello, traders!
By "Following," you can always get the latest information quickly.
Have a nice day today.
-------------------------------------
(XRPUSDT 1D Chart)
After this period of volatility, the HA-Low indicator on the 1D chart is forming at the 2.5949 level.
Therefore, if the HA-Low indicator forms at the 2.5949 level, it will be important to determine whether support is found near that level.
Furthermore, the HA-High indicator on the 1M chart is forming at the 2.4810 level.
Therefore, the key question is whether the price can find support and rise near the important support and resistance levels of the left Fibonacci ratio (2.618 (2.4696)) and the right Fibonacci ratio (0.382 (2.5993)).
However, to continue the step-up trend, the price must rise above 3.4037-3.4540 and hold, so you should also consider a countermeasure.
-
The basic trading strategy is to buy in the DOM(-60) ~ HA-Low range and sell in the HA-High ~ DOM(60) range.
However, if the price rises in the HA-High ~ DOM(60) range, a step-up trend is likely, while if the price falls in the DOM(-60) ~ HA-Low range, a step-down trend is likely.
Therefore, the basic trading strategy should be a segmented trading strategy.
Currently, the HA-Low indicator is showing signs of forming, so if support is confirmed near the HA-Low indicator, it would be a good time to buy.
From a medium- to long-term perspective, if the price holds above the 1.5-1.9669 range, the upward trend is likely to continue.
-
Thank you for reading to the end. I wish you successful trading.
--------------------------------------------------
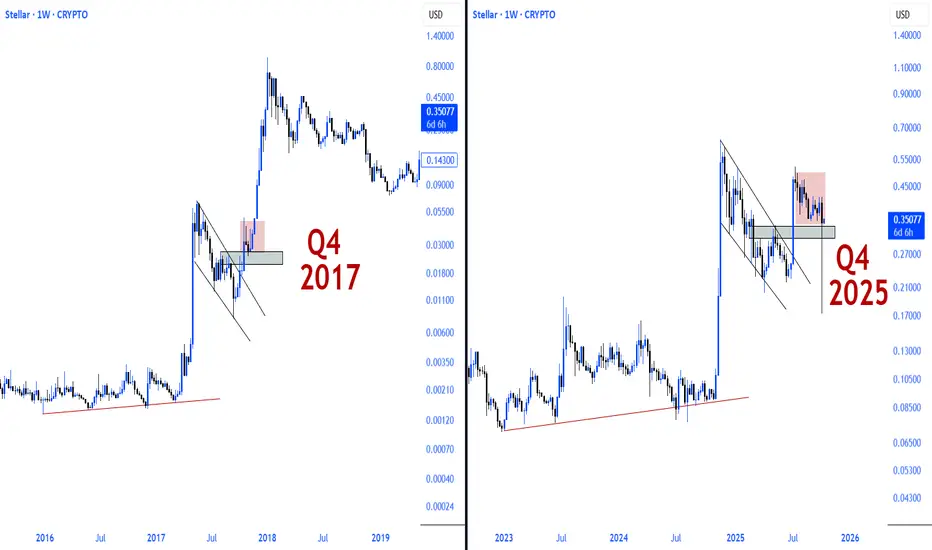
The 2017 and 2025 $XLM structures are strikingly similar.The 2017 and 2025 CRYPTOCAP:XLM structures are strikingly similar.
In 2017, a breakout occurred following a prolonged descending wedge formation, which then began a parabolic run after a brief accumulation phase above the demand zone.
The 2025 structure also forms a similar technical foundation.
Technical reflections of historical cycles.
Same structure, different cycle. However, market psychology and price behavior are shaped similarly.
While times may change, the recurrence of technical patterns is the clearest indicator of cyclical nature.
Dynamics that worked in the past are returning to the scene in the new cycle.
XLM is once again recapturing its historical rhythm.
XLM is the inseparable shadow of XRP.
If XRP runs, XLM will surely follow.
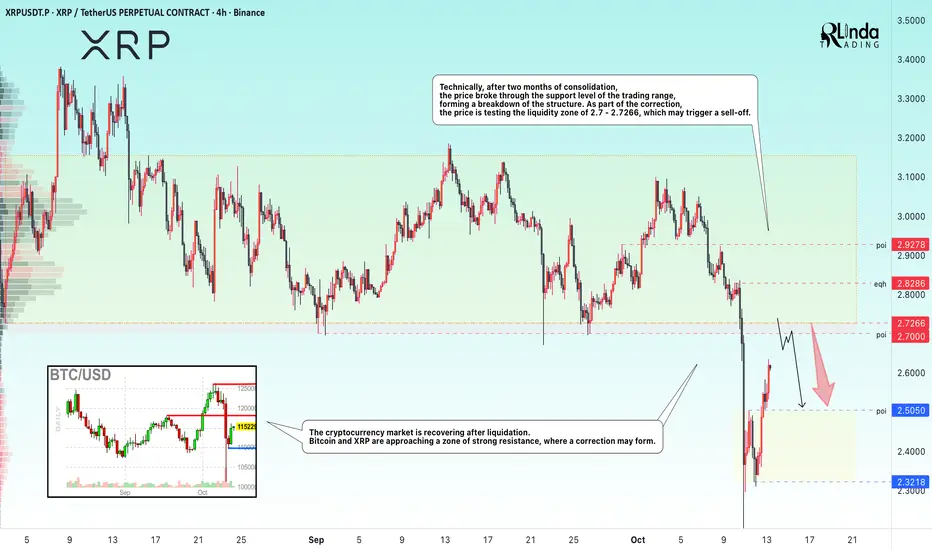
XRPUSDT → Resistance at 2,700 could trigger a correction BINANCE:XRPUSDT is forming a correction after a strong sell-off. It is not yet worth hoping for strong growth without pullbacks, as there is a strong resistance zone ahead.
The cryptocurrency market is recovering after liquidation. Bitcoin and XRP are approaching a strong resistance zone, where a correction may form.
Technically, after two months of consolidation, the price broke through the support of the trading range, forming a breakdown of the structure. As part of the correction, the price is testing the liquidity zone of 2.7 - 2.7266, which may trigger a sell-off.
Resistance levels: 2.7 - 2.7266, 2.8286
Support levels: 2.505
A sharp rise and the lack of technical potential to break through the resistance level of 2.70 may trigger a false breakout and a correction to the support level of 2.5050.
Best regards, R. Linda!
XRP, Terminal move complete. New all time high?What a mess Friday turned out to be with a recording breaking liquidation event with the numbers still growing - bigger than FTX!
SUNK COST FALLACY: THE DAMAGE IS DONE, DO NOT PANIC IN AND OUT OF POSITIONS.
So many alt-coins proved there is nothing but thin air holding them up - no real demand whatsoever! I'll take a look at some charts today. Now these wicks can be classed as 'anomalies' in technical analysis but in this case i think we've revealed some of the strong tokens now with real backing.
It is expected that with such large wicks we at least test the centre of the wick on one more terrifying shake-out that isnt actually as bad as the one we just has but feels it because traders and investors are been kicked while their down in a state of panic.
-------------
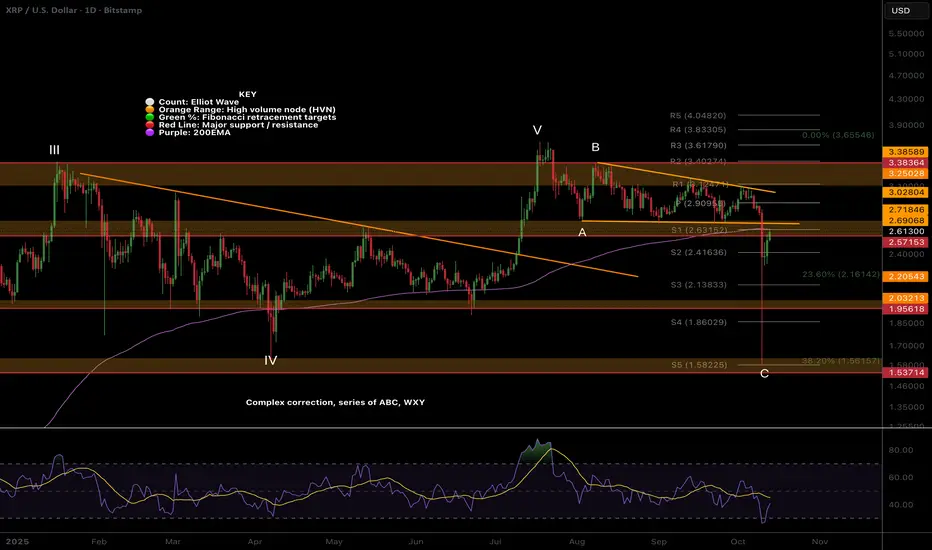
CRYPTOCAP:XRP showed a lot of weakness on that dump hitting the High Volume Node target and macro 0.382 Fibonacci retracement at $1.5, a target i was laughed at for posting a couple of weeks ago! The more 'bullying' that takes place the more I assign probability of hitting that target. Sentiment wins.
Price left a long lower wick which is likely to be revisited as we are now in a bearish structure. The $2 High Volume Node is the likely target. Price is tough quadruple resistance - daily 200EMA, channel lower boundary, High Volume Node and S1 pivot. Lots of supply may come in here.
Wave 2 appears to be complete so once we have one more fearful move down we may accelerate to new all time highs.
RSI hit oversold but with no bullish divergence.
Safe trading
XRP 1D Analysis - Key Triggers Ahead☃️ Welcome to the cryptos winter , I hope you’ve started your day well.
⏰ We’re analyzing XRP on the 1-Day timeframe .
👀 On the daily timeframe of Ripple (XRP), we can see that — for this analysis — I decided to share my perspective from left to right across the chart.
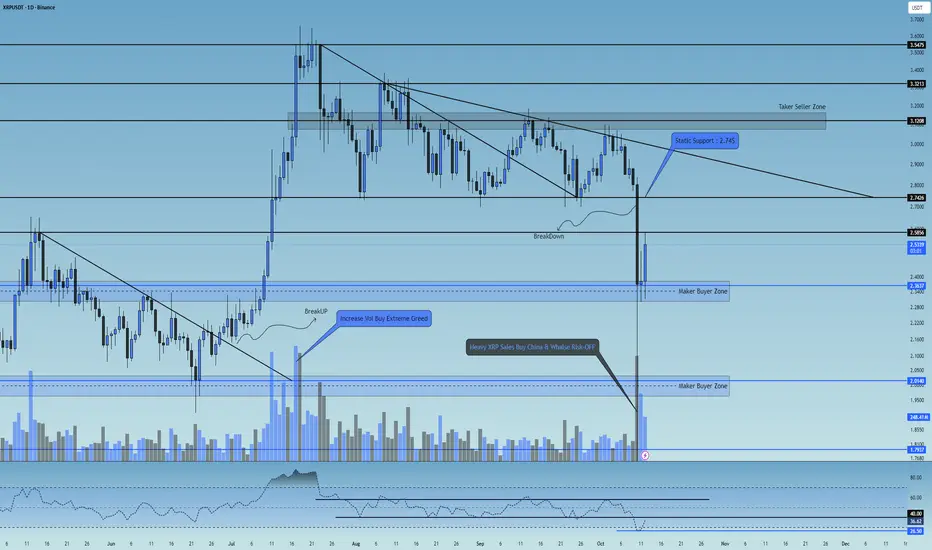
From mid-May to late June, Ripple was trading below a descending dynamic resistance trendline, which it successfully broke to the upside, rallying from $2 to $3.5. In that area, heavy profit-taking occurred, pushing the price downward. The first major support after that sharp rally was at $2.74.
Later, Ripple formed a lower high at $3.23 and a double bottom (equal low) around $2.74, which created a strong static support and positioned the price within the final third of its triangle pattern. It then broke its dynamic trendline resistance again and managed to make a higher high, but this time it failed to show the same sharp bullish momentum. It was quickly rejected from $3.1, which was a taker-seller zone, and pulled back toward its static support.
Buyers didn’t allow the key floor to break — they defended the level aggressively, pouring in additional liquidity to keep XRP above support. However, since no major new capital inflow entered the market and Ripple remained compressed within multiple overlapping triangle formations, a new dynamic resistance was formed. Even with intense effort from buyers, that resistance couldn’t be broken, and eventually, Ripple lost its key static support at $2.74 and dropped further.
Although this move was technically predictable, the speed and depth of the fall were hard to manage in real time. Now, Ripple is sitting above a strong buyer-maker support zone, and much of the selling volume is being absorbed by buybacks. Retail traders are also accumulating again.
The interesting point: Ripple has a critical resistance at $2.58 — if it breaks and holds above this level, it can reignite a bullish move upward. The main resistance zone remains the same old static support area that buyers previously tried hard to protect. Once the $2.74 level is broken back to the upside, Ripple could experience a strong pump.
🧮 On the daily RSI oscillator, Ripple had a very strong static resistance zone around 62, and on its last touch it got heavily rejected, dropping below 50 and 30 without much resistance. Currently, RSI has a support around 26.5 and a key resistance around 40 — these are the main RSI pivot levels. If Ripple’s RSI breaks out of this range, it can trigger higher volatility and momentum aligned with the market direction.
🕯 The recent candle structures — especially the large bearish candle with a long lower wick — caused panic and FOMO among Ripple holders. This led many institutions and big wallets to switch into risk-off mode, dumping their XRP positions and causing a 50% crash within hours.
However, Ripple has recovered well, and the last two bullish candles came with solid buying volume, likely supported by the RSI exiting its oversold zone. With continued buying volume and a break above the key taker-seller resistance at $2.58, Ripple could resume its upward movement.
🧠 If we held Ripple — what would we do?
Personally, if I owned XRP right now, I’d strictly follow capital and risk management, avoiding emotional decisions driven by fear or greed. Ripple is currently forming a new trading range with tight highs and lows, meaning that breaking either boundary will likely start the next major leg of movement.
The upcoming week, especially with the meeting between Trump and the Chinese President, could significantly impact risk markets.
So for now, I’d do nothing major — and if I decided to open a position, I’d do it with minimal risk (and yes, I call that “a bad habit” on purpose 🙂).
This scenario will be updated with more precision and detail in future analyses.
❤️ Disclaimer : This analysis is purely based on my personal opinion and I only trade if the stated triggers are activated .
XRP - Dropped as we planned. NEW signals!!XRP - Dropped as we planned. NEW signals!!
in a previus analysis i told you big drop is coming - that plan played out for 100%
at this moment key area for short - $2.71
key zone for long $1.82 or $1.18

xrp long idea/classic patternI have been trading this pattern for a long time now, and I am waiting for a 3 top to form, the highest in the 3.55 zone from where a strong decline could occur. We have been preparing for a strong uptrend on the hrp at 40% for quite some time now

XRP back to realityOne of the worst shitcoins of them all, short it, avoid it, whatever you do don't buy at least in a year.
GL

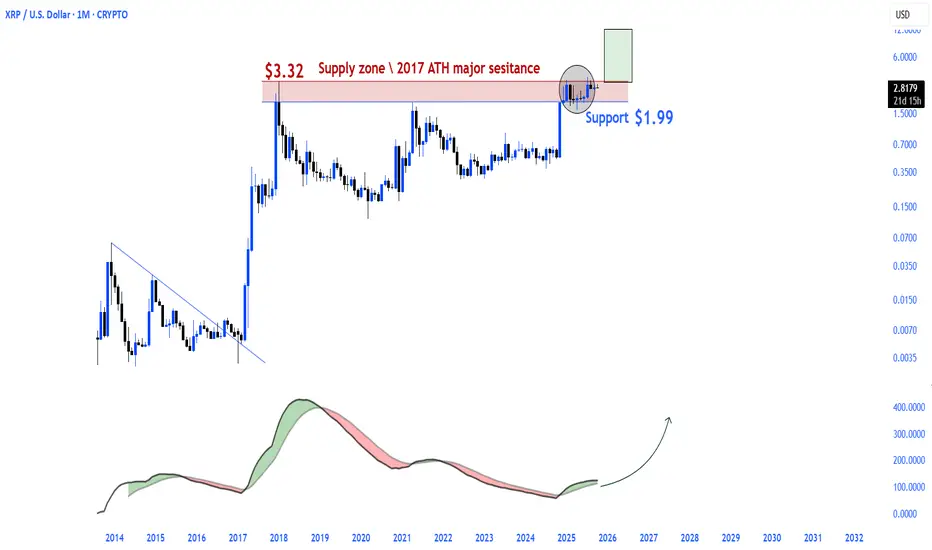
$XRP Explosion After Re-Accumulation.XRP has been strengthening in a horizontal consolidation pattern for quite some time.
The $3.32 region, which was the 2017 peak, was retested on the monthly chart and rejected.
This level was a significant resistance area in the past, but it is now a pivot point that could potentially open the door to a new parabolic rise.
Major support at $1.99, staying above this level confirms the bullish reversal of the structure.
The momentum indicator is in an area where it could move upward.
This table may signal the awakening of a giant that has been silent for a long time.
Emerging from the re-accumulation phase is not always without surprises.
XRP Daily – Can the 0.236 Fib Hold Again?XRP Daily – Testing Support at the 0.236 Fib Level
XRP is once again trading in the green support area that has held since the beginning of August.
This zone aligns with the 0.236 Fibonacci level and forms the base of a descending triangle, with the series of lower highs creating its upper boundary.
Price has also lost the 50MA, and from a system perspective, the structure confirms a short-term downtrend, with Price < MLR < SMA < BBcenter.
If this triangle breaks to the downside, the next significant support sits at the 200MA at $2.60.
Momentum indicators remain weak:
RSI is below its moving average and trending downward, while MACD has already turned red, showing fading strength.
With the broader market showing signs of consolidation after BTC ATH,
XRP reaction here could reveal how altcoins handle pressure at key supports.
For now, this support zone remains key; losing it would confirm a bearish breakout from the triangle pattern.
Bias: Short-term bearish, watching the 0.236 Fib and 200MA as critical levels for reaction.
Always take profits and manage risk.
Interaction is welcome.

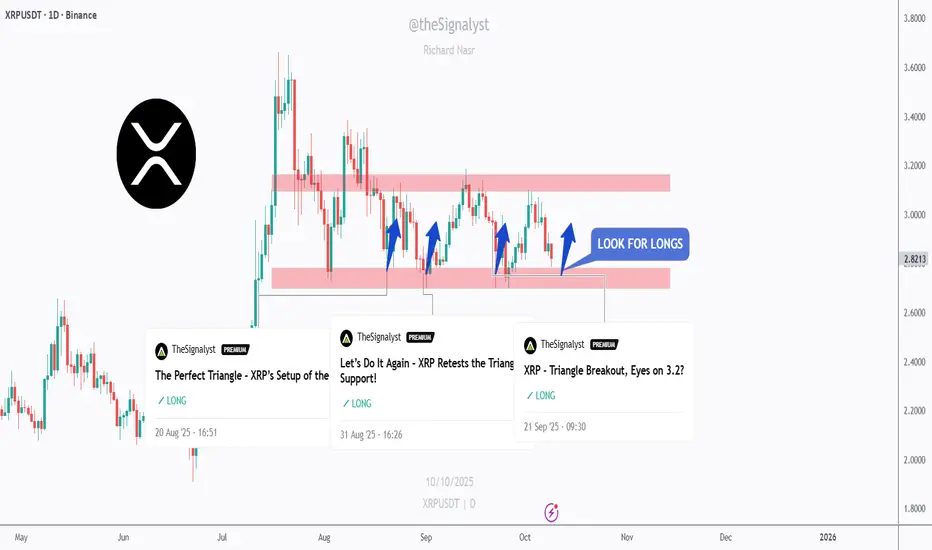
$XRP – Let’s Do It Again!!XRP is once again retesting its daily support zone around $2.60–$2.80, the same level that triggered multiple bullish impulses in recent months.
As long as this red support zone holds, I’ll keep looking for long setups targeting the $3.10–$3.20 supply area.
A daily close below $2.60 would invalidate the setup and shift focus toward the $2.30 support before any potential rebound.
It’s the same play, same level, and the same structure. Let’s see if XRP delivers again! 💪
⚠️ Disclaimer: This is not financial advice. Always do your own research and manage risk properly.
📚 Stick to your trading plan regarding entries, risk, and management.
Good luck! 🍀
All Strategies Are Good; If Managed Properly!
~Richard Nasr
XRP Update📊 CRYPTOCAP:XRP Update
CRYPTOCAP:XRP is testing the red resistance zone 🔴
If it breaks out, the first target will be the green line level 🟢

XRPUSD - A Realistic Indicator?This indicator predicts a massive increase for XRP with tops at $100
That is a massive move on this Weekly timeframe
What do you think?
Indicator Idea

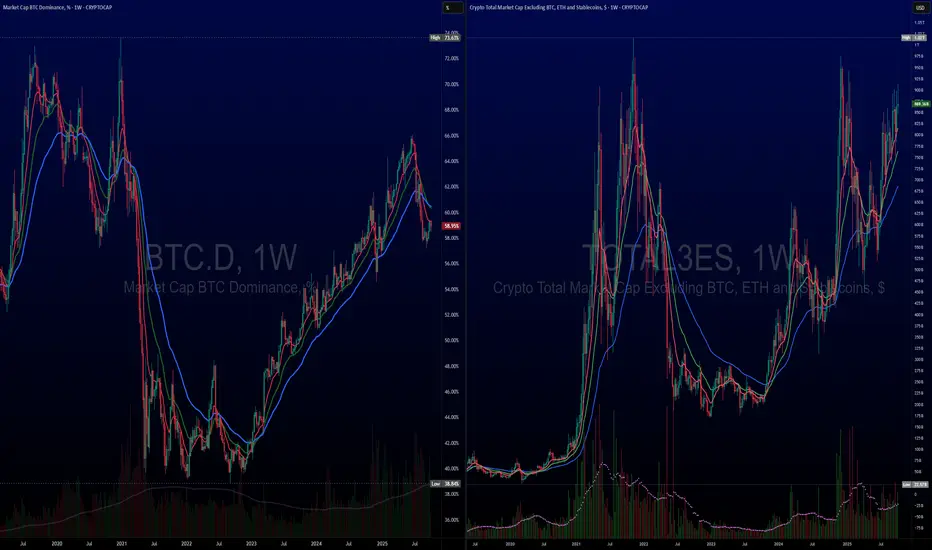
Crypto = Stocks, saying this since 2021Sorry for not posting as much
Want more? A lot more? See profile for more info.
Until we see a significant shift and change to our theses since 2021 >Crypto = Stocks. People were clamoring institutions. When big boys come to the party things change. Deal with that now. It is not the same game.
Since 2021 we've been saying that Crypto was no longer the same and that it turned into a similar asset as stocks.
Since then the top 10 have done well & most coins, especially after top 25, have suffered.
See the following charts to compare. Not in any order.
It's kind of like NASDAQ:NDX index vs CRYPTOCAP:BTC index.
Then the largest tech companies vs the largest Crypto.
NASDAQ:META NASDAQ:MSFT NASDAQ:NVDA = CRYPTOCAP:SOL CRYPTOCAP:XRP CRYPTOCAP:BNB Capish?
XRP - 20% move is COMING!! BIG OI rise!!XRP - 20% move is COMING!! BIG OI rise!!
open interest increased by 154m Xrp coins
many times fater such thing price did significant move
in a case of break donw it could reach 2.4

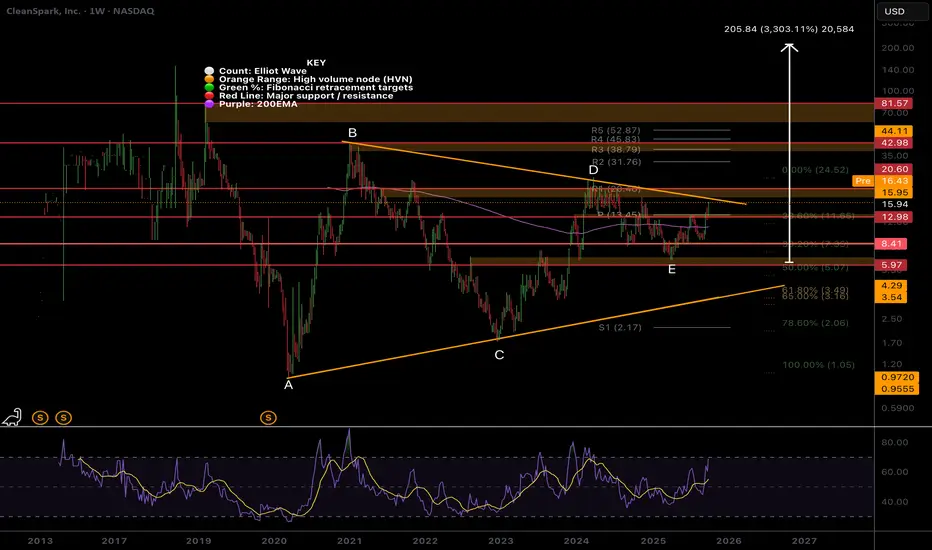
CLSK Testing Macro Triangle Upper Boundary!NASDAQ:CLSK Macro analysis shows a multi-year triangle has completed at the mid EQ, where price has the highest probability of completing wave E. CRYPTOCAP:XRP Did a x10 after this breakout and I am expecting similar move with CLSK.
Price should consolidate for a while in $16-$20 range as it works through wave D and trend-line resistance. Downside target is the weekly pivot at $13.45 which could offer a great buy!
All time high sits at $80, triangle pattern target is extremely high at $200 (triangle height measured from wave E bottom) but take this with a pinch of salt and keep your profit taking realistic! Crazier price moves have happened!
Weekly RSI is not yet oversold and price often gathers months of strong momentum when RSI gets to these levels reinforcing the analysis.
Safe trading
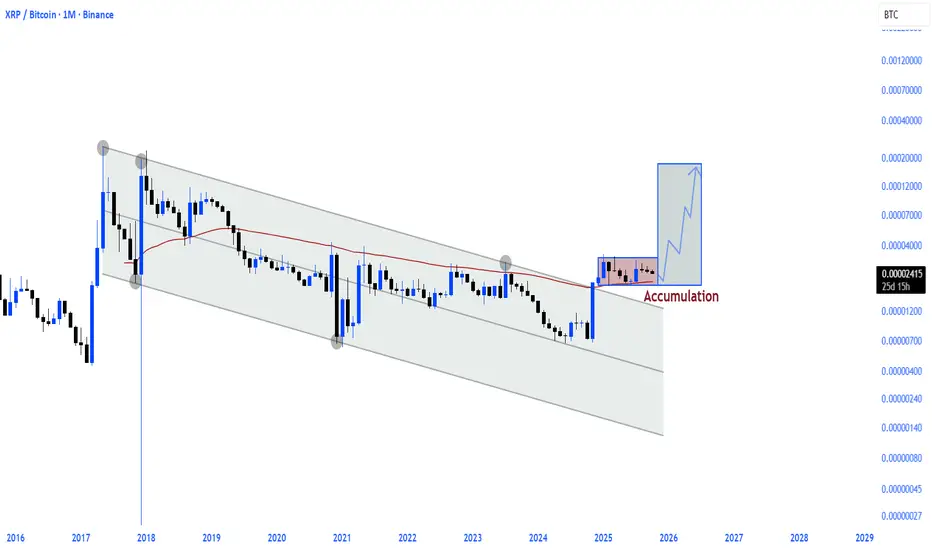
$XRP / $BTCThe 7.5-year descending channel broke in November 2024
The resistance level (50EMA), which served as a significant barrier, was broken in November 2024 after 5.5 years, and accumulation is currently occurring above this level.
The Ripple rally is definitely going to be very hot.
XRP 1H Analysis - Key Triggers Ahead☃️ Welcome to the cryptos winter , I hope you’ve started your day well.
⏰ We’re analyzing XRP on the 1-Hour timeframe .
👀 On the 1-hour timeframe, XRP recently completed a solid bullish rally, reaching resistance around $3.06, before retracing toward its local support zone near $2.94. The coin has tested its top level about three times, getting rejected each time under selling pressure. After the latest rejection and rebound from the $2.94 zone, a short-term trigger has formed around $2.98 — a breakout above this level could significantly increase the likelihood of a resistance breakout.
🧮 The RSI oscillator shows that after ranging below the 50 zone, it has now crossed above it and is heading upward. A 1-hour candle close above the trigger zone would confirm bullish momentum; otherwise, the move risks failing.
🕯 The recent candle structure on the 1-hour chart has been relatively range-bound, partly due to low market activity during holidays. However, with increasing volume and the larger size of recent bullish candles, there’s potential for stronger upward continuation.
🧠 For XRP positions, traders can consider low-risk entries once a candle closes above the marked trigger zone in this analysis. Rising volume and strong candle closures may fuel volatility and expand long opportunities.
❤️ Disclaimer : This analysis is purely based on my personal opinion and I only trade if the stated triggers are activated .

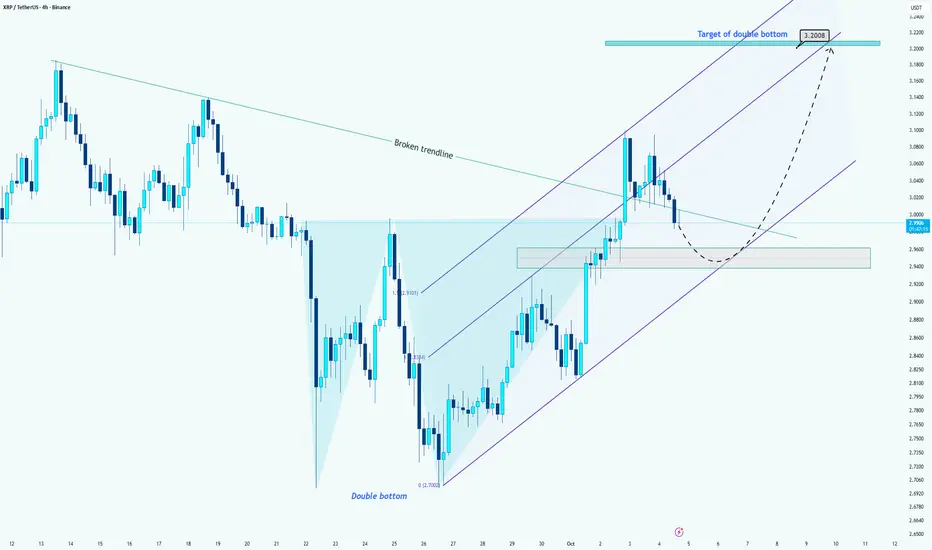
XRP/USDT –> Double Bottom Formation Confirmed!Hi guys!
After breaking above the descending trendline, XRP has confirmed a double bottom pattern around the 2.70 area.
Currently, the price is moving inside an ascending channel, but after facing resistance near 3.10, it has entered a correction phase. The 2.94–2.96 area now acts as a key support zone, aligning with both the previous neckline and the channel’s midline.
If this support holds, we can expect the price to bounce upward and resume its bullish momentum toward the 3.20 area, which represents the target of the double bottom.
However, if the 2.94 support breaks down, we might see a deeper correction toward the lower channel boundary before any continuation move.
🎯 Targets:
First target: 3.20 USDT (double bottom projection)
Extended target: 3.30 USDT (upper channel resistance)
XRP Price Action – Accumulation Before GrowthXRP is currently navigating a phase defined by liquidity-driven swings and rapid sentiment shifts. After the market endured a heavy decline, buyers have re-emerged, showing resilience through aggressive rebounds. This behavior reflects a deeper pattern: sellers are losing efficiency in driving the market lower, while buyers are treating each dip as an opportunity to accumulate.
In the short term, the market appears to be balancing between two forces — the need for a corrective retracement to secure liquidity, and the desire of participants to push price into higher zones. This tug-of-war often results in shallow pullbacks, where temporary declines are quickly absorbed. Such behavior highlights that speculative capital is rotating back into XRP, aligning with broader risk-on sentiment across digital assets.
If this pattern holds, the near-term trajectory favors gradual expansion, with the asset likely aiming for higher valuations. However, investors should remain aware that short-term corrections are less about trend reversals and more about the mechanics of liquidity collection.
