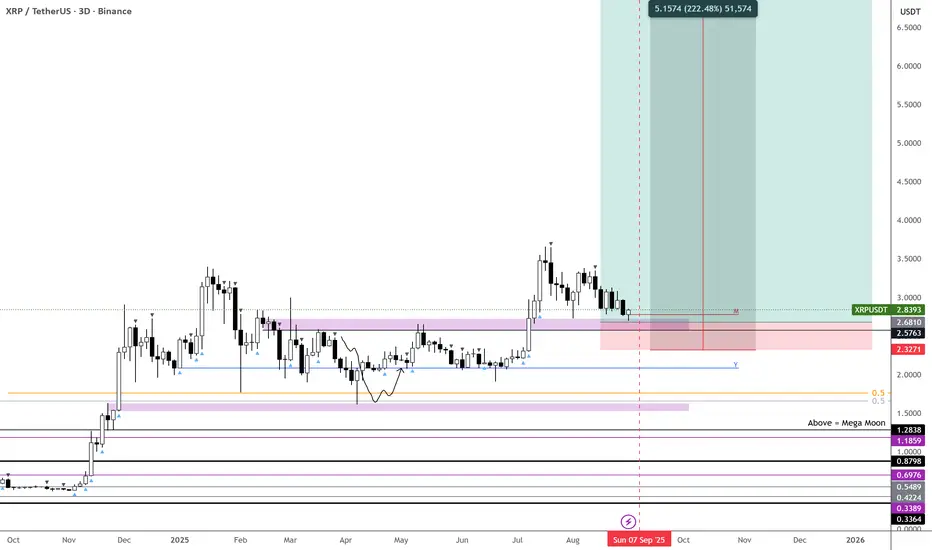
XRP: Lacks Momentum Despite Modest GainsRipple’s XRP is trading slightly higher today compared to last Monday, but it still hasn’t found real momentum. For now, it’s expected to continue moving upward toward resistance at $4.09 as part of turquoise wave B, before the correction of wave (2) is finally completed. The following magenta wave (3) should then drive gains above the $4.09 resistance level. If the altcoin manages to break directly above this level, this will suggest that wave alt.(2) has already wrapped up.
J-xrp

From Sideways to Skyward: XRP Setting Up Another BoomXRP has been following a simple pattern, accumulate, then boom. We saw this play out earlier where months of sideways action led to a sharp rally.
Right now, the weekly chart is showing a similar setup. Price is consolidating again inside a tight range, holding steady in the current zone. This looks like healthy accumulation before the next move.
If history repeats, a breakout from this consolidation could trigger another explosive leg upward, potentially sending XRP much higher. As long as it stays above the accumulation box, the bias remains bullish.
DYOR, NFA
Next updates coming soon!

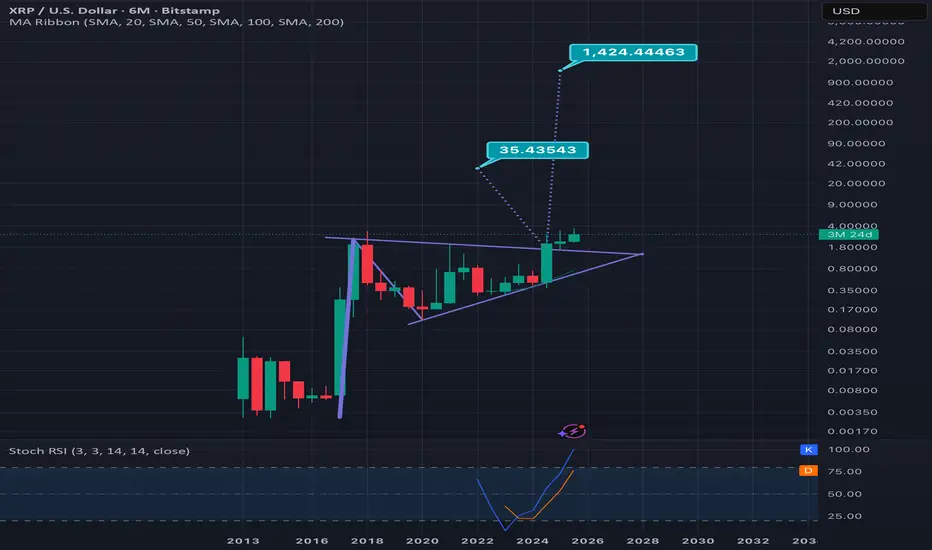
6 month log scale xrpusd chart updatedMy previous version of this chart I placed the breakout tarts arbitrarily before the actual breakout so I wanted to post an updated version with the two targets lined up directly at the point of the breakout. Smaller target is for just the triangle and the bigger target for the entire bullish pennant. Remember this being a 6 month time frame this could take several years still even to hit the highest target *not financial advice*
XRP — $2.5 Liquidity Zone Could Trigger the Next RallyAfter hitting a new all-time high (ATH) on 18th July, XRP failed to hold the previous ATH ($3.40) as support. This breakdown led to a –25% drop, finding support at the 0.5 Fib retracement of the $1.90 → $3.66 move, followed by a solid +24% bounce back to the pATH (200B MC at $3.36) and 0.702 Fib retracement → an ideal short opportunity.
Now XRP has been trending in a descending triangle pattern for 50 days, with $3 acting as the key resistance. This level is the Point of Control (POC) of the last 75-day trading range, adding weight to its importance. On top of that, the anchored VWAP (~$3.035) is currently reinforcing $3 as additional resistance.
🧩 Confluence Support Zone ($2.665–$2.45)
Liquidity cluster: many stop-losses reside here
Anchored VWAP (support): ~$2.62
Yearly anchored VWAP: $2.59 → strong support level
Golden Pocket (0.618–0.666): $2.5777–$2.4936
21 EMA ($2.665) / 21 SMA ($2.576) (weekly): dynamic HTF support
233 EMA ($2.44) / 233 SMA ($2.53) (daily): strong moving average cluster
Market Cap Support: $2.52 aligns with the $150B level
1.0 Trend-Based Fib Extension: $2.4498 → aligning perfectly with the $2.5 support zone as a reversal point
This creates a high-probability long entry zone between $2.665–$2.45, with multiple overlapping technical factors.
🟢 Long Trade Setup
Entry Zone: $2.665–$2.45
Stop-Loss: Below $2.25 for now, to be adjusted once price action confirms a reversal.
Potential Gain: up to +60% depending on execution
Technical Insight
After 50 days of correction, XRP is approaching a major liquidity and confluence zone.
The golden pocket, VWAP, EMA/SMA clusters, market cap support, and 1.0 Fib extension all stack together at around $2.5, making it a powerful reversal point.
Meanwhile, $3 remains the key resistance, reinforced by the POC of the last 75-day range and the anchored VWAP (~$3.035). Bulls must reclaim this level to confirm bullish continuation.
Key Levels to Watch
Support: $2.665–$2.45 (reversal zone)
Resistance: $3.00
🔍 Indicators used
Multi Timeframe 8x MA Support Resistance Zones → to identify support and resistance zones such as the weekly 21 EMA/SMA.
➡️ Available for free. You can find it on my profile under “Scripts” and apply it directly to your charts for extra confluence when planning your trades.
_________________________________
💬 If you found this helpful, drop a like and comment!

XRP - MacD selling divergenceCan you see it?
Don't forget the backtest out of the flag.
I don't think it'll be too big yet, they still want the daily pivot squeeze into Oct for the ETF's.
It also looks like coinbase isn't selling off XRP, big money are moving their XRP off coinbase itself into more secure places. Prepare yourself.

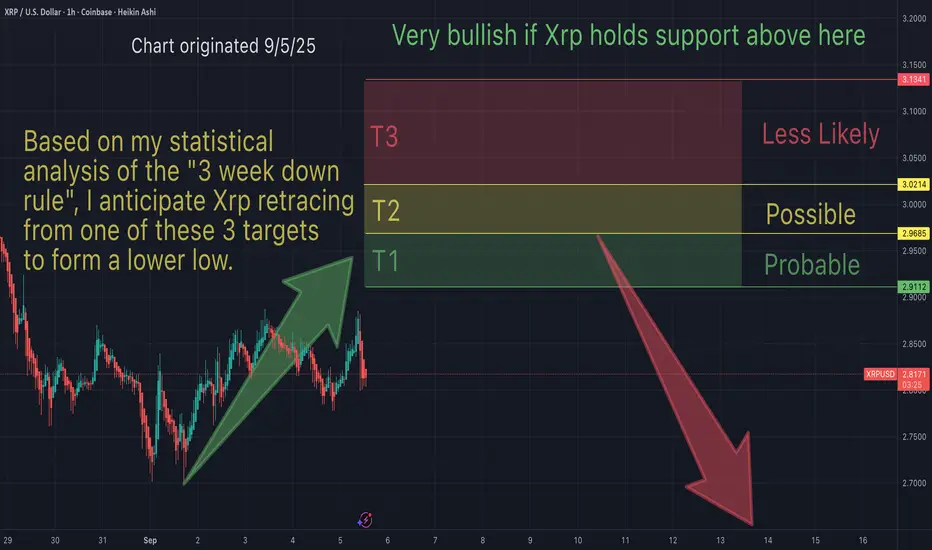
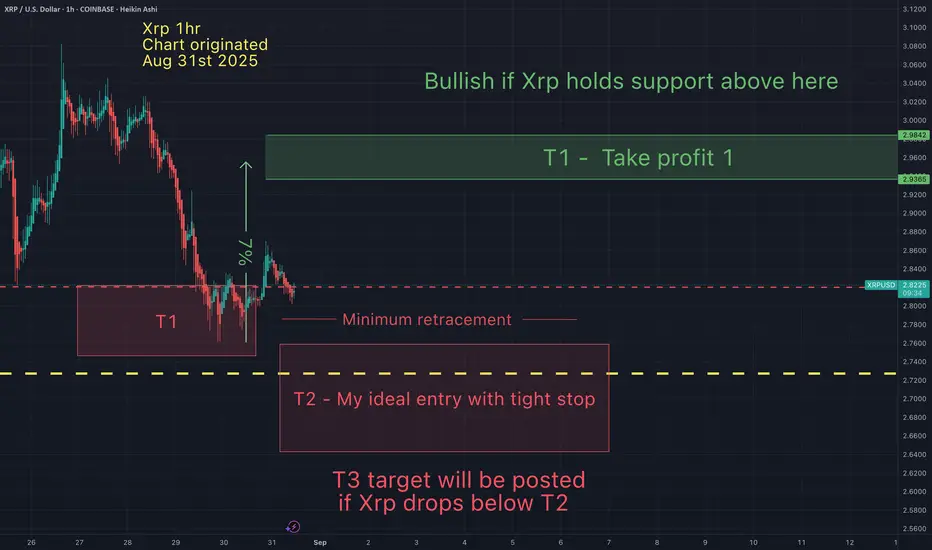
Xrp - support and resistance & take profit targetsBased on my statistical analysis of the "3 week down rule", I anticipate Xrp retracing from one of these 3 targets...to form a lower low.
I hope I'm wrong, but I'm just following the historical data and considering the statistical analysis. I can only follow the stats to anticipate price action.
This trade idea gets invalidated above T3. Although less probable, if Xrp breaks above T3 (and holds support), I become super bullish.
May the trends be with you.
XRP Ready? NFP Volatility+Bitcoin Rally Could Drive XRP to $3.10In today’s XRP update, we analyze the 4-hour chart as price consolidates just under key resistance. After defending $2.75, buyers have managed to push XRP back toward $2.87 and $2.93. These are the levels that will decide whether momentum shifts in favor of the bulls. If $2.93 is reclaimed, the path opens toward $3.09 and possibly higher. On the downside, supports remain at $2.81 and $2.75, with deeper zones at $2.67 and $2.65 if selling pressure increases.
This update also comes on a major day for global markets, with the U.S. Non-Farm Payrolls release driving volatility across assets. Bitcoin has already shown bullish attempts on the 4-hour chart, which I covered in detail earlier today on the channel. The big question now is whether XRP can align with that strength by breaking its own resistance barriers.
XRP $5.50XRP is holding above the support and weekly MA20, and it's expected to make its fifth move with a target of around $5.50.

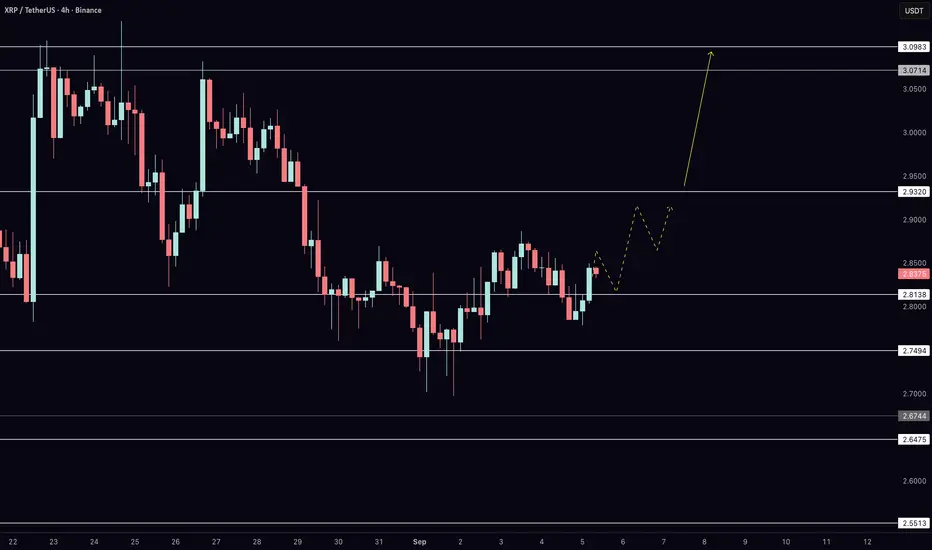
XRP Price Update: Next Targets $2.93 and $3.19In today’s XRP update, we focus on the 4-hour chart where price is consolidating between $2.81 and $2.87. After defending the $2.75 level yesterday, XRP is trying to build a recovery structure. The big question now is whether buyers can reclaim $2.87 and push toward $2.93. A breakout there would open the path to $3.09, which is the key resistance on this timeframe.
On the downside, immediate support is at $2.81. If lost, pressure shifts back to $2.75, and below that the deeper buyer zones at $2.67 and $2.65 come into focus. My bias remains for upside, but confirmation comes only with resistance breakouts. Watch these levels closely as the short-term structure develops.

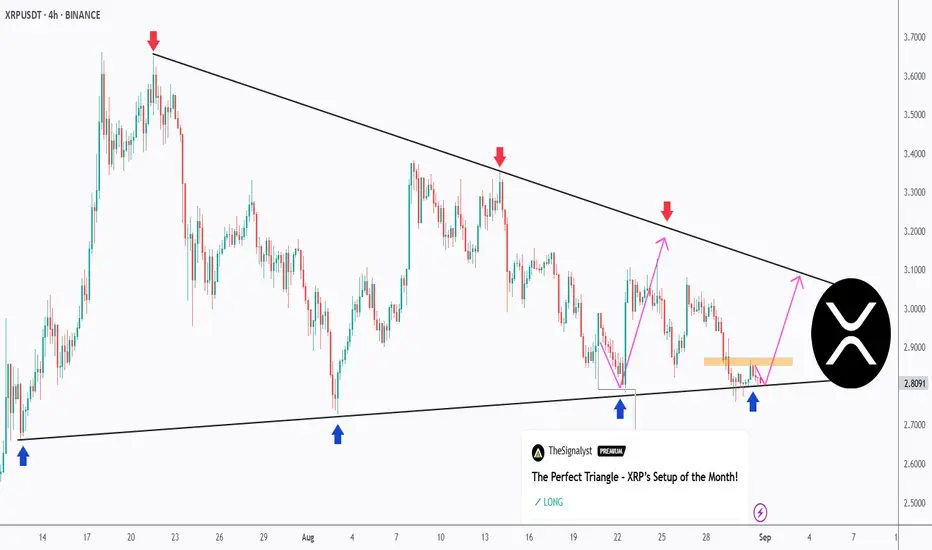
XRP 4H Breakout?XRP has been forming a triangle pattern with a flat low and lower highs compressing into a point.
Generally this suggests that the bulls are willing to buy at a strong level but with declining strength, the bears on the other hand are repeatedly pushing price back down from lower points each time which leaves two possible scenarios that are actionable:
Bullish - A breakout above the downtrend line with significant volume, I think BTC will have a large part to play in this. Following the breakout a flip in structure with new highs and new lows would give the signal XRP is ready to go higher.
Bearish - This chart pattern generally does lead to continuation of selling off, the trigger would be a loss of the green box/equal lows. Should price break below a lot of the previous rally would look to be infilled, target price would be $2.35
Two good triggers and plans for each, anything in between is not actionable to me as I have no strategy that I am confident could produce a profitable outcome in the mean time, I'll be patient instead.

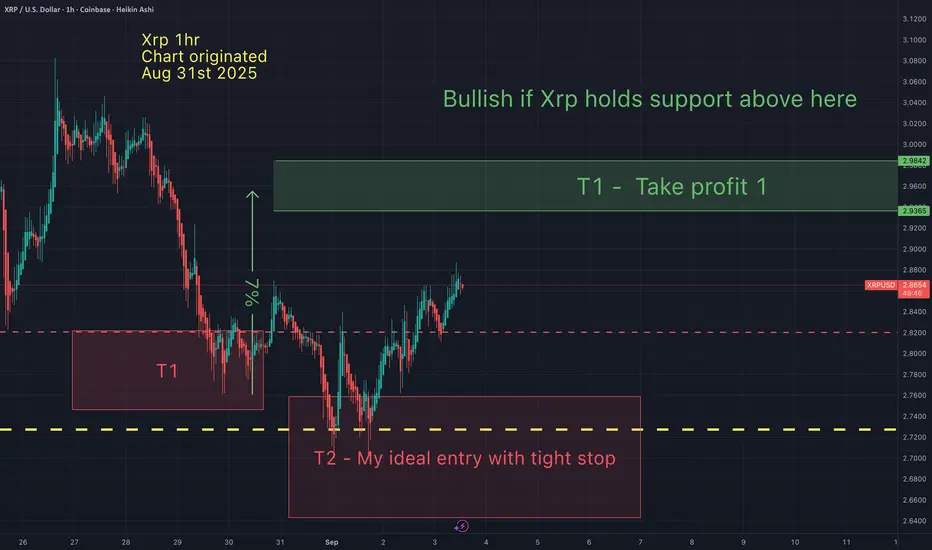
Xrp - My ideal entry target was hit. Now approaching take profitMy ideal entry at T2 was hit, as anticipated. Now approaching take profit 1.
I unfortunately don't expect this rally last long before a retrace (or possibly a reversal). I hope I'm wrong. Either way, I will soon be taking profits at the indicated targets.
May the trends be with you.
$XRP – Optimal Entry Zone
Honestly was expecting more from MARKETSCOM:RIPPLE , but it is what it is. We’re back at the second entry level — and this zone decides the next chapter.
📍 Buying zone: $2.50 – $2.70
⚠️ Invalidation: loses this level and it likely stays quiet for a while
🎯 Exit: take profits whenever it fits your plan
This is the kind of spot you want to pay attention to:
S/R flip ✅
Pivotal level ✅
Retest of breakout ✅
-30% from recent highs ✅
If you haven’t jumped into CRYPTOCAP:XRP yet, this is as good a level as it gets.
👉 Will LOL if this goes straight into $2 just to scare everyone out… only to send it into $5 on the next swing. BINANCE:XRPUSDT
XRP Setup – 200-Day EMA & 61.8% Fib ConfluenceAfter making a higher high in mid-July, XRP has been retracing to establish its higher low. The price is now approaching the 200-day EMA, the 61.80% Fibonacci retracement, and a key prior resistance zone around $2.60. This confluence creates a strong area where bulls may look to defend.
Trade Setup:
• Entry Zone: $2.50 – $2.60
• Take Profit Targets:
🥇 $3.10
🥈 $3.50
🥉 $3.80
• Stop Loss: $2.30

XRP Full Green Candle · Great News · Reaction at SupportXRP is looking great right now. There is nothing better than a good reaction at support.
Remember this support zone? The orange space on the chart.
This support zone has been tested multiple times since 2-Aug., a month ago. 30 days holding and this time we have the first bullish candle—full green—around this level and this means that the bulls are finally showing their face.
It is hard to believe that it has been already 45 days since the last high, but this is good because the retrace is running its course and as soon as it ends we get the next bullish wave.
More good news. The next major advance will be nothing like before. The last one lasted less than a month, the next one can go for 2-3 months or more. So at least twice the length of the previous one. There is still plenty of room available for growth.
Targets
These are the numbers based on the short-term. For the numbers we were using previously, more accurate, please find a previous publication. You can do so by going to @MasterAnanda and typing XRPUSDT on the search filter. Go a bit lower and you will see hundreds of charts with long-term targets and all-time high projections.
Thanks a lot for your continued support.
Namaste.

The XLM chart looks STELLARSince making a High in January of 2018 at just shy of a dollar.
This Asset has made subsequent higher lows during the following two bear markets for #Altcoins. Suggesting strong accumulation from "smart" money.
The last bear was an extended bear for alts. Which allowed for even more time to accumulate this asset.
Leading to a pressure cooker situation with a clear level that will mark the explosion.
The horizontal level at around 52 cents is clear level for which this asset must close to ignite what could possible be a substantial rally!

WHEN NOTHING FEELS RIGHT XRP⚡ Hey hey, hope things have been well. Here with a quick and short idea for you guys, been juggling a lot lately but wanted to take the opportunity to get a quick idea out while I had the chance so thanks for stopping by.
⚡ We sit here at a time where nothing seems to feel right in a few ways, at a time when we'd expect things to be pushing with all the hype we had going for us from the crypto legislation and the break above that $3 resistance showing the strength behind the market and XRP.
⚡ That being said we've still got our rules and channels which will continue to apply regardless of sentiments and news. Can see how the last month or so we've been pulled down thanks to these two major descending channels with our second one forming after we broke out and broke away from $2.7 before we again slowly descending back to the $2.7 range where we currently stand.
⚡ Technically speaking we're at a support point, we've bounced back up from here before so it'll be a good reference point for active traders on whether or not we'll be headed for another possible breakout or if we'll continue to trend further down within the descending channel until we regain that 200 EMA.
⚡ Next few days should be pretty eventful, especially once memorial day weekend wraps up I'm sure traders will want to get active and make a move but that brings us to my next highlight.
⚡ Historically speaking September is the weakest performing month for the market, it's the month we see stocks and indexes usually stumble a bit before they recover as the new year then approaches so that should be kept in mind. I'd love to see a breakout but if not this would also be a great time to accumulate given that within the next year or two we'll more than likely be trading above that $5 and $6 range.
⚡ Have to go for now but wanted to get a quick idea out and give some reference points with these descending channels. They will either help us get a breakout or push us further if we can't break out of them so keep that in mind along with Septembers historical performance. Much as we love the present looking on the past helps identify and note many key and potential plays.
⚡ As always, thank you so much for the support and all the best till next.
Best regards,
~ Rock'

XRP Is Ready For Blast Off!I foresee a big pump coming for XRP. When support is found, the big picture accumulation pattern should take us soaring to new all-time highs in a mass adoption phase. I am very excited about this coin and firmly believe we will see a strong run. Based on fractal analysis, it looks very similar to its first accumulation fractal.
As always, stay profitable.
- Dalin Anderson

XRP | Looking for All-Time HighsXRP | Looking for All-Time Highs
📊 Market Sentiment
Overall sentiment remains bullish, supported by expectations of a 0.25% rate cut in the upcoming FOMC meeting. A weakening USD and increasing global risk appetite are creating favorable conditions for further upside in crypto assets.
📈 Technical Analysis
Price ran liquidity at $2.81 and closed above with a strong reaction.
A 4H demand zone formed after the break of structure, and price found support there.
Currently, price is moving towards the bearish trendline.
If price breaks and closes above this bearish trendline, I will be looking for long entries targeting new highs.
📌 Game Plan
I will wait for price to break and close above the bearish trendline.
Then, I will look for a retest and bounce slightly below or at the trendline before entering.
🎯 Setup Trigger
A 1H market structure shift will be my confirmation for entry.
📋 Trade Management
Stoploss: 1H swing low confirming the BOS
Targets: TP1: $3.14 | TP2: $3.38
💬 Like, follow, and comment if you find this setup valuable!
⚠️ Disclaimer: This content is for informational and educational purposes only and does not constitute financial, investment, or trading advice. Always do your own research before making any financial decisions.

XRP/USD 1D Chart ReviewFormation
The chart shows a narrowing symmetrical triangle (orange lines).
The price is now in the lower part of the triangle, with support around $2.80–2.79.
If the price breaks out of this consolidation, we could see a larger trend move.
Supports
$2.80–2.79 – local support (lower line of the triangle).
$2.63 – strong horizontal support, reinforced by the earlier rebound.
$2.46 (SMA200) – key intermediate-term level.
Resistances
$3.00–3.08 (SMA50) – first major resistance.
$3.17 – next barrier.
$3.42 – strong resistance from July.
Indicators
MACD: below the 0 line, negative histogram → bearish signal, but no strong downward momentum yet.
RSI (41): close to the oversold zone, but still neutral-weak – no clear divergence.
SMA50 (red) is falling and is above the price → selling pressure.
SMA200 (blue) is rising and acting as medium-term support.
Scenarios
Bullish – a rebound from the lower boundary of the triangle (2.80) and an attack on $3.00–3.08. A breakout from the upper boundary of the formation will open the way to $3.42.
Bearish – a breakout below the $2.80–2.79 zone → a test of $2.63 and deeper into $2.46 (SMA200).
Summary
The market is at a critical juncture – price is squeezed within the triangle, indicators are neutral-weak, and volume is decreasing. A breakout from this consolidation (most likely in early September) will set the course for the next move.
👉 If you're trading short term, maintaining the $2.80 level is key.
👉 If you're trading medium/long term, only a break above $3.08–3.17 will provide a strong bullish signal.

Let’s Do It Again – XRP Retests the Triangle Support!XRP continues to coil inside a textbook symmetrical triangle on the 4H timeframe.
🔻 Sellers remain active at the descending trendline (red arrows).
🔹 Buyers are once again stepping in at the rising support (blue arrows).
📉 Price is now retesting the lower bound of the structure. As long as this zone holds, we can anticipate another potential bounce toward the upper boundary.
🚀 For the bulls to take full control, a break above the last high marked in orange is needed. A confirmed breakout from this triangle will likely define XRP’s next major move — either continuation higher or a bearish breakdown.
This clean and well-defined triangle keeps XRP among the most exciting setups to watch right now!
⚠️ Disclaimer: This is not financial advice. Always do your own research and manage risk properly.
📚 Stick to your trading plan regarding entries, risk management, and trade execution.
Good luck!
All Strategies Are Good; If Managed Properly!
~Richard Nasr
Xrp - Support and resistance & my take profitsThese are my Xrp support and resistance & my take profits. I've been patiently waiting for price to come to me. Now that my T1 has been hit, I'm hoping for a swipe of those lows for my ideal entry. I am cautiously bullish, because there is a chance Xrp goes one leg lower. For now I will chance a long from T1 and T2 (with tight stops) and take profit at my green T1 box.
Ripple ( $XRP ) is literally the reflection of 2017The current wave movements of XRP appear to be a reflection of the period from 2013 to 2017. We are in a re-accumulation phase before the next major upward wave.

XRP LABOR DAY SALEXRP HIT A CRITICAL SUPPORT ZONE BETWEEN $2.80-$2.76
Xrp can head back towards $3 to test resistance. If xrp breaks $3 it can head to $3.50 and breakout towards $5 on the weekly charting
This is not financial advice. Good luck!
-R2C
