NIKKEI hit the top of 17-year Channel. Huge Bear Cycle starting.Nikkei (NI225) has been trading within a long-term Channel Up since the October 2008 bottom of the U.S. Inflation Crisis. This month it made direct contact with the top (Higher Highs trend-line) of that pattern following a strong Bullish Leg rally since the April 2025 Low on the 1M MA50 (blue trend-line).
As you can see, this pattern displays a high degree of symmetry. Its Bullish Legs can be distinguished into two categories: normal (blue rallies) and aggressive (green rallies). The one that just topped seems to be a normal one as it rose by +75.88%, similar to the +64.78% and +62.65% of the previous ones. The aggressive Bullish Legs (green rallies) have so far been two and are identical" +158.87% and +156.63%.
After aggressive Bullish Legs, the market has always pulled back to he 1M MA50 near the 0.382 Fibonacci retracement level, where it bottomed (blue circles). The normal Bullish Legs have instead had more aggressive corrections (Bearish Legs) as the two we've had so far bottomed just below their 0.618 Fibonacci levels (green circles). The latter one (March 2020) even made contact with the 1M MA100 (green trend-line). Notice also that the Bearish Legs after normal rallies have also been longer in time (around 18 months) than those after aggressive rallies.
This is what we're also expecting this time around. The 0.618 Fib from the current Top is at 38500, which is our long-term Target within a 18 month time-frame. By that time it may very well make contact with the 1M MA100 again.
It is worth noting here that the 1M RSI is massively overbought, another sign of a market Top historically. The presence of the Symmetrical Support Zone also can help determine the next long-term buy entry in combination with the 38500 Target.
---
** Please LIKE 👍, FOLLOW ✅, SHARE 🙌 and COMMENT ✍ if you enjoy this idea! Also share your ideas and charts in the comments section below! This is best way to keep it relevant, support us, keep the content here free and allow the idea to reach as many people as possible. **
---
💸💸💸💸💸💸
👇 👇 👇 👇 👇 👇
Japan225

JP225 Bullish Continuation | Liquidity + Macro Tailwinds📊 JP225 (Japan 225 Index CFD) – Trade Opportunity Guide
Timeframe: Day Trade / Swing Trade
Market: Indices (CFD)
🧠 Market Bias
📈 Bullish Plan Active
The Japan 225 Index continues to benefit from macro support, capital inflows, and currency tailwinds, keeping upside momentum intact.
🎯 Entry Strategy
💡 Flexible Entry Approach
You may enter at any favorable price level based on your execution style.
However, Thief Trader methodology prefers layered limit entries to optimize risk and positioning:
🧱 Limit Entry Zones
53,000
53,300
53,600
53,900
📌 Layering allows participation without emotional chasing and improves average entry price.
🟢 Target Zone
🎯 Primary Target: 55,000
Why this zone matters:
Overbought conditions expected near highs
Strong institutional profit-booking zone
Psychological round-number resistance
Correlation-based exhaustion signals
⚠️ Reminder:
Dear Ladies & Gentlemen (OG Traders), this target is not a fixed rule.
Secure profits based on your own risk management and market conditions.
🔴 Stop Loss
🛑 Protective Stop: 52,700
⚠️ This is a reference risk level, not a mandatory stop.
Capital protection is your responsibility — manage risk like a professional.
🔗 Related Markets to Watch (Correlation Focus)
💱 USD/JPY
Weak JPY = Strong JP225
Yen depreciation boosts Japanese exporters and equity valuations
📈 US30 (Dow Jones Index)
Risk-on sentiment in US equities often fuels upside momentum in JP225
📊 SPX500
Global equity sentiment confirmation
Strong US indices support Asian index continuation
💵 DXY (US Dollar Index)
Rising DXY → pressure on JPY → bullish for Japan 225
🌍 Fundamental & Economic Factors (Trade Drivers)
📌 Key Supporting Factors
Continued loose monetary stance from Bank of Japan
Strong foreign institutional inflows into Japanese equities
Yen weakness enhancing exporter earnings
Stable inflation expectations relative to global peers
📅 Upcoming Factors to Monitor
Bank of Japan policy statements & outlook
Japan CPI & wage growth data
Global risk sentiment from US macro releases
US bond yields impacting JPY direction
💡 As long as JPY remains weak and global risk appetite stays positive, JP225 remains structurally supported.
🌐 THE MACRO DOJO (Fundamental Factors) 🏯
✅ BULLISH WINDS 🍃:
🇯🇵 "Takaichi-nomics": PM Takaichi is full-throttle on weak Yen policy & delaying rate hikes—rocket fuel for export-heavy Nikkei.
🏛️ Corporate Revolution: Tokyo Stock Exchange forcing better shareholder returns (buybacks & dividends)—global money is flowing in.
💰 Valuation Gap: Nikkei still trades at a ~21% DISCOUNT to S&P 500. The re-rating story is intact.
❌ BEARISH THREATS ⚠️:
**💴 **The Yen is the Nemesis****: A sharp, intervention-driven Yen surge can tank the index. Watch USD/JPY like a hawk! 🦅
🌍 Global Risk-Off: If U.S. tech (Nasdaq) sneezes, Nikkei can catch a cold. Monitor NQ100 Futures.
🕶️ Thief Trader Mindset
“Markets don’t reward emotions — they reward patience.”
“Layer smart, risk less, let price come to you.”
“Consistency beats aggression, every single time.”
🔥 Trade calm. Trade clean. Trade like a professional.

JP225 CFD Price Action Favors the Bulls🎯 JP225 (JAPAN 225 Index CFD) | Bullish Momentum Play | Day/Swing Trade Setup 📈
🔥 TRADE OVERVIEW
Asset: JP225 (Japan 225 Index CFD - Nikkei 225)
Bias: 🟢 BULLISH (Confirmed via SMA Pullback Strategy)
Trade Type: Day Trade / Swing Trade
Risk Level: ⚠️ Medium-High (Manage Your Position Sizing!)
📊 TECHNICAL SETUP
✅ Entry Strategy:
FLEXIBLE ENTRY - You can enter at ANY CURRENT PRICE LEVEL as momentum confirms bullish structure
Simple Moving Average (SMA) pullback confirmed ✔️
Price action showing accumulation phase before continuation
🎯 Take Profit Target:
TP: 56,000 🎯
⚠️ Key Resistance Zone Alert! - Police force level acting as:
Strong historical resistance
Overbought territory on oscillators
Potential bull trap zone (correlation factors present)
RECOMMENDED: Secure profits near this level! Don't get greedy 💰
🛑 Stop Loss:
SL: 52,400 🚨
This is the "Thief OG's Stop" - invalidation level for bullish structure
⚡ IMPORTANT DISCLAIMER:
Dear Ladies & Gentlemen (Thief OG's) 👋
These TP/SL levels are REFERENCE POINTS ONLY. This is NOT financial advice! Trade at your own risk, manage your own capital, and adapt levels to YOUR risk tolerance. If you're in profit - TAKE IT! Don't let winners turn into losers! 🎲
🌐 CORRELATED PAIRS TO WATCH
💵 USD/JPY (Dollar-Yen):
Strong inverse correlation with JP225
If USD/JPY weakens → JPY strengthens → Can pressure JP225 (export-heavy index)
Current JPY strength could create headwinds ⚠️
💴 EUR/JPY & GBP/JPY:
Cross-yen pairs show risk sentiment
Rising = Risk-ON (bullish for JP225) ✅
Falling = Risk-OFF (bearish pressure) ❌
📉 US Indices (SPX500, NAS100, US30):
Positive correlation - Global risk appetite flows together
Watch overnight US session for Asia open direction 🌏
🏦 Japanese Bank Stocks (8306.T Mitsubishi UFJ, 8316.T Sumitomo Mitsui):
Banking sector health = Nikkei health
Monitor for sector rotation signals 🔄
📰 FUNDAMENTAL & ECONOMIC FACTORS
🇯🇵 Japan-Specific Catalysts:
✅ BULLISH DRIVERS:
Weak Yen Policy - BOJ maintaining ultra-loose monetary policy (supports export competitiveness)
Corporate Earnings Season - Watch for Q4 2024/Q1 2025 results from Toyota, Sony, SoftBank
Tourism Recovery - Continued post-pandemic inbound tourism boom 🛫
Warren Buffett's Japan Bets - Continued confidence in Japanese trading houses
⚠️ BEARISH RISKS:
BOJ Policy Shift Speculation - Any hawkish surprise could strengthen JPY and hurt exporters
Global Recession Fears - Japan's export-driven economy vulnerable to global slowdown
China Economic Weakness - Major trading partner struggles = Nikkei pressure
Energy Prices - Japan imports 90%+ of energy; rising oil/gas = margin compression
📅 KEY UPCOMING EVENTS TO WATCH:
🔔 High Impact News:
Bank of Japan (BOJ) Meeting - Watch for rate decision & forward guidance
Japan CPI (Inflation Data) - Higher inflation = potential BOJ policy shift pressure
US Federal Reserve Decisions - Affects global risk sentiment & USD/JPY
Japan GDP Reports - Economic growth trajectory
Tokyo Core CPI - Leading indicator for national inflation
Manufacturing PMI - Export sector health check
🌍 Global Market Drivers:
US-China Trade Relations - Affects regional stability
Semiconductor Sector News - Tokyo Electron, Advantest are index heavyweights
Oil Prices (WTI/Brent) - Input cost for Japanese manufacturers
🧠 TECHNICAL + FUNDAMENTAL SYNERGY:
Why This Setup Works:
✅ Technical pullback to SMA = clean entry structure
✅ Bullish momentum confirmed = trend alignment
✅ Weak JPY environment = fundamental tailwind for exporters
✅ Global risk-on sentiment = correlated strength in equities
What Could Go Wrong:
❌ Sudden BOJ hawkish pivot = JPY strength kills rally
❌ US market crash = contagion to Asian indices
❌ China data disappointment = export demand concerns
❌ Geopolitical escalation (Taiwan, North Korea) = safe-haven flows OUT of equities
🎓 TRADE MANAGEMENT TIPS:
💎 For Thief OG's (Smart Traders):
Scale In/Out - Don't go all-in at once! Build position on confirmations
Trail Your Stop - Lock in profits as price moves toward 56K
Watch Volume - Decreasing volume near resistance = trap warning 🪤
Time Your Exits - Asia session often sees momentum; consider US session volatility
Correlation Check - If USD/JPY spikes, reassess your JP225 long! 🔍
🚀 FINAL WORD:
This is a technically sound bullish setup with fundamental support from BOJ policy and export dynamics. BUT - trading is probability, not certainty! The 56K resistance is REAL, and correlation risks from FX pairs are REAL.
Manage risk. Respect the market. Take profits when they're there. 💰
📢 If you found this analysis helpful, smash that 👍 LIKE button and 💬 COMMENT your thoughts below! Let's build this trading community together! 🤝
Follow for more setups, and remember: The market doesn't care about your feelings - only your discipline! 🎯
#JP225 #Nikkei225 #JapanIndex #TradingIdeas #DayTrading #SwingTrading #TechnicalAnalysis #ForexCorrelation #USDJPY #BankOfJapan #IndexTrading #ThiefOGs #TradeSmart 🇯🇵📈💹

JP225 Pullback Complete? Next Stop 50K Resistance?🎌 JAPAN225 (JP225): Bullish Retest Play at 786 LSMA - Thief's Layered Entry Strategy 🎯
📊 Market Overview
The Nikkei 225 (JP225) is showing bullish confirmation with a pullback retest at the 786 Least Squares Moving Average (LSMA)—a classic swing/day trade setup for those who love precision entries with a side of controlled chaos. 🎰
This isn't your grandma's single-entry trade. We're going full Thief Mode with layered limit orders to maximize positioning while the market does its thing. Think of it as "dollar-cost averaging" but cooler and with more risk. 😎
🎯 Trade Setup
📈 Bias: BULLISH
🔍 Confirmation: Retest & bounce at 786 LSMA support zone
⚡ Strategy: Thief's Layered Entry Method (Multiple Limit Orders)
Entry Strategy: The Thief's Ladder
Instead of going all-in at one price (boring! 😴), we're layering buy limit orders like a pro:
Layer 1: 46,500
Layer 2: 46,800
Layer 3: 47,000
Layer 4: 47,500
💡 Pro Tip: You can add more layers based on your risk appetite and account size. The deeper the pullback, the more contracts you accumulate. This is how the Thief OG's do it. 🦝💼
🛑 Stop Loss
Thief's SL: 46,000
⚠️ Important Note: Dear Ladies & Gentlemen (Thief OG's), I'm NOT recommending you blindly follow my stop loss. This is your money, your rules. Set your SL based on your own risk tolerance. If you make money, take money—at your own risk. 💰🎲
🎯 Take Profit Target
Target Zone: 50,500
Why? This level coincides with:
Strong resistance 🧱
Overbought conditions 🔥
Potential bull trap zone 🪤
💡 Exit Strategy: When we hit overbought + resistance, it's time to escape with profits like a true thief in the night. 🌙💨
⚠️ Another Note: Dear Ladies & Gentlemen (Thief OG's), I'm NOT saying you MUST take profit here. Scale out, trail your stop, or hold for glory—your choice, your consequences. 🚀
📈 Key Technical Points
✅ 786 LSMA Support: Acting as dynamic support—this is our retest zone
✅ Bullish Structure Intact: Higher lows forming on multiple timeframes
✅ Risk-to-Reward: Solid 1:3+ R:R depending on your layer average
✅ Momentum Confirmation: Watch for bullish divergence on RSI/MACD if you're into that stuff 📊
🌍 Related Pairs to Watch
Keep an eye on these correlated assets for confirmation:
$USD/JPY (DXY correlation): Inverse relationship—weak USD = stronger Yen = potential JP225 boost 💴
SP:SPX (S&P 500): Risk-on sentiment in US markets often lifts JP225 🇺🇸📈
HSI:HSI (Hang Seng Index): Asian market correlation—regional sentiment matters 🇭🇰
TSE:TOPIX (Tokyo Stock Price Index): Direct correlation with broader Japanese equities 🎌
💡 Correlation Play: If US indices are pumping and USD is weakening, JP225 tends to follow the party. 🎉
⚙️ Risk Management Reminder
This is a layered entry strategy—meaning your average entry price will depend on how many layers get filled. The beauty? You're not FOMOing at one level. The downside? You need proper position sizing across layers to avoid overexposure. 🧮
Golden Rule: Never risk more than 1-2% of your account on a single trade idea. Thief's honor. 🤝
✨ If you find value in my analysis, a 👍 and 🚀 boost is much appreciated — it helps me share more setups with the community!
#JP225 #Nikkei225 #JapanIndex #ThiefStrategy #LayeredEntry #SwingTrading #DayTrading #LSMA #TechnicalAnalysis #ForexCorrelation #RiskManagement #BullishSetup #TradingView #PriceAction #SupportAndResistance #TradeSmart

Exports Soft, Tech Shaky: Nikkei-Japan225 Pullback MapPrice has run hard into a fresh high with almost no meaningful pullback. With the dollar at a crossroads and macro tone turning more mixed for Japan/tech, I’m positioning for a corrective leg into 41,500 → 40,000. From that area I’ll reassess.
Technicals
• Parabolic extension into supply: Pushed through the 2024 range/premium zone and is now trading inside an overhead supply band (upper 46k–49k). Extended structure = ripe for mean reversion.
• Breakout retest levels below: Clean magnet zones at 41,500 (prior breakout / premium box mid) and 40,000 (round-number + structure).
• Risk line: Idea invalidated on a daily close above ~49,000 (acceptance above supply). I’ll scale adds on lower highs; reduce if momentum reclaims the highs with range expansion.
Fundamentals
• Export softness: Japan exports contracted for a 4th month (-0.1% YoY). Shipments to the US fell ~-13.8% YoY, while Asia rebounded only modestly—pointing to cooling external demand.
• BoJ steady & cautious: Policy rate held at 0.5% with inflation easing to ~2.7%. The BoJ prioritizes stability and optionality—less fuel for chasing equities at highs.
• Tech headwinds risk: Reports of China restricting an Nvidia chip add to regional tech sentiment risk.
• Global mix: The Fed’s pivot to easing supports liquidity, but US indices at records after the cut + tariff/trade headlines leave room for risk-off swings—often pressuring JP equities, especially if JPY firms.
Trade Plan (summary)
• Bias: Short swing (daily)
• Targets: 41,500 first, then 40,000
• Invalidation: Daily close >49,000
• Notes: Watching USD/JPY, BoJ commentary, US data, and trade/tariff headlines for momentum shifts.
Note: Please remember to adjust this trade idea according to your individual trading conditions, including position size, broker-specific price variations, and any relevant external factors. Every trader’s situation is unique, so it’s crucial to tailor your approach to your own risk tolerance and market environment.

Japanese Yen Index Approaches Resistance – What’s Next for JXY?💴 JXY (Japanese Yen Index) – Thief Trader’s Market Money Looting Plan 🕵️♂️💰
📌 Plan Overview
Bias: Bullish Breakout confirmed with Hull Moving Average crossover.
Style: Swing / Day Trade ⚡
Entry Approach: Using layered limit orders (the “Thief Strategy”) at:
🪙 67.60 | 🪙 67.80 | 🪙 67.90 | 🪙 68.00
(💡 You can increase limit layers based on your own risk & style).
🎯 Target & Escape Plan
Target Zone (TP): 68.50 ⚡ (Hull MA resistance + Overbought Zone + Trap Alert)
The idea: Steal profits & escape before the trap closes ⛓️💨.
Note: Targets are flexible. Dear Ladies & Gentlemen (Thief OG’s), adjust TP as per your strategy & risk.
🛡️ Risk Management – Thief Style
Stop Loss (SL): 67.20 🛑 (after breakout confirmation).
⚠️ Reminder: SL is not fixed. Thief OG’s, adjust SL to match your startergy & personal risk.
The golden thief rule: Protect your loot before escaping! 🕶️💼
🔑 Key Points to Watch
Hull MA Breakout = Momentum trigger 📈.
JPY Strength/Weakness can be spotted through related pairs:
FX:USDJPY 💵💴 → Direct correlation with JXY (inverse to USD strength).
OANDA:EURJPY 💶💴 → Tracks EUR flows vs JPY.
OANDA:GBPJPY 💷💴 → Higher volatility = bigger loot opportunities 🏴☠️.
OANDA:AUDJPY & OANDA:NZDJPY 🌏💴 → Strong risk sentiment indicators.
NASDAQ:JPY futures (6J1!) 🕵️♂️ → Direct hedge tool.
🧩 Correlation Insight
When JXY pumps 🚀, typically FX:USDJPY drops 📉.
Crosses like EURJPY / GBPJPY can become volatile = side opportunities for scalpers.
Watch global risk sentiment (equities/indices) – JPY often behaves as a safe-haven thief 🏦.
✨ “If you find value in my analysis, a 👍 and 🚀 boost is much appreciated — it helps me share more setups with the community!”
#JXY #JPY #USDJPY #EURJPY #GBPJPY #AUDJPY #NZDJPY #Forex #SwingTrade #DayTrading #HullMA #Breakout #TradingStrategy #MarketAnalysis #TradingView

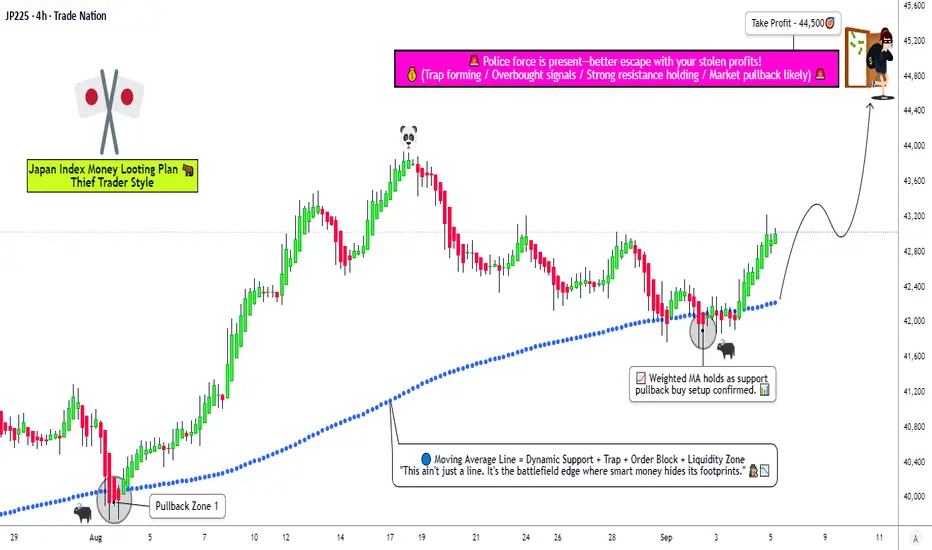
JP225 – Multi-Layer Entry, Smart SL & Steal Profits!🚀🇯🇵 JP225 (JAPAN 225) CFD - THIEF STRATEGY BULLISH PLAN 🇯🇵🚀
🎯 Core Trading Idea
The "Thief Strategy" uses layered limit orders to stealthily accumulate positions during bullish momentum, targeting a swift escape before key resistance levels. This approach maximizes entry efficiency while minimizing market impact – perfect for the current JP225 setup!
📊 THIEF STRATEGY EXECUTION PLAN
⚡ Entry Protocol (Layered Limit Orders)
🔰 Layer 1: 42,200
🔰 Layer 2: 42,400
🔰 Layer 3: 42,600
🔰 Layer 4: 42,800
💡 Pro Tip: Add more layers based on your risk tolerance and capital allocation
🛑 Stop Loss Configuration
Thief OG SL: 41,800 (Strategic support breach level)
⚠️ Disclaimer: Adjust SL based on your personal risk management rules. This is NOT financial advice.
🎯 Profit-Taking Target
Primary Escape Zone: 44,500 (Take profits before police barricade resistance at 45,000)
Remember: Escape with your stolen money wisely! Partial profits at 43,800 and 44,200 recommended
📈 WHY THIS PLAN? MARKET CONTEXT & ANALYSIS
🎯 Real-Time Index Snapshot (Sep 05, 2025)
Current Price: 43,002.00 (+423.82 / +1.00% 📈)
Monthly Gain: +5.48% (Strong momentum ✅)
Yearly Gain: +18.24% (Bullish trend intact ✅)
All-Time High: 43,876.42 (August 2025 🏆)
😰😊 Market Sentiment: Fear & Greed Index
Current Reading: Greed (Score ~70/100) 😊
Momentum: Strong (Above 125-day MA) 📈
Volatility: Low to Moderate 😌
Safe Haven Demand: Low 🚫
Options Activity: Neutral 📊
✅ Fundamental Drivers (BULLISH CATALYSTS)
🏎️ Trade Policy Win: U.S. auto tariffs reduced to 15% (from 27.5%) - massive boost for Japanese exporters
💰 Wage Growth Breakthrough: Real wages turned positive (+0.5%) for first time since December 2024
💵 Investment Surge: $550B Japanese investments in U.S. projects announced
🌍 Global Liquidity Support: Fed rate cut expectations supporting risk assets
🏢 Corporate Strength: Toyota (+1.98%), Honda (+1.14%), and Mitsubishi UFJ (+0.93%) leading gains
⚠️ Key Risks (BE AWARE)
💴 Yen Appreciation Risk: Potential JPY strength if U.S. accelerates rate cuts
🎯 Inflation Pressure: Consumer inflation at 3.6% (above BoJ's 2% target)
📉 Mixed Economic Signals: Coincident index dropped to 113.3 (from 116.7)
📊 Technical Assessment
🎯 Trend Structure: Bullish above 41,500 support
📊 Momentum: Strong upward trajectory with occasional consolidation
🧱 Resistance Levels: 43,900 (Recent high), 45,000 (Psychological barrier)
🛡️ Support Levels: 41,800 (Strategy SL), 41,200 (Strong weekly support)
🌐 RELATED PAIRS TO WATCH
FX:USDJPY - Critical for exporter competitiveness
INDEX:NKY - Nikkei 225 futures correlation
SP:SPX - Global risk sentiment gauge
OANDA:EURJPY - Yen strength indicator
📊 BULLISH/BEARISH SCORECARD
Technical: 80% Bullish ✅ | 20% Bearish
Fundamental: 75% Bullish ✅ | 25% Bearish
Sentiment: 70% Bullish ✅ | 30% Bearish
Risk/Reward: 80% Favorable ✅ | 20% Unfavorable
OVERALL: 76% BULLISH ✅ | 24% BEARISH
👑 TRADER PERSPECTIVES
🎯 Retail Traders: Optimistic but cautious near ATHs. Watch for breakout above 43,900
🏦 Institutional Flow: Accumulating on dips, focusing on exporters and tech names
🇯🇵 Domestic Investors: Positive on wage growth and trade developments
✨ "If you find value in my analysis, a 👍 and 🚀 boost is much appreciated — it helps me share more setups with the community!"
⚠️ RISK DISCLAIMER
This idea is for educational purposes only. I am not a financial advisor. The "Thief Strategy" is a personal approach and may not suit all traders. Always conduct your own analysis and manage risk appropriately. Past performance doesn't guarantee future results. Trading CFDs carries substantial risk of loss.
#JP225 #Japan225 #NIKKEI #TradingSetup #SwingTrading #DayTrading #TradingStrategy #CFD #MarketAnalysis #TechnicalAnalysis #TradingView #ThiefStrategy #Bullish #Investing #Stocks #Finance
NIKKEI 5-month pattern points to a rise to 47300Nikkei (NI225) has been trading within a 5-month Channel Up and is on its latest Bearish Leg since the September 19 High.
As you can see, the index has had another 4 such pull-backs within this pattern, all of which touched the Buy Zone and the 1D RSI Support Zone before initiating the new Bullish Leg.
All Bullish Legs have peaked on their 1.786 Fibonacci extensions. As a result, our Target on the medium-term is 47300.
-------------------------------------------------------------------------------
** Please LIKE 👍, FOLLOW ✅, SHARE 🙌 and COMMENT ✍ if you enjoy this idea! Also share your ideas and charts in the comments section below! This is best way to keep it relevant, support us, keep the content here free and allow the idea to reach as many people as possible. **
-------------------------------------------------------------------------------
💸💸💸💸💸💸
👇 👇 👇 👇 👇 👇

TARGET REACHED on Japan 225 after a wave of emotionsTarget 42,153 REACHED since 11 June 2025.
It actually was a classic text book analysis with a W Formation followed by a Falling Wedge.
I've always believed in keeping in simple. ANd when you find something simple ONLY improve tweak and adjust that strategy to make life easier, more understandable and profitable.
Hence been using the same strategy since 2003.
So now that the target has reached 42,153 - we can actually expect further upside followed by a consolidation pattern which will prepare for the next move.
Will it be up or down? We'll have to find out.
Disclosure: I am part of Trade Nation's Influencer program and receive a monthly fee for using their TradingView charts in my analysis.

JP225 Resistance Break – Will You Catch the Momentum?🦹♂️💹 JP225 / NIKKEI “Ninja Vault Raid” – Resistance Wall Breakout 42,500 🚀💰
🎩 Greetings, Vault Crackers & Chart Raiders!
The Nikkei vault is about to blow wide open, and we’re going in Thief Trader style — silent entry, loud profit. This isn’t just a trade… it’s a full-on market heist.
🎯 Master Plan:
Asset: JP225 / Nikkei Index CFD
Direction: Bullish – RESISTANCE WALL BREAKOUT PLAN 42,500
Entry: Only after candle close above the wall – stack multiple limit orders like laying C4 charges.
Stop Loss: 41,700 – the escape hatch if the alarms go off.
Target: 43,600 – where the loot is stashed. Beware: the “Market Police” are waiting here, so exit clean.
🧠 Heist Blueprint:
1️⃣ Wait for the breach – No early moves, patience is profit.
2️⃣ Layered entry strategy – Spread buys across retrace points to stay undetected.
3️⃣ Trail the stash – Use trailing SL to protect gains as we climb.
📊 Why this works:
Strong bullish pressure building like a vault about to pop.
Breakout setup confirmed by momentum & structure.
Global sentiment & macro flows acting as our inside man.
⚠️ Thief Trader Risk Rule:
Avoid chasing during high-impact news – that’s when SWAT moves in.
Stick to the plan. No greed. No hesitation.
💥 If this Nikkei Heist plan helps you snatch pips, drop a boost & join the Thief Crew.
We rob the market… not each other. 🏆💸
📌 Disclaimer: This is the blueprint for our raid – not financial advice. Execute with your own tools & timing.

Nikkei 225 Index Sets All-Time RecordNikkei 225 Index Sets All-Time Record
As the chart shows, the Nikkei 225 stock index (Japan 225 on FXOpen) rose today to the 43,000-point level, thereby:
→ surpassing its 2024 peak;
→ setting a new all-time high.
Bullish sentiment has been driven by strong quarterly earnings reports from Japanese companies and expectations regarding the Bank of Japan’s monetary policy. Optimism was further reinforced by news of extended trade negotiations between the United States and China. According to Reuters, the decision to prolong the tariff truce between the world’s two largest economies by a further 90 days has improved the outlook for global trade.
Technical Analysis of the Nikkei 225 Chart
Earlier this month, we:
→ identified an ascending channel formed by price fluctuations in 2025;
→ suggested that bullish momentum would likely be sufficient to attempt a breakout above the 42k level;
→ noted that optimism might wane if the price approached the channel’s upper boundary.
Since then:
→ the channel has remained valid, as has the intermediate trendline (marked in orange) of the uptrend;
→ following a brief consolidation, the price broke above the 42,500 level on a long bullish candle.
However, the subsequent bearish candles appear to signal the start of a short-term correction, which is reasonable given the RSI indicator’s overbought reading. In this scenario, the correction could extend, for example, to the 42,000 level – a psychological mark where the 2025 high had previously been located.
In the longer term, a bearish scenario cannot be ruled out. Note the candle marked with an arrow: although it appears strongly bullish at first glance, the sharp surge could be linked to a buying climax and the beginning of a distribution phase (as per Richard Wyckoff’s theory).
Given that the index is at record highs, major market participants may use the positive news flow to lock in profits and sell assets at elevated prices. Confidence in this hypothesis would be reinforced if today’s sharp rise is soon reversed, signalling the bulls’ failure to maintain control at these record levels.
This article represents the opinion of the Companies operating under the FXOpen brand only. It is not to be construed as an offer, solicitation, or recommendation with respect to products and services provided by the Companies operating under the FXOpen brand, nor is it to be considered financial advice.

Nikkei 225 Index Rises Towards the 42,000 LevelNikkei 225 Index Rises Towards the 42,000 Level
As the chart indicates, the Nikkei 225 stock index has today risen to the 42,000 mark, which is just below its all-time high.
Among the bullish drivers:
→ Corporate news. Strong quarterly results were reported by Sony Group and SoftBank.
→ Trade agreement developments. Positive news flow surrounds a potential tariff agreement between the United States and Japan, which could be finalised in the near term. According to Reuters, the Japanese government stated on Thursday that the US has pledged to adjust overlapping tariffs on Japanese goods to avoid double taxation.
Technical Analysis of the Nikkei 225 Chart
Previously, we highlighted the ascending channel that has shaped price action throughout 2025. This pattern remains valid, with the price now entering the upper half of the channel. The channel’s median line might act as a support level going forward.
The recent price behaviour attracts attention: a long bullish candle has formed on the chart – immediately following a breakout above the 41,280 resistance level (as indicated by the arrow). This signals a clear imbalance in favour of buyers.
From a bearish perspective:
→ The psychological resistance at 42,000 may hold – in late July, the price failed to stay above this level.
→ The RSI indicator has entered overbought territory.
→ Failure by the bulls to sustain a break above 42,000 could validate a potential Double Top bearish pattern.
From a bullish perspective:
→ The price might advance towards the upper boundary of the ascending channel.
→ The bullish candle displays characteristics of an FVG (Fair Value Gap) bullish pattern, which might serve as a future support level.
→ Further support could be provided by the orange trendline, as well as the former resistance at 41,280.
A bullish breakout attempt above 42,000 cannot be ruled out. However, will market optimism persist if the price approaches the upper limit of the channel?
This article represents the opinion of the Companies operating under the FXOpen brand only. It is not to be construed as an offer, solicitation, or recommendation with respect to products and services provided by the Companies operating under the FXOpen brand, nor is it to be considered financial advice.
JP225 Long Trap or Bull Escape? Heist in Motion.🦹♂️🎯 JP225 Ninja Heist: Breakout Loot Plan 💥💰 (Long Game Playbook)
🌟Hi! Hola! Ola! Bonjour! Hallo! Assallamu Allaikum!🌟
Dear Money Makers, Market Raiders & Silent Robbers, 🤑💰💸✈️
It’s time to gear up for the ultimate breakout heist on the JP225 / NIKKEI Index CFD Market. Based on my 🔥Thief Trading style🔥—a mix of slick technical strategy and deep fundamental recon—this operation is primed for a bullish break-in.
🧠 Plan of Attack:
Our team is targeting a long-side entry only, aiming to loot the market before it hits the Electric Trap Resistance Zone ⚡—a known danger zone where big bears lie in wait. Let’s outsmart them!
🚪 Entry Plan – The Door to Gold
📈 "The heist is on once we crack that resistance vault!"
📍Trigger: Wait for candle close above 40,100 – that's your breakout cue.
🧲Pullback Setup: Place Buy Limit near recent swing low on the 15/30 min timeframe, or stack multiple DCA-style orders to scale in silently.
🔔 Don’t forget to set alerts—you snooze, you lose.
🛡️ Stop Loss – Don’t Get Caught
🛑 "Keep your escape plan ready, always!"
📍Preferred SL: Recent swing low on 4H timeframe @ 39,500
🎯 Adjust based on your risk level and lot sizing.
🧠 Smart robbers move stop loss only after breakout confirmation—don’t let hesitation cost you your cut.
🎯 Profit Target – Secure the Bag
🏴☠️ Escape Plan: Aim for 41,200 or bail early if the scene gets messy.
Use trailing SLs to protect your stash.
Scalpers, only play long side. Let the swing traders set the traps while you slice the pie.
📊 Why This Trade Works:
JP225 is currently fueled by:
🔼 Strong bullish momentum
🔍 Technical breakout setup
💹 Fundamental backdrop: macro trends, institutional flow, COT report, and global sentiment lining up like guards on break
🗞️ Want more intel? Check out the broaderr macroeconomic, sentiment, and positioning insights 🔗🔗🔗
⚠️ Risk Management Alert:
📰 During news hours, don’t act greedy.
❌ Avoid entries near big news drops.
✅ Use trailing SLs to protect profits from volatility whiplash.
❤️ Robbery Crew Boost Request
💥Hit that Boost if this plan helps you grab the market loot!
Let’s grow our Thief Trading Army together—every trader deserves a smooth escape and a fat wallet 🏆💪💸
📌 Disclaimer: This is not financial advice. Just a masterplan from a fellow market raider. Adapt your risk and strategy based on your own style. Markets can flip faster than you can say “bank run”—stay updated, stay sharp, and stay stealthy. 🕶️
🎭 See you at the next heist.

Nikkei 225 Index Surges Above 41,000 PointsNikkei 225 Index Surges Above 41,000 Points
As the chart indicates, the value of the Nikkei 225 stock index has risen above the 41,000-point level — its highest mark since July 2024.
The primary bullish driver is the conclusion of a trade agreement between the United States and Japan. According to media reports, the deal will involve Japan paying a 15% duty on exports to the US, down from the previous 25% tariff. Shares of automotive companies are among the top gainers on the Japanese stock market.
European stock indices have also risen, as EU officials are scheduled to visit Washington on Wednesday, raising hopes for a potential US-EU trade agreement.
Technical Analysis of the Nikkei 225 Chart
Approximately a month ago, we outlined an ascending channel based on the price fluctuations observed in 2025. This formation remains relevant, and:
→ The price has moved into the upper half of the channel, suggesting that the median line may act as a support level going forward.
→ The nature of the latest price action is worth noting: as an immediate reaction to the news of the deal, two long bullish candles formed on the chart. However, once the price reached its 2025 high, upward momentum slowed sharply.
→ The RSI indicator signals overbought conditions.
Thus, it is reasonable to assume that, following an approximate 3.6% surge over an eight-hour period, the bullish momentum may have largely been exhausted. Nikkei 225 (Japan 225 on FXOpen) could now be vulnerable to a pullback, potentially towards the median line. Nonetheless, the ultimate direction will be shaped primarily by fundamental news.
This article represents the opinion of the Companies operating under the FXOpen brand only. It is not to be construed as an offer, solicitation, or recommendation with respect to products and services provided by the Companies operating under the FXOpen brand, nor is it to be considered financial advice.
Nikkei 225 Index Rises Above 40,000 PointsNikkei 225 Index Rises Above 40,000 Points
As the chart shows, the Nikkei 225 stock index (Japan 225 on FXOpen) has risen above the psychological level of 40,000 points — for the first time in five months.
Bullish drivers include:
→ Reduced geopolitical risks. A ceasefire between Iran and Israel has boosted market sentiment, with stock indices rising both on Wall Street (yesterday the Nasdaq 100 hit a new all-time high) and in Japan.
→ Easing fears of a prolonged trade war. White House Press Secretary Karoline Leavitt noted that the timeline for implementing tariffs is flexible and could be extended.
→ Economic news. Recent data shows that inflation in Japan has slowed for the first time in four months: the core consumer price index fell to 3.1% from 3.6% in May.
Technical Analysis of the Nikkei 225 Chart
Price movements are forming an upward channel (highlighted in blue), but the market appears vulnerable to a pullback, as suggested by:
→ proximity to the upper boundary of the channel;
→ overbought conditions indicated by the RSI.
If a pullback develops, it will provide yet another example of how the price failed to hold above the psychological level of 40,000 — something we've seen repeatedly since October 2024, and we've been pointing out this pattern for quite some time.
Therefore, we might witness another false breakout above the 40K level on the Nikkei 225 (Japan 225 on FXOpen), followed by a retreat deeper into the blue channel — potentially towards its median line.
This article represents the opinion of the Companies operating under the FXOpen brand only. It is not to be construed as an offer, solicitation, or recommendation with respect to products and services provided by the Companies operating under the FXOpen brand, nor is it to be considered financial advice.

Nikkei to continue in the upward move?NIK225 - 24h expiry
Short term RSI has turned positive. Further upside is expected.
Risk/Reward would be poor to call a buy from current levels.
A move through 38750 will confirm the bullish momentum.
The measured move target is 39500.
We look to Buy at 38500 (stop at 38200)
Our profit targets will be 39250 and 39500
Resistance: 39000 / 39250 / 39500
Support: 38500 / 38250 / 38000
Risk Disclaimer
The trade ideas beyond this page are for informational purposes only and do not constitute investment advice or a solicitation to trade. This information is provided by Signal Centre, a third-party unaffiliated with OANDA, and is intended for general circulation only. OANDA does not guarantee the accuracy of this information and assumes no responsibilities for the information provided by the third party. The information does not take into account the specific investment objectives, financial situation, or particular needs of any particular person. You should take into account your specific investment objectives, financial situation, and particular needs before making a commitment to trade, including seeking advice from an independent financial adviser regarding the suitability of the investment, under a separate engagement, as you deem fit.
You accept that you assume all risks in independently viewing the contents and selecting a chosen strategy.
Where the research is distributed in Singapore to a person who is not an Accredited Investor, Expert Investor or an Institutional Investor, Oanda Asia Pacific Pte Ltd (“OAP“) accepts legal responsibility for the contents of the report to such persons only to the extent required by law. Singapore customers should contact OAP at 6579 8289 for matters arising from, or in connection with, the information/research distributed.

Nikkei 225 stays bullish as Japan embraces AIWhile most traders have been focused on AI's impact on Western economies, Japan has been quietly chipping away at its own AI revolution. Not by building the flashiest tools, but by embedding AI into the guts of its economy.
Let's start with the obvious. Japan is an industrial giant. Toyota, Fanuc, Sony. These companies aren’t chasing fads. They’re integrating AI into factories, supply chains, and robotics. Not hype but rather real productivity.
The government gets it too. “Society 5.0” isn’t just a slogan. It’s a structural policy push. R&D spending is north of 3% of GDP. That’s capital well spent.
Now the deeper point, demographics. Japan’s working-age population is shrinking. That’s no longer a headwind. It’s fuel. AI offsets labour shortages. Healthcare, logistics, transport. These sectors are being rewired, not disrupted. They’re evolving, and profits will follow.
Then there’s valuation. The Nikkei 225 is still attractive with a forward P/E of around 14x, while the S&P trades above 22x. Yet Japanese firms are global leaders in high-value, AI-relevant sectors. That gap will close.
This is structural, it’s not about today’s trade. It’s about where capital flows over the next five years.
Japan’s quiet, calculated AI pivot is the most underpriced transformation in global markets.
Stay long Nikkei, we expect the 200-day moving average to hold. The re-rating is only beginning.
The forecasts provided herein are intended for informational purposes only and should not be construed as guarantees of future performance. This is an example only to enhance a consumer's understanding of the strategy being described above and is not to be taken as Blueberry Markets providing personal advice.

"JP225 / NIKKEI" Index CFD Market Heist Plan (Swing/Day Trade)🌟Hi! Hola! Ola! Bonjour! Hallo! Marhaba!🌟
Dear Money Makers & Robbers, 🤑 💰💸✈️
Based on 🔥Thief Trading style technical and fundamental analysis🔥, here is our master plan to heist the "JP225 / NIKKEI" Index CFD Market. Please adhere to the strategy I've outlined in the chart, which emphasizes long entry. Our aim is to escape near the high-risk ATR Zone. Risky level, overbought market, consolidation, trend reversal, trap at the level where traders and bearish robbers are stronger. 🏆💸"Take profit and treat yourself, traders. You deserve it!💪🏆🎉
Entry 📈 : "The heist is on! Wait for the MA breakout (37300) then make your move - Bullish profits await!"
however I advise to Place Buy stop orders above the Moving average (or) Place buy limit orders within a 15 or 30 minute timeframe most recent or swing, low or high level for Pullback entries.
📌I strongly advise you to set an "alert (Alarm)" on your chart so you can see when the breakout entry occurs.
Stop Loss 🛑: "🔊 Yo, listen up! 🗣️ If you're lookin' to get in on a buy stop order, don't even think about settin' that stop loss till after the breakout 🚀. You feel me? Now, if you're smart, you'll place that stop loss where I told you to 📍, but if you're a rebel, you can put it wherever you like 🤪 - just don't say I didn't warn you ⚠️. You're playin' with fire 🔥, and it's your risk, not mine 👊."
📍 Thief SL placed at the recent/swing low level Using the 4H timeframe (35600) Day trade basis.
📍 SL is based on your risk of the trade, lot size and how many multiple orders you have to take.
🏴☠️Target 🎯: 39300 (or) Escape Before the Target
🧲Scalpers, take note 👀 : only scalp on the Long side. If you have a lot of money, you can go straight away; if not, you can join swing traders and carry out the robbery plan. Use trailing SL to safeguard your money 💰.
💰💵💴💸"JP225 / NIKKEI" Index CFD Market Heist Plan (Day / Swing Trade) is currently experiencing a bullishness🐂.., driven by several key factors.👆👆👆
📰🗞️Get & Read the Fundamental, Macro economics, COT Report, Geopolitical and News Analysis, Sentimental Outlook, Intermarket Analysis, Index-Specific Analysis,Positioning and future trend targets with Overall Score...... go ahead to check👉👉👉🔗🔗🌎🌏🗺
⚠️Trading Alert : News Releases and Position Management 📰 🗞️ 🚫🚏
As a reminder, news releases can have a significant impact on market prices and volatility. To minimize potential losses and protect your running positions,
we recommend the following:
Avoid taking new trades during news releases
Use trailing stop-loss orders to protect your running positions and lock in profits
💖Supporting our robbery plan 💥Hit the Boost Button💥 will enable us to effortlessly make and steal money 💰💵. Boost the strength of our robbery team. Every day in this market make money with ease by using the Thief Trading Style.🏆💪🤝❤️🎉🚀
I'll see you soon with another heist plan, so stay tuned 🤑🐱👤🤗🤩

BOJ vs Fed: Fueling a Japan 225 Recovery?After an aggressive selloff that pushed Japan 225 (Nikkei) into oversold territory, the index printed a solid bullish reaction off the 30,500 key zone. This area aligns with prior demand and offers a clean invalidation level for long positioning. With heavy bearish sentiment already priced in, I’m positioning long with TP near the premium zone around 40,000.
The fundamental picture may be stormy, but technically, this is a textbook reversal play, I’m ready to ride it.
Technicals:
• Price reacted from major support around 30,500–30,800 zone, a level that held in the past.
• Daily imbalance filled, creating the perfect spot for a potential rebound.
• Descending channel break on lower timeframes indicates early bullish structure shift.
• Target zone: 39,000–40,000.
• SL: Below recent swing low, respecting tight risk management.
Fundamentals:
• Global Risk-Off Sentiment: Recession fears and tariffs pushed risk assets lower — Nikkei included.
• Tariff-Driven USD Weakness: US tariffs created uncertainty and drove global equity selloffs. However, hopes for a US-Japan trade deal are increasing, favoring the JPY and supporting Japanese equities.
• BOJ-Fed Divergence: BoJ is expected to raise rates due to broadening inflation, while the Fed is seen cutting rates soon. This differential supports capital inflows into Japan.
• Flight to Safety: Japan’s stable economy and improving policy outlook make it attractive as global volatility increases.
The selloff may have been excessive due to panic over macro headlines. However, price structure tells its own story, and it’s hinting at a bullish reversal. With multiple technical and fundamental confluences lining up, this is a well-balanced long opportunity with clear risk parameters.
Note: Please remember to adjust this trade idea according to your individual trading conditions, including position size, broker-specific price variations, and any relevant external factors. Every trader’s situation is unique, so it’s crucial to tailor your approach to your own risk tolerance and market environment.

Nikkei preparing for its next BIG leg down to 29,330?From the last UPDATE - The Nikkei formed an extensive Rectangle Formation with an M Formation in the interim.
We then had a large correction which has now resulted in a somewhat recovery. However, is the recovery on the way or are we just waiting for the next big down leg on the markets.
Let's look at the fundamentals first
1. 📉 Profit-Taking After Record Highs
Investors are cashing in after Nikkei hit all-time highs in March.
2. 💴 Stronger Yen Pressures Exporters
A rising yen hurts Japanese exporters like Toyota and Sony.
3. 🏦 BOJ Policy Shift Fears
Markets worry the Bank of Japan will tighten policy further after ending negative rates.
4. 🌍 Global Risk-Off Sentiment
Tensions in the Middle East and weak global data make investors nervous.
5. 📊 Overbought Technicals
Charts show the index was overbought — a correction is natural.
M Formation
Price<20 and 200
Target 29,330
Let's see if this one plays out as I don't think we are out of the doldrums yet.
Disclosure: I am part of Trade Nation's Influencer program and receive a monthly fee for using their TradingView charts in my analysis.

Japan225 to find buyers at market price?NIK225 - 24h expiry
Price action looks to be forming a bottom.
A Doji style candle has been posted from the base.
Short term bias is mildly bullish. Preferred trade is to buy on dips.
Weekly pivot is at 37485.
We look to Buy at 37485 (stop at 37131)
Our profit targets will be 38496 and 40675
Resistance: 38275 / 40675 / 42155
Support: 36790 / 35590 / 34390
Risk Disclaimer
The trade ideas beyond this page are for informational purposes only and do not constitute investment advice or a solicitation to trade. This information is provided by Signal Centre, a third-party unaffiliated with OANDA, and is intended for general circulation only. OANDA does not guarantee the accuracy of this information and assumes no responsibilities for the information provided by the third party. The information does not take into account the specific investment objectives, financial situation, or particular needs of any particular person. You should take into account your specific investment objectives, financial situation, and particular needs before making a commitment to trade, including seeking advice from an independent financial adviser regarding the suitability of the investment, under a separate engagement, as you deem fit.
You accept that you assume all risks in independently viewing the contents and selecting a chosen strategy.
Where the research is distributed in Singapore to a person who is not an Accredited Investor, Expert Investor or an Institutional Investor, Oanda Asia Pacific Pte Ltd (“OAP“) accepts legal responsibility for the contents of the report to such persons only to the extent required by law. Singapore customers should contact OAP at 6579 8289 for matters arising from, or in connection with, the information/research distributed.

Nikkei price action forming a top?JP225USD -24h expiry
Price action looks to be forming a top.
The primary trend remains bearish.
Preferred trade is to sell into rallies.
The hourly chart technicals suggests further upside before the downtrend returns.
We therefore, prefer to fade into the rally with a tight stop in anticipation of a move back lower.
We look to Sell at 38270 (stop at 38679)
Our profit targets will be 37247 and 36790
Resistance: 38275 / 40675 / 42155
Support: 36790 / 35590 / 34390
Risk Disclaimer
The trade ideas beyond this page are for informational purposes only and do not constitute investment advice or a solicitation to trade. This information is provided by Signal Centre, a third-party unaffiliated with OANDA, and is intended for general circulation only. OANDA does not guarantee the accuracy of this information and assumes no responsibilities for the information provided by the third party. The information does not take into account the specific investment objectives, financial situation, or particular needs of any particular person. You should take into account your specific investment objectives, financial situation, and particular needs before making a commitment to trade, including seeking advice from an independent financial adviser regarding the suitability of the investment, under a separate engagement, as you deem fit.
You accept that you assume all risks in independently viewing the contents and selecting a chosen strategy.
Where the research is distributed in Singapore to a person who is not an Accredited Investor, Expert Investor or an Institutional Investor, Oanda Asia Pacific Pte Ltd (“OAP“) accepts legal responsibility for the contents of the report to such persons only to the extent required by law. Singapore customers should contact OAP at 6579 8289 for matters arising from, or in connection with, the information/research distributed.

Nikkei to continue in the downward move?JP225USD - 24h expiry
Although the bears are in control, the stalling negative momentum indicates a turnaround is possible.
A higher correction is expected.
The primary trend remains bearish.
We therefore, prefer to fade into the rally with a tight stop in anticipation of a move back lower.
Further downside is expected although we prefer to sell into rallies close to the 37650 level.
We look to Sell at 37650 (stop at 38290)
Our profit targets will be 36000 and 34390
Resistance: 36790 / 38275 / 40675
Support: 35590 / 34390 / 32680
Risk Disclaimer
The trade ideas beyond this page are for informational purposes only and do not constitute investment advice or a solicitation to trade. This information is provided by Signal Centre, a third-party unaffiliated with OANDA, and is intended for general circulation only. OANDA does not guarantee the accuracy of this information and assumes no responsibilities for the information provided by the third party. The information does not take into account the specific investment objectives, financial situation, or particular needs of any particular person. You should take into account your specific investment objectives, financial situation, and particular needs before making a commitment to trade, including seeking advice from an independent financial adviser regarding the suitability of the investment, under a separate engagement, as you deem fit.
You accept that you assume all risks in independently viewing the contents and selecting a chosen strategy.
Where the research is distributed in Singapore to a person who is not an Accredited Investor, Expert Investor or an Institutional Investor, Oanda Asia Pacific Pte Ltd (“OAP“) accepts legal responsibility for the contents of the report to such persons only to the extent required by law. Singapore customers should contact OAP at 6579 8289 for matters arising from, or in connection with, the information/research distributed.
