#JASMY/USDT GOOD TIME TO BUY JASMY I MARK THE TARGETS
#JASMY
The price is moving within a descending channel on the hourly timeframe. It has reached the lower boundary and is heading towards a breakout, with a retest of the upper boundary expected.
The Relative Strength Index (RSI) is showing a downward trend, approaching the lower boundary, and an upward bounce is anticipated.
There is a key support zone in green at 0.00520. The price has bounced from this level several times and is expected to bounce again.
The indicator is showing a trend towards consolidation above the 100-period moving average, which we are approaching, supporting the upward move.
Entry Price: 0.00540
Target 1: 0.00550
Target 2: 0.00577
Target 3: 0.00600
Stop Loss: Below the green support zone.
Remember this simple thing: Money management.
For any questions, please leave a comment.
Thank you.
JASMYUSDT

JASMY 1W: Sweep the Channel Base → Breakout SetupJASMY is still trading inside a clean macro downtrend channel on the weekly. At this point, I’m not trying to predict the exact bottom — I’m waiting for the sequence that usually precedes a real shift in momentum.
My most likely scenario
1. One more dip into the lower channel boundary (demand + dynamic support)
2. Strong defense (long wicks / rejection, weekly close reclaiming the level)
3. Break above the channel as confirmation (ideally followed by a retest)
I’m not interested in being first. I’m interested in being right — letting price prove it’s done bleeding before the breakout.
Key levels I’m watching
• Lower channel / demand: ~0.0050–0.0048
• Invalidation: clean loss below that zone → opens the door to ~0.0035–0.0028
• Confirmation: channel break + reclaim of ~0.008
Targets if the breakout triggers
• 0.008 (first major reclaim / decision level)
• 0.012 (next structural resistance)
• 0.017 (extended target if momentum follows through)
Market read
This looks like a classic “dip → liquidity sweep → defend → break structure” setup.
If the channel base holds, the best R:R usually comes on the channel break, not on the first touch.

#JASMY/USDT GOOD TIME TO BUY JASMY I MARK THE TARGETS#JASMY
The price is moving within a descending channel on the hourly timeframe. It has reached the lower boundary and is heading towards a breakout, with a retest of the upper boundary expected.
The Relative Strength Index (RSI) is showing a downward trend, approaching the lower boundary, and an upward bounce is anticipated.
There is a key support zone in green at 0.00660. The price has bounced from this level several times and is expected to bounce again.
The RSI is showing a trend towards consolidation above the 100-period moving average, which we are approaching, supporting the upward move.
Entry Price: 0.00700
Target 1: 0.00713
Target 2: 0.00738
Target 3: 0.00772
Stop Loss: Below the green support zone.
Remember this simple thing: Money management.
For any questions, please leave a comment.
Thank you.

#JASMY/USDT GOOD TIME TO BUY JASMY I MARK THE TARGETS#JASMY
The price is moving within a descending channel on the hourly timeframe. It has reached the lower boundary and is heading towards a breakout, with a retest of the upper boundary expected.
The Relative Strength Index (RSI) is showing a downward trend, approaching the lower boundary, and an upward bounce is anticipated.
There is a key support zone in green at 0.00837. The price has bounced from this level several times and is expected to bounce again.
The RSI is showing a trend towards consolidation above the 100-period moving average, which we are approaching, supporting the upward move.
Entry Price: 0.00883
Target 1: 0.00911
Target 2: 0.00960
Target 3: 0.01026
Stop Loss: Below the green support zone.
Remember this simple thing: Money management.
For any questions, please leave a comment.
Thank you.

JASMY/USDT – Major Trendline Test: Breakout or Rejection?JASMY/USDT on the 2D timeframe remains in a medium-to-long-term bearish structure, characterized by a clear sequence of lower highs and lower lows since its historical peak. Price is currently attempting a technical rebound after forming a new swing low, but it is still trading below the main descending trendline, which has acted as resistance multiple times.
At this stage, the rebound should be considered corrective unless a confirmed breakout occurs.
---
Pattern Explanation
The chart clearly shows a Descending Trendline / Falling Market Structure:
A well-defined descending trendline connecting major price peaks
Every bullish attempt has been rejected at this trendline
The current price is approaching this trendline again, making it a critical decision zone
This pattern reflects strong seller dominance, but price compression near the trendline often leads to a volatility expansion (either breakout or strong rejection).
---
Key Support & Resistance Levels
Resistance Levels
0.011300 – Nearest minor resistance
0.013730 – Mid-range resistance / distribution zone
0.019400 – 0.023150 – Strong supply zone
0.031600 – Major resistance and key breakout confirmation
Support Levels
0.008970 – Current support
0.007000 – 0.005800 – Lower demand zone
0.004800 – Last major support (structural invalidation level)
---
Bullish Scenario
The bullish scenario becomes valid if:
Price breaks and closes above the descending trendline
Followed by a daily close above 0.011300
Successful retest of the trendline as support
Bullish Targets
1. 0.013730
2. 0.019400
3. 0.023150
4. 0.031600 (optimistic target if strong momentum follows)
Such a breakout would indicate an early trend reversal from bearish to bullish structure.
---
Bearish Scenario
The bearish scenario remains dominant if:
Price fails to break the descending trendline
Clear rejection candles appear (long upper wicks / bearish engulfing)
Price breaks back below 0.008970
Bearish Targets
0.007000
0.005800
0.004800
A rejection at the trendline would confirm that the current move is only a dead cat bounce.
---
Conclusion
JASMY/USDT is currently trading at a key technical area.
As long as price remains below the descending trendline, the overall bias stays bearish.
A confirmed breakout above the trendline could open the door for a medium-term trend reversal.
Patience and confirmation are crucial at this level.
---
#JASMY #JASMYUSDT #CryptoAnalysis #Altcoins #Downtrend #Trendline #Breakout #SupportResistance #PriceAction #TechnicalAnalysis #CryptoMarket

JASMYUSDT Forming Falling WedgeJASMYUSDT is forming a clear falling wedge pattern, a classic bullish reversal signal that often indicates an upcoming breakout. The price has been consolidating within a narrowing range, suggesting that selling pressure is weakening while buyers are beginning to regain control. With consistent volume confirming accumulation at lower levels, the setup hints at a potential bullish breakout soon. The projected move could lead to an impressive gain of around 190% to 200% once the price breaks above the wedge resistance.
This falling wedge pattern is typically seen at the end of downtrends or corrective phases, and it represents a potential shift in market sentiment from bearish to bullish. Traders closely watching JASMYUSDT are noting the strengthening momentum as it nears a breakout zone. The good trading volume adds confidence to this pattern, showing that market participants are positioning early in anticipation of a reversal.
Investors’ growing interest in JASMYUSDT reflects rising confidence in the project’s long-term fundamentals and current technical strength. If the breakout confirms with sustained volume, this could mark the start of a fresh bullish leg. Traders might find this a valuable setup for medium-term gains, especially as the wedge pattern completes and buying momentum accelerates.
✅ Show your support by hitting the like button and
✅ Leaving a comment below! (What is your opinion about this Coin?)
Your feedback and engagement keep me inspired to share more insightful market analysis with you!

#JASMY/USDT GOOD TIME TO BUY JASMY I MARK THE TARGETS#JASMY
The price is moving in a descending channel on the 1-hour timeframe. It has reached the lower boundary and is heading towards breaking above it, with a retest of the upper boundary expected.
We have a downtrend on the RSI indicator, which has reached near the lower boundary, and an upward rebound is expected.
There is a key support zone in green at 0.00705. The price has bounced from this zone multiple times and is expected to bounce again.
We have a trend towards consolidation above the 100-period moving average, as we are moving close to it, which supports the upward movement.
Entry price: 0.00724
First target: 0.00755
Second target: 0.00781
Third target: 0.00813
Don't forget a simple principle: money management.
Place your stop-loss order below the support zone in green.
For any questions, please leave a comment.
Thank you.

#JASMY/USDT GOOD TIME TO BUY JASMY I MARK THE TARGETS#JASMY
The price is moving in a descending channel on the 1-hour timeframe. It has reached the lower boundary and is heading towards a breakout, with a retest of the upper boundary expected.
We are seeing a bearish trend in the Relative Strength Index (RSI), which has reached near the lower boundary, and an upward bounce is expected.
There is a key support zone in green at 0.00580. The price has bounced from this level several times and is expected to bounce again.
We are seeing a trend towards stabilizing above the 100-period moving average, which we are approaching, supporting the upward trend.
Entry Price: 0.00600
First Target: 0.00606
Second Target: 0.00619
Third Target: 0.00630
Remember a simple principle: Money Management.
Place your stop-loss order below the green support zone.
For any questions, please leave a comment.
Thank you.

JASMY/USDT — Approaching Demand Zone: Reversal or Capitulation?JASMY is entering one of its most decisive phases since 2022.
After forming a long series of lower highs, the price is now approaching the historical demand zone that previously triggered one of JASMY’s strongest reversals — the 0.004–0.003 region.
This yellow block isn’t just another support level:
It is the final major defense zone before the chart steps into a deeper, untouched territory not seen since the 2022–2023 accumulation period.
---
📉 Macro Structure: Descending Triangle Pressure Zone
The chart is developing a compressed descending triangle:
Descending trendline (yellow) = continuous selling pressure.
Horizontal demand zone 0.004–0.003 = the historical level that previously launched a major bullish move.
The triangle apex converges into 2026 = the point where markets typically decide direction.
Statistically, descending triangles lean bearish… unless the support base triggers a strong reversal — and price is heading directly into this decision level.
---
📈 Bullish Scenario — “Reversal Engine”
This is the scenario bulls have been waiting for:
1. Price taps 0.004–0.003, forming a long lower wick or strong rejection candle on the weekly timeframe.
2. A short-squeeze follows, as many stop-losses sit just below 0.003.
3. A bullish weekly close confirms the strength of the demand zone.
4. A breakout above the descending trendline signals a macro trend shift.
🎯 Potential upside targets after a confirmed breakout:
0.008–0.012 (major reaction zone)
Followed by 0.020+ if momentum continues
If this plays out, JASMY could replicate its 2023-style impulsive move after a long sideways accumulation period.
---
📉 Bearish Scenario — “Capitulation Wave”
If the 0.004–0.003 support fails, the chart opens the door to a deeper decline:
1. Weekly breakdown below 0.003 → support invalidation.
2. Increased sell volume indicates capitulation.
3. Price seeks the next liquidity zone near 0.0027 (historical low), possibly lower if panic selling accelerates.
This phase is painful — but ironically, it often forms the macro bottom before a new bullish cycle.
---
🧠 Why the 0.004–0.003 Zone Is So Critical
Previously acted as the launchpad for a large rally.
Hosted major accumulation during 2022–2023.
Acts as the market’s decision point — whether JASMY begins a new long-term trend or extends its macro downtrend.
In other words…
This is the level long-term investors are watching very closely.
---
> “The market is about to decide: can the 0.004–0.003 demand zone hold and spark a macro reversal, or will we see a final capitulation before a new cycle emerges?”
This is a critical moment for JASMY on the weekly timeframe.
#JASMY #JASMYUSDT #CryptoAnalysis #WeeklyChart
#DemandZone #TechnicalAnalysis #CryptoTrading
#Altcoins #DescendingTriangle #PriceAction

JASMY Waves 1 and 2 in place. Powerful 3rd wave up nextEverywhere we look at, JASMY has a textbook structure. First of all an ABC correction to bottom, then a beautiful wave 1, next a perfect wave 2. The chart shows a potential wave 3 in the making.
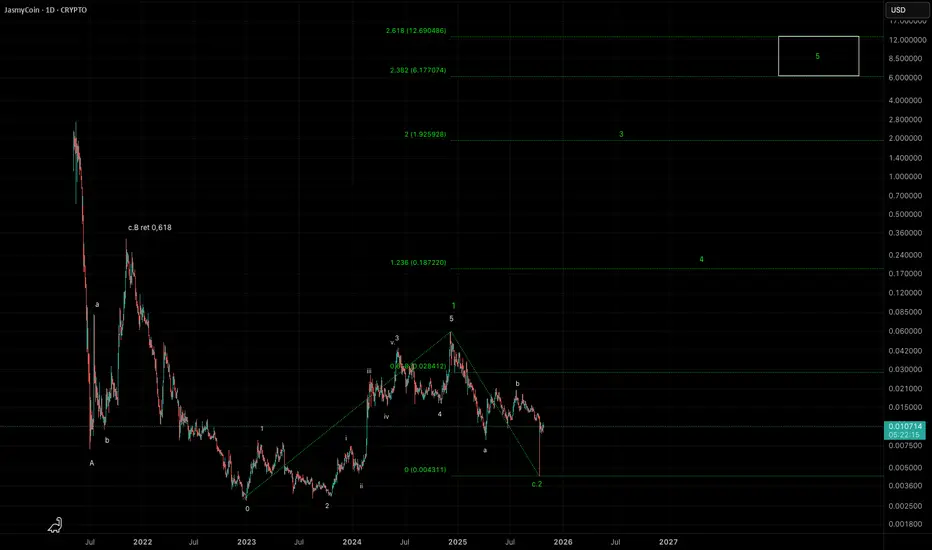
JASMY – new bull run incoming?The crypto market doesn’t actually look too bad after the leverage flush on October 10. JasmyCoin, a cryptocurrency hovering around the 100th spot in market capitalization rankings, may be starting a new upward sequence. The Elliott wave structures are textbook examples. Although not all exchanges saw a deep penetration of the 0.0040–0.0080 zone on October 10, the drop can still be considered a legitimate subwave C of wave 2. Good luck!
Coinbase chart for comparison:

#JASMY/USDT#JASMY
The price is moving within a descending channel on the 1-hour frame, adhering well to it, and is heading towards a strong breakout and retest.
We are experiencing a rebound from the lower boundary of the descending channel. This support is at 0.01480.
We are experiencing a downtrend on the RSI indicator, which is about to break and retest, supporting the upward trend.
We are in a trend of consolidation above the 100 moving average.
Entry price: 0.01530
First target: 0.01593
Second target: 0.01650
Third target: 0.01720

#JASMY/USDT GOOD TIME TO BUY JASMY I MARK THE TARGETS#JASMY
The price is moving within a descending channel on the 1-hour frame and is expected to break and continue upward.
We have a trend to stabilize above the 100 moving average once again.
We have a downtrend on the RSI indicator that supports the upward break.
We have a support area at the lower limit of the channel at 0.01213, acting as strong support from which the price can rebound.
We have a major support area in green that pushed the price upward at 0.01178.
Entry price: 0.01264.
First target: 0.01308.
Second target: 0.01367.
Third target: 0.01441.
To manage risk, don't forget stop loss and capital management.
When you reach the first target, save some profits and then change the stop order to an entry order.
For inquiries, please comment.
Thank you.

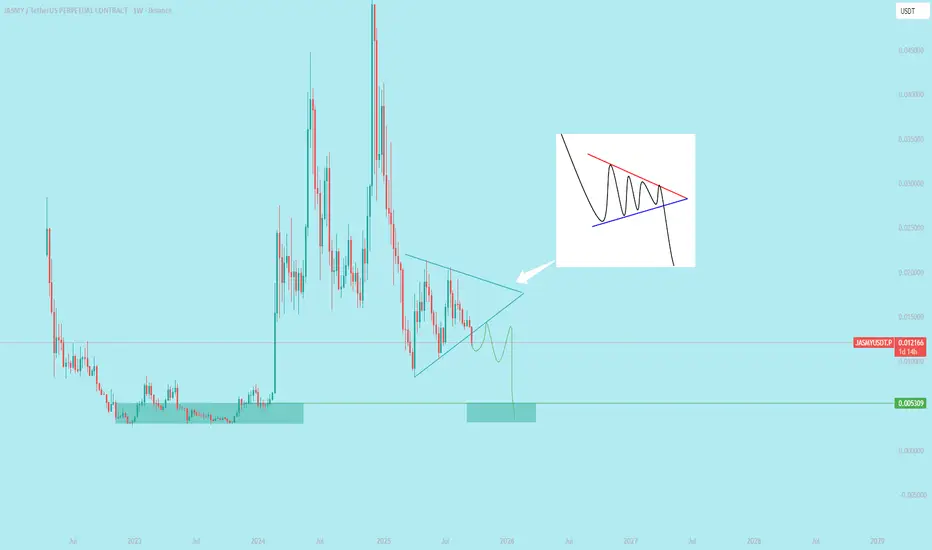
$JASMY Breakdown Bearish Symmetrical Triangle in 1W
`A bearish symmetrical triangle is a continuation pattern in technical analysis that forms during a downtrend. It signals a period of market consolidation where neither buyers nor sellers have a clear advantage, suggesting a potential continuation of the prevailing downward trend once the pattern is completed.` @everyone
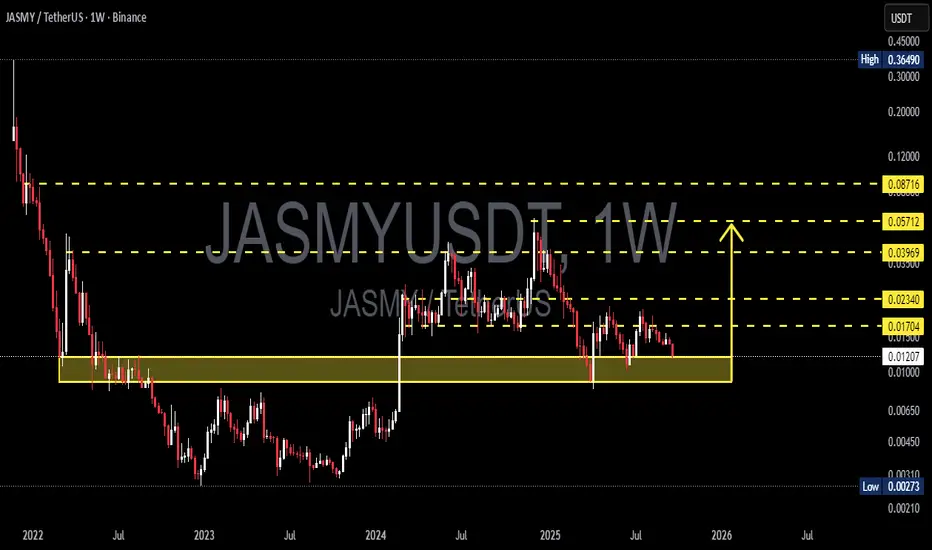
JASMY/USDT — Demand Zone: Bounce or Breakdown to Historical Low?Overview
The weekly chart of JASMY/USDT is currently at a crucial point. Price is sitting right inside the long-term demand zone around 0.010 – 0.013 USDT, which has repeatedly acted as a structural floor since 2022. This zone is the “last line of defense” before a potential move back toward the historical low at 0.0027 USDT.
At the same time, if buyers step in strongly, this area could once again serve as the launchpad for a major rebound, with multiple resistance levels above offering clear upside targets.
---
Structure & Pattern
1. Prolonged downtrend since 2021 → characterized by consistent lower highs and lower lows.
2. Strong demand zone (0.010 – 0.013) → historically a critical accumulation area.
3. Long-term consolidation → suggesting accumulation and positioning by larger players.
4. Repeated tests of demand → validates its importance, but the more it’s tested, the higher the risk of eventual breakdown.
---
Bullish Scenario
Trigger: A strong bullish weekly candle (rejection, pin bar, or engulfing) forming within the demand zone.
Confirmation: A weekly close above 0.01704 USDT → early signal that demand is holding.
Targets:
0.02340 (minor resistance),
0.03969 (mid-term resistance),
0.05712 – 0.08716 (major resistance and mid-term bullish targets).
Potential: A rebound from here could lead to impulsive moves, as has happened in previous tests of this same demand zone.
---
Bearish Scenario
Trigger: Weekly close below 0.010 USDT with strong selling volume.
Confirmation: Retest of the broken zone as resistance followed by rejection.
Target: Possible decline toward 0.0027 USDT (historical low).
Risk: A confirmed breakdown here could accelerate panic selling and extend the downtrend.
---
Sentiment & Market Psychology
This demand zone is closely monitored by traders → a bounce could trigger a strong short squeeze.
A breakdown, however, may spark capitulation among retail participants, while smart money positions itself at deeper discounts.
Since this is on the weekly timeframe, the outcome here could define JASMY’s direction for months ahead.
---
Strategy & Risk Management
Aggressive entry: Buy within 0.010–0.013, stop loss slightly below 0.010.
Conservative entry: Wait for a confirmed weekly close above 0.017.
Profit-taking: Scale out at each resistance target.
Risk control: Manage exposure carefully (1–2% per trade), avoid over-leveraging in such a decisive zone.
---
Conclusion
JASMY is at a make-or-break level.
Holding above 0.010–0.013 may trigger a rebound toward 0.017 → 0.023 → 0.087.
Failing to hold could send the market back to retest the historical low at 0.0027.
This zone will determine whether JASMY enters a new accumulation and recovery phase, or extends its multi-year downtrend. Traders should wait for weekly confirmations before committing to major positions.
---
#JASMY #JASMYUSDT #CryptoTA #AltcoinAnalysis #PriceAction #WeeklyChart #SupportResistance #DemandZone #CryptoTrading
Jasmy in accumulation phase. JASMY is consolidating and creating a potential order block. However, considering bullish momentum and bearish responses could result in a swing failure, giving us the perfect opportunity to hunt trendline liquidity. Acumulation is the plan.

JASMY – A Volatile Setup with x3 Potential 🔸 After bottoming out at 0.003 and spending over a year in accumulation, JASMY finally broke above the key 0.008 resistance zone in February 2024. That breakout triggered a series of explosive moves – but just as violent were the drops that followed.
🔸 What stands out:
• The first post-breakout spike found a new support at 0.015.
• Then came a second vertical move toward 0.06, followed (of course) by a brutal drop.
• But… 0.008 held, and by late June, the chart printed a higher low, showing that buyers became interested.
📍 Right now, the price has reclaimed the 0.015 zone and is trying to stabilize above it. If this level holds, it could become the new base for the next wave.
💡 My plan?
This is very speculative, but I like the setup.
I’m looking to buy around 0.015–0.016, with clear negation below 0.010.
Target? Around 0.045, for a potential x3 move and a tasty 1:8 risk/reward.
⚠️ I’m not the guy who repeats the cliché “ only trade what you can afford to lose, ”
but seriously – this one is for clubbing money, not summer vacation money.
Let the volatility work in our favor. 🚀
JASMY/USDT – End of the Bearish Era? Golden Pocket Retest?🧠 Technical Overview:
The JASMY chart is showing a very strong technical signal after breaking out from a major descending trendline that had capped the price since December 2024. This breakout marks the potential end of a medium-term bearish phase and the beginning of a new accumulation and bullish expansion cycle.
The breakout was confirmed with strong momentum and solid candle structure, indicating possible entry from institutional buyers or smart money.
Currently, the price is pulling back to retest the Fibonacci Golden Pocket (0.5–0.618 retracement) zone between $0.01520 – $0.01622 — a critical area that often acts as the launchpad for the next leg up.
📊 Pattern and Market Structure:
✅ Descending Trendline Breakout → Signals mid-term reversal
✅ Golden Pocket Retest → Ideal accumulation zone
✅ Previous resistance flipped to support → Confirming structure flip
✅ Potential formation of a Bullish Flag or Cup & Handle pattern in the near future
✅ Bullish Scenario (High Probability):
If the price holds the Golden Pocket zone and forms a higher low, the bullish market structure remains intact and strong.
📍 Key Upside Targets:
$0.02040 → Minor resistance & structure pivot
$0.02238 → Key structural resistance
$0.02643 → Previous high before breakdown
$0.03206 – $0.03500 → Major psychological levels
$0.03944 – $0.04694 → Expansion targets
Max Bullish Target: $0.05775 – $0.05950 (weekly structure resistance zone)
If price bounces from this level with increased volume, this could kickstart an impulsive Wave 3-style rally.
⚠️ Bearish Scenario (If Support Fails):
If the price fails to hold the $0.01520 support:
$0.01300 → Minor horizontal support
$0.01211 → 0.618 extension of the prior move
$0.01189 → Strong support and last line of defense before full breakdown
A breakdown below this golden zone could trigger short-term panic selling, but overall bullish structure remains valid as long as the price stays above $0.01000.
🧭 Key Levels to Watch:
🔑 Support: $0.01520 – $0.01622 (Golden Pocket)
🚨 Breakout Level: $0.01764
🎯 Major Targets: $0.02238 – $0.02643 – $0.03500 – $0.04694 – $0.05950
🔍 Conclusion:
A breakout from the long-term downtrend followed by a clean retest into the Fibonacci Golden Pocket is a classic bullish continuation setup. As long as this support holds, the upside potential is substantial.
This setup offers an excellent risk-reward ratio for swing traders and fits perfectly with the “Buy the Retest” strategy. Momentum traders and technical analysts should watch this zone closely.
📢 Market Sentiment:
Moderately Bullish ➜ Highly Bullish
(Upon confirmation of bullish candle within the Golden Pocket)
#JASMY #JASMYUSDT #CryptoBreakout #GoldenPocket #AltcoinReversal #TechnicalAnalysis #FibonacciSupport #CryptoTrading #TrendReversal #BullishScenario

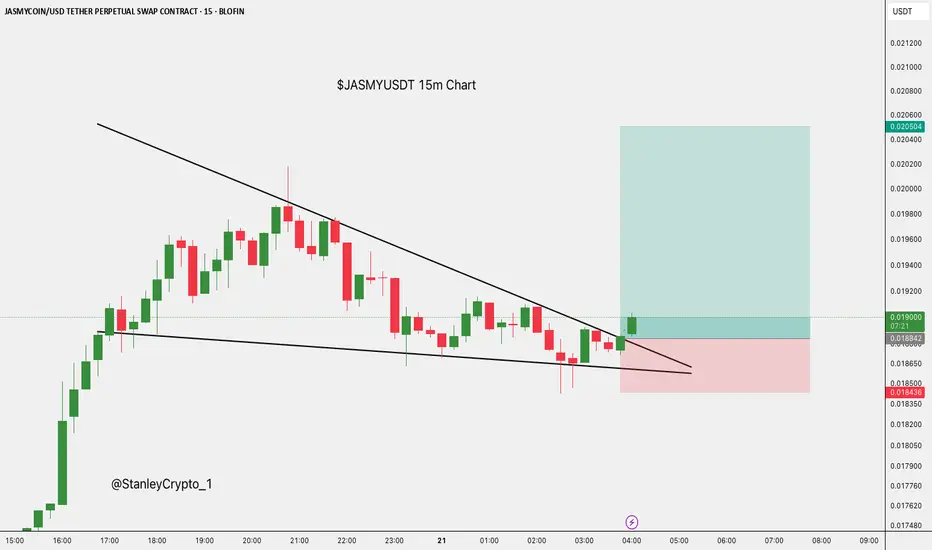
$JASMY 15Min Breakout Setup.$JASMY/USDT – 15Min Breakout Setup
- Entry: CMP
- SL: $0.018432
- Targets:
- TP1: $0.019604
- TP2: $0.020505
Wedge breakout forming.
DYOR, NFA
Live trade hello friends👋
Considering the fall that we had, you can see that the buyers supported the price at the support point and caused it to grow. Now with the return of the price and the construction of an upward pattern, you can see that we can enter into the transaction with capital and risk management and move to the specified goals with it.💰
🔥Join us for more signals🔥
*Trade safely with us*

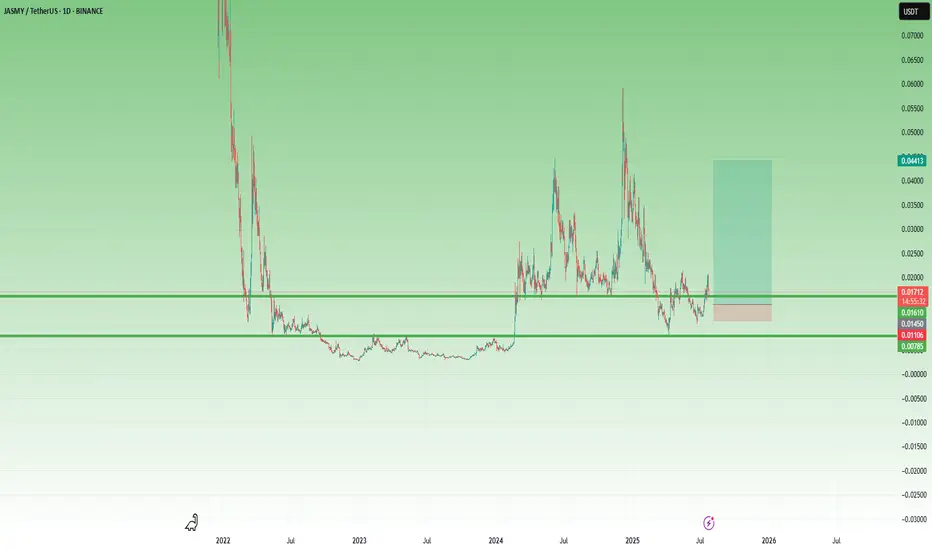
JASMY/USDT – Golden Support Rebound Toward Explosive Targets!📌 Chart Explanation:
JASMY is showing strong potential for a bullish reversal from the key demand zone (highlighted in yellow) around the $0.01100–$0.01300 range. This zone has historically acted as a major support level since 2022, and it has just been successfully retested during the latest correction.
Following this bounce, price action indicates the beginning of a possible uptrend formation. If bullish momentum continues, we may see price reaching multiple resistance targets on the way up:
🎯 Upside Targets (Resistance Levels):
1. 🟡 $0.01704 – Minor resistance
2. 🟡 $0.02340 – Medium resistance
3. 🟡 $0.03969 – Previous major swing high
4. 🟡 $0.05712 – Psychological target
5. 🟡 $0.08716 – Mid-term target
✅ Bullish Signals:
Strong bounce from historical support implies possible accumulation.
Early signs of Higher Low formation.
Potential gain exceeding +500% if upper targets are achieved.
⚠️ Risk Note:
If the $0.01100 support fails, this bullish scenario becomes invalid.
Beware of fakeouts or potential bull traps.
🧠 Conclusion:
JASMY is setting up for a possible bull run from the golden support zone. As long as price stays above $0.01100, the mid-term outlook remains bullish.
#JASMY #JASMYUSDT #CryptoAnalysis #AltcoinSeason #BreakoutCrypto #BinanceAnalysis #TechnicalAnalysis #CryptoSignals #BullishSetup #SupportRebound

JASMY Long Swing Setup – Oversold Bounce from Major SupportJASMY has seen a sharp decline in recent weeks, but price has now landed in a key support zone. With a potential bounce on the table, we’re eyeing the $0.015–$0.01355 range for a possible long entry toward resistance tests.
📌 Trade Setup:
• Entry Zone: $0.015 – $0.01355
• Take Profit Targets:
o 🥇 $0.020
o 🥈 $0.024
o 🥉 $0.030
• Stop Loss: Daily close below $0.013

Important support and resistance levels: 0.019249-0.024672
Hello, traders.
If you "Follow", you can always get the latest information quickly.
Have a nice day today.
-------------------------------------
(JASMYUSDT.P 1D chart)
It is showing signs of breaking away from the medium- to long-term downtrend line (1).
However, since it is located below the M-Signal indicator of the 1M chart, a short and quick response is required when trading.
It is expected that the price will start to rise if it rises above the important support and resistance area of 0.019249-0.024672 and maintains the price.
Even if it does not rise and falls, if the price is maintained above the downtrend line (1), it is expected that there will be an increase to eventually rise to the important support and resistance area.
The volatility period is around June 24, which is similar to the BTC volatility period, so it seems that it will have a big impact on the movement of BTC.
Since the HA-Low indicator of the 1D chart is formed at the 0.014447 point, if it is supported, it is an aggressive buying period.
-
Thank you for reading to the end.
I hope you have a successful transaction.
--------------------------------------------------
- This is an explanation of the big picture.
(3-year bull market, 1-year bear market pattern)
I will explain more details when the bear market starts.
------------------------------------------------------
