💹🎯 "JASMY Analysis: Heavy Drop or Buying Opportunity?" 📈💼🕵️♂️ Let's dive into the analysis of this cryptocurrency, which operates in the Proof of Stake domain and has recently gained popularity.
🕓 In higher time frames, this coin has been in a range-bound state after reaching its lowest price of 0.003004, forming a weekly box for nearly 500 days. We've

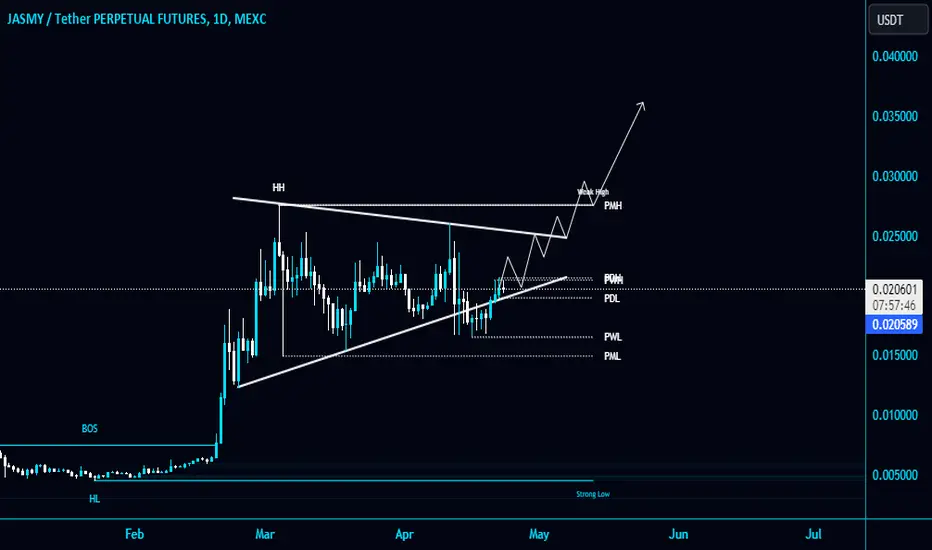
JASMYUSDT?
Hi all,
Bullish notes from this triangle.
I hope to see 0.030000
Next resistance is 0.04 next 0.12
It's based on previous resistance.
As usual coins are 1:1
Know your risk
Regards

JASMY - best looking AltcoinThe Coin I am currently very interested in is JASMY as we have a lot of confluences on this chart even if it seems a littly messy. Overall we can say it looks like as we are in a wave 5 after completing the wave 4 on the 18.03. We have respected the range here for a very long time and we had some wi


#JASMY/USDT is back in the Bullish Peanut Pattern in Daily TF!#JASMY/USDT is back in the Bullish Peanut Pattern in Daily TF!
SEED_DONKEYDAN_MARKET_CAP:JASMY now needs to break the PMH $0.00275 resistance level and upper trendline to gain bullish momentum. The strong support level is PWL $0.0166.
JASMY is just vaporware.I'm pretty sure Jasmy is a scam.
In 3 years, they haven't produced a single line of code.
The Product Data Locker is just a User Dashboard from what I've seen.
Jasmy claims they do not endorse the selling of crypto assets. Strange warning for a blockchain company.
Keeps pivoting and using buz

JASMY LOOKS BEARISH From where we entered "start" on the chart, it seems that JASMY has entered a triangle pattern.
In wave E, the last wave of this triangle can be completed and we can see a drop.
We specified the targets on the chart, the final target is the green line (TP).
Closing a daily candle above the invali

JASMY a coin a Hope breaking a triangle!Jasmy is breaking a 0.023$ level, which is a line that define a triangle re accumulation of this price trend.
;-)
JasmyCoin (JASMY) is a cryptocurrency project of a Tokyo-based Internet of Things (IoT) provider Jasmy Corporation. As a system, the Internet of Things includes mechanical and digital e

Jasmy: 3 peaks and a domed houseTop is in for Jasmy
Is the proct just vapouware?
Cons:
- Do you really trust a bunch of Japanese boombers for Web3.
- Have Sony done anything?
- 50 billion tokens
- They dumped 45 billion on their community
- 3 years and there is no public code on github

JASMY/USDT: Enter on Momentum with Buy Stop at 0.024JASMY/USDT has breached bullish consolidation with notable momentum. For traders looking to ride the upward trend, placing a buy stop at 0.024 is recommended to ensure entry on continued strength. With a solid risk/reward ratio of 3.01, this trade aims to leverage the current breakout. Stay vigilant

See all ideas